Fig. 3.
Download original image
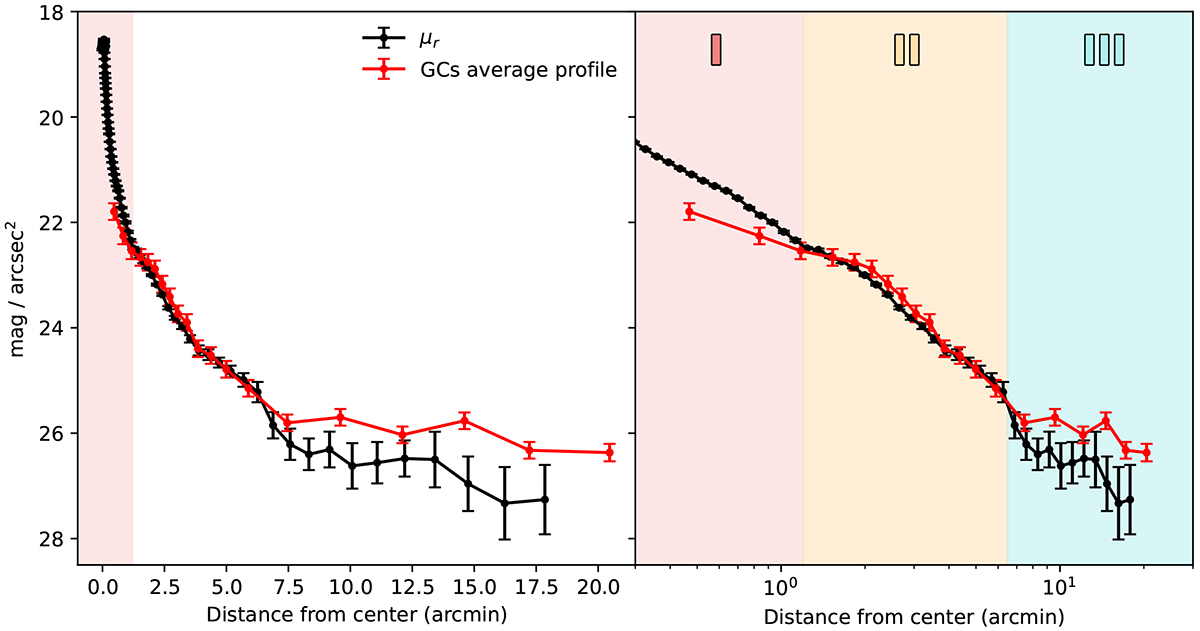
Surface brightness profile of NGC 3311 in the r band (black line) and the radially averaged globular cluster number density profile (red line), arbitrarily shifted to match the surface brightness. The left panel shows the cluster-centric distance on a linear scale, and the right panel uses a log scale. The shaded areas indicate the three regimes observed in the GC number density profile: (I) where incompleteness effects are significant, (II) where the GCs follow the galaxy light, and (III) where the GCs trace the ICL. Region I is also shaded in the left panel for reference. At distances larger than ∼6 arcmin from the centre, the shallower profiles indicate the contribution of the ICL baryons, i.e. diffuse light plus intra-cluster GCs.
Current usage metrics show cumulative count of Article Views (full-text article views including HTML views, PDF and ePub downloads, according to the available data) and Abstracts Views on Vision4Press platform.
Data correspond to usage on the plateform after 2015. The current usage metrics is available 48-96 hours after online publication and is updated daily on week days.
Initial download of the metrics may take a while.