| Issue |
A&A
Volume 566, June 2014
|
|
|---|---|---|
| Article Number | A17 | |
| Number of page(s) | 26 | |
| Section | Galactic structure, stellar clusters and populations | |
| DOI | https://doi.org/10.1051/0004-6361/201322765 | |
| Published online | 02 June 2014 | |
Online material
Source information.
Parallaxes and proper motions of high-mass star-forming regions.
Appendix A
Here we describe the star-forming regions whose parallaxes measured. In particular, we show their position in relation to compact dust emission imaged (mostly) at 870 μm from the APEX Telescope Large Area Survey of the GALaxy (ATLASGAL, Schuller et al. 2009). For the two sources at b> 1.5°, G035.20−01.73 and G037.43+01.51, which are not covered by ATLASGAL, we use 22 μm dust emission from the Wide-field Infrared Survey Explorer (WISE, Wright et al. 2010) as backgrounds. For HMSFRs that are covered by the 13CO Galactic Ring Survey (GRS, Jackson et al. 2006), we used GRS data as the background images, with ATLASGAL brightness shown as contours. In general, we found that the Class II CH3OH masers are coincident with, or very close to, the peaks of the dust emission, consistent with the findings of Urquhart et al. (2013). The same is true for the H2O masers, selected to be from HMSFRs.
Appendix A.1: G351.44+00.65
G351.44+00.65 is associated with NGC 6334I(N), a dense clump of the well studied star-forming region complex NGC 6334, also known as the Cat’s Paw Nebula (Beuther et al. 2008; Persi & Tapia 2010). Its VLSR estimated from NH3 thermal emission is −5 km s-1 (Beuther et al. 2005).
We observed two background QSOs, but only the data from the one nearest to the maser target, J1712−3514, were used for the parallax fitting. Combining data from seven distinct 12 GHz maser spots, the best estimate of the parallax value is 0.744 ± 0.076 mas. This corresponds to a distance of 1.35  kpc, 20% smaller than the photometric distance of 1.74 ± 0.31 kpc (Neckel 1978) and the near kinematic distance of 1.7 kpc (to derive the kinematic distances of the targets we employed the Galactic rotation model from Brunthaler et al. 2011, which uses the rotation parameters R0 = 8.33 kpc and Θ0 = 243 km s-1.). The measured distance places G351.44+00.65 at a Galactocentric radius of 6.97
 kpc (using R0 = 8.33 kpc).
We identified ten maser spots toward this source, but the distribution was difficult to model by simple expansion, infall, or rotation. This is expected for a methanol maser source. By adding the mean relative proper motion of (0.11 ± 0.55, −0.31 ± 0.55) mas yr-1 (Table A.4) to the absolute proper motion of maser feature 1, (0.20 ± 0.19, −1.86 ± 0.71) mas yr-1, we obtain an absolute proper motion of ( ,
,  ± 0.58, −2.17 ± 0.90) mas yr-1 for the exciting star (Table 2).
Appendix A.2: G011.49−01.48
G011.49−01.48 is an active HMSFR containing the bright IRAS source 18134−1941 with a luminosity of ~4 × 10³L⊙ and methanol maser emission. The VLSR is 11 km s-1 (from NH3 line, Sunada et al. 2007). The spectrum of the observed 12.2 GHz methanol masers consists of two features, with the bright one at 9.1 km s-1 and the faint one at 15.2 km s-1. The position of the maser agrees within 0′′.5 with a 1.2 mm dust source (Hill et al. 2005).
The four background sources J1808−1822, J1821−2110, J1825−1817, and J1832−2039 were detected in all epochs. The derived parallax values from these four QSOs are consistent, ranging from 0.77 to 0.95 mas (Table A.2). Since the J1825−1817 and J1832−2039 have larger separations (>3°) from the maser than the other two calibrators, the parallax uncertainties obtained with these two sources are about five times larger than those with the other two sources. Therefore, we only used the two nearby background sources J1808−1822 and J1821−2110 to estimate the parallax and derived a value of 0.800 ± 0.033 mas, corresponding to a distance of 1.25 kpc. In Fig. 1 we showed the parallax and proper motion fits. Our distance is 30% smaller than the near kinematic distance of 1.6 kpc. The measured distance places G011.49−01.48 at a Galactocentric radius of 7.08 kpc (using R0 = 8.33 kpc).
Towards G011.49−01.48, we identified two methanol maser spots. At a distance of 1.25 kpc, the feature separation is 346 ± 4 AU and their relative velocity is 5.7 ± 0.5 km s-1 (Fig. A.3). The absolute proper motion of maser feature 1 is 1.16 ± 0.07 mas yr-1 toward the east and −0.16 ± 0.41 mas yr-1 toward the north. Adding the mean relative proper motion of (0.26 ± 0.51, −0.45 ± 0.51) mas yr-1, we derived an absolute proper motion of (,  ± 0.52, −0.61 ± 0.65) mas yr-1 for the exciting star (Table 2).
Appendix A.3: G014.33−00.64
G014.33−00.64 is a Galactic star-forming region, first identified from the far-infrared 70-μm Galactic plane survey (Jaffe et al. 1982). VLSR of this region is about 22 km s-1. Sato et al. (2010a) measured the water maser parallax and proper motion with VERA.
Appendix A.4: G014.63−00.57
G014.63−00.57 is an HMSFR containing both 22 GHz water and class I methanol masers (Val’tts et al. 2000). The observed 22 GHz water maser presents a spectrum with only one peak with VLSR of 19 km s-1. The maser position coincides with an extended green object (EGO), which has been classified as a massive young stellar object (MYSO) outflow candidate (Cyganowski et al. 2008).
Three (J1825−1817, J1809−1520, and J1810−1626) of the four background sources were detected in all the epochs. Parallax values determined with individual background sources were consistent, ranging from 0.49 to 0.61 mas. Figure 1 presents the parallax and proper motion fit of 0.546 ± 0.022 mas, combining the data from three background sources.
We identified six water maser spots (Table A.4). These spots trace a bipolar outflow with a size of 800 AU and speed of 30 km s-1 (Fig. A.3). The mean relative motion (with respect to feature 1), obtained by averaging the motion of the spots in the blue and red lobes separately and then averaging these mean values, is (−0.11 ± 1.20, 1.31 ± 1.20) mas yr-1. By adding the mean relative proper motion to the absolute proper motion, (0.33 ± 0.03, −3.38 ± 0.09) mas yr-1 of feature 1, we obtain an absolute proper motion of (,  , −2.07 ± 1.20) mas yr-1 for the exciting star (Table 2).
Appendix A.5: G015.03−00.67
The CH3OH maser toward G015.03−00.67 is from the giant molecular cloud M17 SW with a VLSR of about 22 km s-1. Xu et al. (2011) measured the maser parallax and proper motion with the VLBA.
Appendix A.6: G034.39+00.22
The H2O masers toward G034.39+00.22 are from an infrared dark cloud MSXDC G034.43+00.24, which is associated with the prototypical ultra-compact HII region G34.3+0.2 (Reid & Ho 1985). The VLSR is about 57 km s-1. Kurayama et al. (2011) reported a maser parallax of 0.643 ± 0.049 mas as measured with VERA.
Appendix A.7: G035.02+00.34
G035.02+00.34 is an active HMSFR, containing hydroxyl, water, and methanol masers. The LSR velocity of the molecular cloud (from 13CO GRS survey) hosting this star-forming region is 52 km s-1. The water masers are found in two regions of emission, with brighter spots near VLSR = 45 km s-1 and fainter ones near VLSR = 56 km s-1, perhaps tracing a bipolar outflow.
Of the four background sources, J1903+0145 and J1857−0048 were not detected in the last epoch; parallax uncertainties derived from J1904+0110 were larger than 0.05 mas, probably due to its large separation (>2°) from the maser target, which resulted in large systematic errors. Thus, only data from J1855+0251 were used to fit the parallax and proper motion (Fig. 1). The fits, combining the positions of the two maser spots, 1 and 6 in Table A.4, which were detected in all five epochs, and allowing for different proper motions, yielded a parallax of 0.431 ± 0.040 mas. Our trigonometric parallax for G035.02+00.34 corresponds to a distance of 2.32 kpc, which places it at a Galactocentric radius of 6.54
 kpc (using R0 = 8.33 kpc).
In total, we identified 17 water maser spots at different epochs. For 11 of them that were detected in at least three successive epochs, we derived relative proper motions. The distribution and internal motion of these spots indicate a bipolar outflow with a size of 650 AU and a speed of 25 km s-1 (Fig. A.3). By adding the mean relative proper motion of (−0.91 ± 0.90, −0.40 ± 0.90) mas yr-1 (Table A.4) to the absolute proper motion, (−0.01 ± 0.10, −3.21 ± 0.07) mas yr-1, of maser feature 1, we obtain an absolute proper motion of (,  0.92 ± 0.90, −3.61 ± 0.90) mas yr-1 for the exciting star (Table 2).
Appendix A.8: G035.19−00.74
The CH3OH maser G035.19−00.74 is associated with a bright IRAS source 18556+0136. The VLSR of this region is about 35 km s-1. Zhang et al. (2009) measured the maser parallax and proper motion with the VLBA.
Appendix A.9: G035.20−01.73
The CH3OH maser G035.20−01.73 is associated with H II region W48A. The VLSR is about 43 km s-1. Zhang et al. (2009) measured the maser parallax and proper motion with the VLBA.
Appendix A.10: G037.43+01.51
G037.43+01.51 contains a bright IRAS source 18517+0437 with a luminosity of ~1 × 10⁴L⊙, and water and Class II methanol masers. The VLSR is 44 km s-1 (from C18O (2–1), López-Sepulcre et al. 2010). We observed both the 12.2 GHz methanol and the 22 GHz water masers. The positions and central velocities of these two masers agreed within 0.2 arcsec and 1 km s-1, respectively.
At 22 GHz all four background sources were detected, but at 12 GHz we detected only two of them, J1856+0610 and J1855+0251. In Fig. 1, we show the parallax and proper motion fits for methanol and water masers, respectively. The parallax results from these two maser species were consistent (Table A.2), although the methanol masers yielded larger uncertainties, which may be due to the larger image sizes owing to interstellar scattering. A combined fitting using both maser species, allowing for different proper motions of the water and methanol masers, yielded a parallax of 0.532 ± 0.021 mas. This corresponds to a distance of 1.88  kpc, which places G037.43+01.51 at a Galactocentric radius of 6.90 kpc (using R0 = 8.33 kpc).
The absolute proper motion of the methanol maser (usually within about ±5 km s-1 of the exciting star) is (−0.45 ± 0.08, −3.69 ± 0.20) mas (see Table A.4). Adding an uncertainty of 5 km s-1 in transferring the maser to the central star’s motion, yields a proper motion of (−0.45 ± 0.35, −3.69 ± 0.39) mas for the central star (Table 2).
Appendix A.11: G043.79−00.12
G043.79−00.12, also known as OH 43.8−0.1, exhibits hydroxyl, water, and class II methanol masers. The VLSR is 44 km s-1 (from 13CO emission). The water maser has tens of emission features with VLSR between 30 to 60 km s-1.
The three background sources were detected at all epochs. Position residuals of J1913+0932 showed a larger scatter than for the other two background sources, because this source was heavily resolved on long baselines. The best estimate of the parallax, combining the results for J1905+0952 and J1907+0907 is 0.166 ± 0.005 mas, corresponding to a distance of 6.02 kpc, which places G043.79−00.12 at a Galactocentric radius of 5.74
 kpc (using R0 = 8.33 kpc). The parallax and proper motion fitting is shown In Fig. 1.
We identified 12 distinct water maser spots, distributed over ~0.2′′. The distribution and proper motions of these spots appear fairly random and we did not model an outflow (Fig. A.3). By adding the mean relative proper motion, (0.21 ± 0.35, −0.06 ± 0.35) mas yr-1, to the absolute proper motion, (−3.23 ± 0.01, −6.14 ± 0.04) mas yr-1 of maser feature 1, we derive an absolute proper motion of (,  ) = (−3.02 ± 0.36, −6.20 ± 0.36) mas yr-1 for G043.79−00.12 for the central star (Table 2).
Appendix A.12: G043.89−00.78
G043.89−00.78 contains water and class II methanol masers (Szymczak et al. 2000; Hofner & Churchwell 1996). The VLSR is 54 km s-1 (from the 13CO GRS survey). We detected water masers from 45 to 65 km s-1.
Although all background sources were detected at all epochs, only the three sources nearest in angle to the masers (with a separation smaller than 3°) yielded consistent parallaxes. The best estimate of the parallax, combining the results from three background sources, is 0.121 ± 0.020 mas. This corresponds to a distance of 8.26 kpc, which places G043.89−00.78 at the far side of the Sagittarius arm with a Galactocentric radius of 6.19
 kpc (using R0 = 8.33 kpc).
We obtained proper motions for only four maser spots. By adding the mean relative proper motion of (−0.11 ± 0.30, −0.13 ± 0.30) mas yr-1 (the uncertainty given here is a realistic uncertainty corresponding to a velocity of 10 km s-1) to the absolute proper motion (−2.64 ± 0.04, −6.30 ± 0.06) mas yr-1 of maser feature 3, we obtained an absolute proper motion of (, 2.75 ± 0.30, −6.43 ± 0.30) mas yr-1 for G043.89−00.78 for the central star (Table2).
Appendix A.13: G045.07+00.13
G045.07+00.13 hosts numerous ultra-compact H II regions, maser sources, and outflows from young and highly embedded OB stellar clusters (Rivera-Ingraham et al. 2010). The VLSR is 59 km s-1 (from the 13CO GRS survey). The water masers we observed consist of tens of emission features for 55 <VLSR< 65 km s-1.
For this source, we observed at 16 epochs spanning 1.5 years. Individual fits for the two background sources yielded consistent results. The best estimate of the parallax is 0.129 ± 0.007 mas. This corresponds to a distance of 7.75 kpc, which places it at the far side of the Sagittarius arm, with a Galactocentric radius of 6.17
 kpc (using R0 = 8.33 kpc).
We measured proper motions for 12 spots. The distribution of these spots were difficult to model with a single outflow (Fig. A.3). Therefore we averaged the motions to derive a mean relative proper motion, (−0.23 ± 0.26, 0.38 ± 0.26) mas yr-1. Adding the absolute proper motion of (−2.98 ± 0.01, −6.49 ± 0.02) mas yr-1 of maser feature 2, we derived an absolute proper motion of (, ) = (−3.21 ± 0.26, −6.11 ± 0.26) mas yr-1 for the central driving star (Table 2).
Appendix A.14: G045.45+00.05
The water masers toward G045.45+00.05 may belong to the same molecular cloud complex as G045.07+00.13, with a projected separation of about 56 pc. The water masers have emission features with VLSR near 50 km s-1, blueshifted relative to thermal line emission, with VLSR = 59 km s-1 from the 13CO GRS survey.
We observed four background sources, all of which were detected at all five epochs. Parallax fits based on individual background sources ranged from 0.10 to 0.15 mas. The best estimate of the parallax, combining the four background sources, is 0.119 ± 0.017 mas. This corresponds to a distance of 8.40 kpc, which is consistent with distance of G045.07+00.13 and supports their association.
We measured the proper motions of four maser spots. Averaging these, we obtained a mean relative proper motion of (−0.55 ± 0.38, 0.22 ± 0.54) mas yr-1. Adding the absolute proper motion of (−1.79 ± 0.04, −5.78 ± 0.07) mas yr-1 of maser feature 2, we derived an absolute proper motion of
(, 2.34 ± 0.38, −6.00 ± 0.54) mas yr-1 for the central driving star (Table 2).
Appendix A.15: W 51 region
The W51 star-forming region is near the tangent point of the Sagittarius arm. Toward this region are three maser sites with parallax measurements: the methanol maser G049.48−00.36 toward W51 IRS2 that was measured with the VLBA by Xu et al. (2009), the water maser G049.49−00.38 toward W51 main/south that was measured with the VLBA by Sato et al. (2010b), and the water maser G049.19−00.34 reported in this paper.
G049.19−00.34 belongs to the high-velocity stream in the W51 star-forming complex (Carpenter & Sanders 1998; Parsons et al. 2012). The position of the maser emission agrees with the millimeter dust continuum source BGPS 6312. The VLSR is 68 km s-1 (from the 13CO GRS survey). The spectrum of the maser emission displays four features with 55 <VLSR< 85 km s-1.
The four background sources were detected at all the epochs. The parallaxes derived individually from the four background sources are consistent, ranging from 0.170 to 0.227 mas. Probably owing to a large separation (>2°) from the target maser, the parallax determined using J1930+1532 as a phase reference shows higher residuals than that of the other three background sources. Our best estimate of the parallax, combining data from the three background sources nearest the maser, is 0.192 ± 0.009 mas. This corresponds to a distance of 5.21 kpc, consistent with the recently derived parallax distance to W51 main/south of 5.41
 kpc (Sato et al. 2010b) and the distance to W51 IRS2 5.12
 kpc (Xu et al. 2009).
Toward G049.19−00.34, we identified 16 water maser spots. The distribution and proper motions of these spots suggest a bipolar outflow, with a size of 290 AU and an outflow speed of 40 km s-1 (Fig. A.3). We fitted their proper motions with an expansion model, with results given in Table A.3. By adding the fitted relative proper motion of the central star to the absolute proper motion of maser feature 1, we derived an absolute proper motion of (, 3.06 ± 0.40, −5.69 ± 0.40) mas yr-1 for the central star in G049.19−00.34.
Appendix A.16: G052.10+01.04
The H2O maser toward G052.10+01.04 is associated with the bright IRAS source 19213+1723. The VLSR of this region is about 42 km s-1. Oh et al. (2010) measured the maser’s parallax and proper motion with VERA.
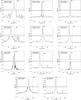 |
Fig. A.1
Average cross-power (Stokes I) spectra of the eleven observed 12 GHz and 22 GHz masers from the first epoch. Upper panels: full amplitude scale. Lower panels: enlarged view of the weaker spectral features. Dashed lines mark the LSR velocities (from CO line data) of molecular cores hosting the star-forming regions. |
| Open with DEXTER | |
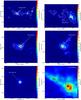 |
Fig. A.2
Maser positions overlaid on dust and/or molecular emissions. The position of the maser is indicated with a cross. Top left panel: the NGC 6334 complex, color image and contours indicate 870 μm dust emission from the ATLASGAL survey (Schuller et al. 2009), with contour levels of 1, 5, 10, 20, 30 Jy beam-1. Top right panel: G015.03−00.67 overlaid on 870 μm dust emission with contour levels of 1, 3, 7,11, 15, 19 Jy beam-1. Top right panel: G011.49−01.48, color image and contours indicate 870 μm dust emission, with contour levels of 1, 2, 3, 4 Jy beam-1. Middle left panel: G014.33−00.64, color image and contours indicate 870 μm dust emission, with contour levels of 0.5, 1, 2, 4, 8 Jy beam-1. Middle right panel: G014.63−00.57, color image and contours indicate 870 μm dust emission, with contour levels of 0.5, 1, 2, 4 Jy beam-1. Bottom left panel: G015.03−00.67 overlaid on 870 μm dust emission with contour levels of 1, 3, 7,11, 15, 19 Jy beam-1. Bottom left panel: G011.49−01.48, color image and contours indicate 870 μm dust emission, with contour levels of 1, 2, 3, 4 Jy beam-1. Bottom right panel:G034.39+00.22, false color indicates the intensity of the 13CO (J = 1 − 0) line integrated over 50–60 km s-1, contours are the 870 μm dust emission, with contour levels of 0.5, 1, 3, 5, 7, 10, 20, 30 Jy beam-1. Figure A.2 continued on next page. |
| Open with DEXTER | |
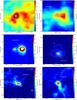 |
Fig. A.2
Continued from previous page. Top left panel: G035.02+00.34, color image is the intensity of the 13CO (J = 1 − 0) emission integrated over 43 <VLSR< 60 km s-1, contours are 870 μm continuum emission with levels of 0.3, 0.6, 1, 2, 3, 4, 5 Jy beam-1. Top right panel: G035.19−00.74, color image is the intensity of the 13CO (J = 1 − 0) emission integrated over 30 <VLSR< 40 km s-1, contours are 870 μm dust emission with levels of 0.5, 1, 2, 4, 6, 8, 10 Jy beam-1. Middle left panel: G035.20−01.73, color image with contours indicate the intensity of 22 μm dust emission from the Wide-field Infrared Survey Explorer (WISE, Wright et al. 2010), with contour levels of 0.01, 0.02, 0.03 and 0.04 Jy beam-1. The central blank pixels are due to saturation. Middle right panel: G037.43+01.51, color image is 22 μm dust emission from WISE, with contour levels of 0.01, 0.02, 0.03 and 0.04 Jy beam-1. Bottom left panel: G043.79−00.12, color image is 13CO (J = 1 − 0) emission integrated over 35 <VLSR< 50 km s-1, contours are 870 μm dust emission, with levels of 0.2, 0.5, 1, 3, 5 and 7 Jy beam-1. Bottom right panel: G043.89−00.78, color image is the 13CO (J = 1 − 0) emission integrated over t 45 <VLSR< 75 km s-1, contours are 870 μm dust emission, with levels of 0.3, 0.6, 1, 3, 5 and 7 Jy beam-1. Figure A.2 continued on next page. |
| Open with DEXTER | |
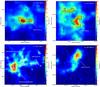 |
Fig. A.2
Continued from previous page. Top left panel: G45.07+00.13, color image indicates the intensity of 13CO (J = 1 − 0) emission integrated over 45 <VLSR< 75 km s-1, contours are 870 μm continuum emission, with levels of 0.2, 0.5, 1, 3, 5 and 7 Jy beam-1. Top right panel: G045.45+00.05, color image indicates the intensity of 13CO (J = 1 − 0) emission integrated over 45 <VLSR< 75 km s-1, contours are 870 μm continuum emission with levels of 0.2, 0.5, 1, 3, 5 and 7 Jy beam-1. Bottom left panel: W51 star-forming complex, color image indicates the intensity of the 13CO (J = 1 − 0) emission integrated over 50 <VLSR< 75 km s-1, contours are 870 μm continuum emission with levels of 0.5, 1, 3, 5 7, 10, 20, ..., 70 Jy beam-1. Bottom right panel: G052.10+01.04, color images indicates the intensity 13CO (J = 1 − 0) emission integrated over 38 <VLSR< 46 km s-1, contours are 870 μm continuum emission with levels of 0.2, 0.4, 0.6, 0.8, 1.0 and 1.2 Jy beam-1. |
| Open with DEXTER | |
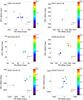 |
Fig. A.3
Relative proper motions of maser spots, by removing absolute proper motions listed in Table 2. Toward G037.43+1.51, squares and circles denote methanol and water masers, respectively. |
| Open with DEXTER | |
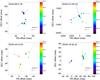 |
Fig. A.3
continued. |
| Open with DEXTER | |
Observation information.
Detailed results of parallax and proper motion.
Best-fitting models for H2O maser kinematics in G049.19−00.34.
Relative inner motions.
© ESO, 2014
Current usage metrics show cumulative count of Article Views (full-text article views including HTML views, PDF and ePub downloads, according to the available data) and Abstracts Views on Vision4Press platform.
Data correspond to usage on the plateform after 2015. The current usage metrics is available 48-96 hours after online publication and is updated daily on week days.
Initial download of the metrics may take a while.