Free Access
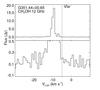
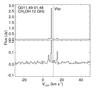
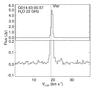
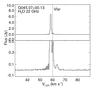
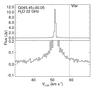
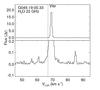
Fig. A.1
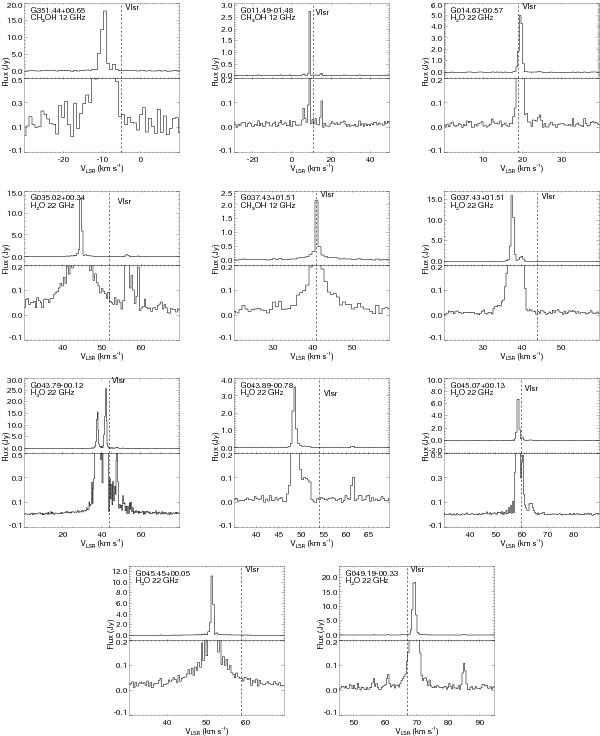
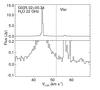
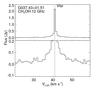
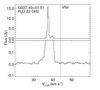
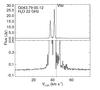
Average cross-power (Stokes I) spectra of the eleven observed 12 GHz and 22 GHz masers from the first epoch. Upper panels: full amplitude scale. Lower panels: enlarged view of the weaker spectral features. Dashed lines mark the LSR velocities (from CO line data) of molecular cores hosting the star-forming regions.
This figure is made of several images, please see below:

Current usage metrics show cumulative count of Article Views (full-text article views including HTML views, PDF and ePub downloads, according to the available data) and Abstracts Views on Vision4Press platform.
Data correspond to usage on the plateform after 2015. The current usage metrics is available 48-96 hours after online publication and is updated daily on week days.
Initial download of the metrics may take a while.