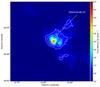
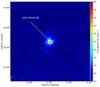
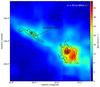
Fig. A.2
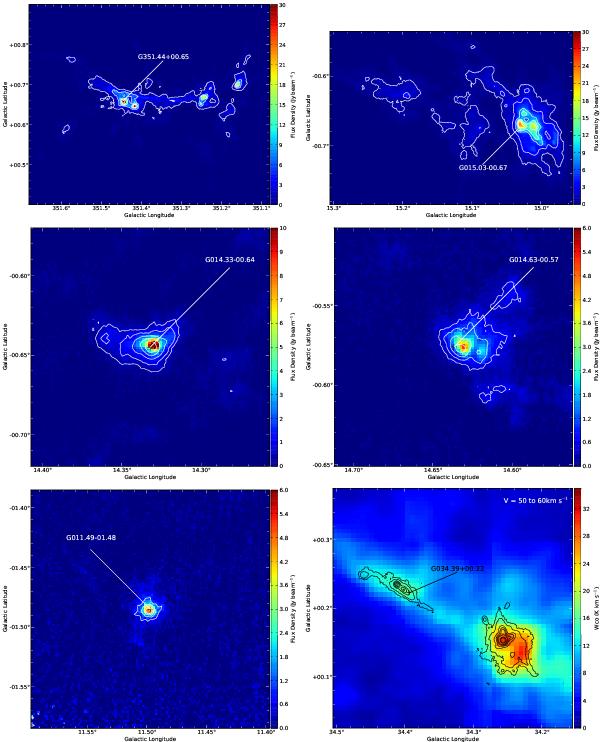
Maser positions overlaid on dust and/or molecular emissions. The position of the maser is indicated with a cross. Top left panel: the NGC 6334 complex, color image and contours indicate 870 μm dust emission from the ATLASGAL survey (Schuller et al. 2009), with contour levels of 1, 5, 10, 20, 30 Jy beam-1. Top right panel: G015.03−00.67 overlaid on 870 μm dust emission with contour levels of 1, 3, 7,11, 15, 19 Jy beam-1. Top right panel: G011.49−01.48, color image and contours indicate 870 μm dust emission, with contour levels of 1, 2, 3, 4 Jy beam-1. Middle left panel: G014.33−00.64, color image and contours indicate 870 μm dust emission, with contour levels of 0.5, 1, 2, 4, 8 Jy beam-1. Middle right panel: G014.63−00.57, color image and contours indicate 870 μm dust emission, with contour levels of 0.5, 1, 2, 4 Jy beam-1. Bottom left panel: G015.03−00.67 overlaid on 870 μm dust emission with contour levels of 1, 3, 7,11, 15, 19 Jy beam-1. Bottom left panel: G011.49−01.48, color image and contours indicate 870 μm dust emission, with contour levels of 1, 2, 3, 4 Jy beam-1. Bottom right panel:G034.39+00.22, false color indicates the intensity of the 13CO (J = 1 − 0) line integrated over 50–60 km s-1, contours are the 870 μm dust emission, with contour levels of 0.5, 1, 3, 5, 7, 10, 20, 30 Jy beam-1. Figure A.2 continued on next page.
Current usage metrics show cumulative count of Article Views (full-text article views including HTML views, PDF and ePub downloads, according to the available data) and Abstracts Views on Vision4Press platform.
Data correspond to usage on the plateform after 2015. The current usage metrics is available 48-96 hours after online publication and is updated daily on week days.
Initial download of the metrics may take a while.