Fig. A.2
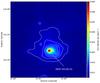
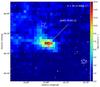
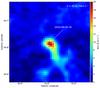
Continued from previous page. Top left panel: G035.02+00.34, color image is the intensity of the 13CO (J = 1 − 0) emission integrated over 43 <VLSR< 60 km s-1, contours are 870 μm continuum emission with levels of 0.3, 0.6, 1, 2, 3, 4, 5 Jy beam-1. Top right panel: G035.19−00.74, color image is the intensity of the 13CO (J = 1 − 0) emission integrated over 30 <VLSR< 40 km s-1, contours are 870 μm dust emission with levels of 0.5, 1, 2, 4, 6, 8, 10 Jy beam-1. Middle left panel: G035.20−01.73, color image with contours indicate the intensity of 22 μm dust emission from the Wide-field Infrared Survey Explorer (WISE, Wright et al. 2010), with contour levels of 0.01, 0.02, 0.03 and 0.04 Jy beam-1. The central blank pixels are due to saturation. Middle right panel: G037.43+01.51, color image is 22 μm dust emission from WISE, with contour levels of 0.01, 0.02, 0.03 and 0.04 Jy beam-1. Bottom left panel: G043.79−00.12, color image is 13CO (J = 1 − 0) emission integrated over 35 <VLSR< 50 km s-1, contours are 870 μm dust emission, with levels of 0.2, 0.5, 1, 3, 5 and 7 Jy beam-1. Bottom right panel: G043.89−00.78, color image is the 13CO (J = 1 − 0) emission integrated over t 45 <VLSR< 75 km s-1, contours are 870 μm dust emission, with levels of 0.3, 0.6, 1, 3, 5 and 7 Jy beam-1. Figure A.2 continued on next page.
Current usage metrics show cumulative count of Article Views (full-text article views including HTML views, PDF and ePub downloads, according to the available data) and Abstracts Views on Vision4Press platform.
Data correspond to usage on the plateform after 2015. The current usage metrics is available 48-96 hours after online publication and is updated daily on week days.
Initial download of the metrics may take a while.