Fig. A.2
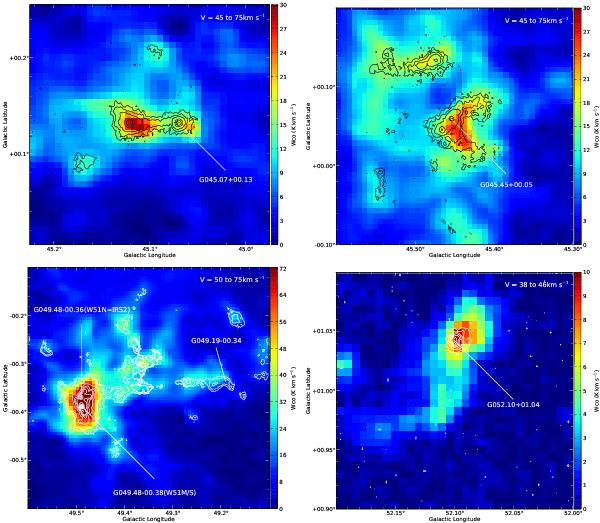
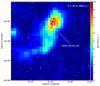
Continued from previous page. Top left panel: G45.07+00.13, color image indicates the intensity of 13CO (J = 1 − 0) emission integrated over 45 <VLSR< 75 km s-1, contours are 870 μm continuum emission, with levels of 0.2, 0.5, 1, 3, 5 and 7 Jy beam-1. Top right panel: G045.45+00.05, color image indicates the intensity of 13CO (J = 1 − 0) emission integrated over 45 <VLSR< 75 km s-1, contours are 870 μm continuum emission with levels of 0.2, 0.5, 1, 3, 5 and 7 Jy beam-1. Bottom left panel: W51 star-forming complex, color image indicates the intensity of the 13CO (J = 1 − 0) emission integrated over 50 <VLSR< 75 km s-1, contours are 870 μm continuum emission with levels of 0.5, 1, 3, 5 7, 10, 20, ..., 70 Jy beam-1. Bottom right panel: G052.10+01.04, color images indicates the intensity 13CO (J = 1 − 0) emission integrated over 38 <VLSR< 46 km s-1, contours are 870 μm continuum emission with levels of 0.2, 0.4, 0.6, 0.8, 1.0 and 1.2 Jy beam-1.
Current usage metrics show cumulative count of Article Views (full-text article views including HTML views, PDF and ePub downloads, according to the available data) and Abstracts Views on Vision4Press platform.
Data correspond to usage on the plateform after 2015. The current usage metrics is available 48-96 hours after online publication and is updated daily on week days.
Initial download of the metrics may take a while.