


| Issue |
A&A
Volume 710, June 2026
|
|
|---|---|---|
| Article Number | A413 | |
| Number of page(s) | 14 | |
| Section | Extragalactic astronomy | |
| DOI | https://doi.org/10.1051/0004-6361/202659474 | |
| Published online | 01 July 2026 | |
An X-ray and optical spectral study of the changing-look narrow-line Seyfert 1 2MASX J0413-0050
1
Dipartimento di Fisica e Astronomia “G. Galilei”, Università di Padova, Vicolo dell’Osservatorio 3, 35122 Padova, Italy
2
INAF – Astronomical Observatory of Padova, Vicolo dell’Osservatorio 5, 35122 Padova, Italy
3
European Southern Observatory, Alonso de Córdova 3107, Casilla 19 Santiago 19001, Chile
4
INAF – Astrophysics and Space Science Observatory of Bologna, Via Gobetti, 93/3, 40129 Bologna, Italy
5
University of Belgrade – Faculty of Mathematics, Department of astronomy, Studentski trg 16, 11000 Belgrade, Serbia
6
Hamburger Sternwarte, Universität Hamburg, Gojenbergsweg 112, 21029 Hamburg, Germany
7
Department of Physics & Astronomy, Texas Tech University, Box 41051 Lubbock, TX 79409-1051, USA
8
Department of Astronomy, University of Geneva, ch. d’Ecogia 16, 1290 Versoix, Switzerland
9
Instituto de Estudios Astrofísicos, Facultad de Ingeniería y Ciencias, Universidad Diego Portales, Avenida Ejercito Libertador 441, Santiago, Chile
10
Kavli Institute for Astronomy and Astrophysics, Peking University, Beijing 100871, China
11
Osservatorio Astronomico di Brera, Istituto Nazionale di Astrofisica (INAF), Via Emilio Bianchi, 46, 23807 Merate, Italy
12
Dipartimento di Scienza e Alta Tecnologia, Università dell’Insubria, Via Valleggio 11, 22100 Como, Italy
13
Physics Department, Technion, Haifa 32000, Israel
14
Dipartimento di Fisica, Università di Roma Tor Vergata, Via della Ricerca Scientifica, 1 Roma 00133, Italy
15
Centre for Astrophysics Research, University of Hertfordshire, College Lane, Hatfield AL10 9AB, UK
16
Aalto University Metsähovi Radio Observatory, Metsähovintie 114, FI-02540 Kylmälä, Finland
17
Aalto University Department of Electronics and Nanoengineering, P.O. Box 15500, FI-00076 AALTO, Finland
★ Corresponding authors: This email address is being protected from spambots. You need JavaScript enabled to view it.
; This email address is being protected from spambots. You need JavaScript enabled to view it.
Received:
16
February
2026
Accepted:
6
May
2026
Abstract
Active galactic nuclei (AGN) showing dramatic spectral and flux variations, either due to changes in the accretion rate (‘changing-state’ CS-AGN) of the supermassive black hole or in the line-of-sight column density (‘changing-obscuration’ CO-AGN), have been classified as changing-look AGN (CL-AGN). Here we present a peculiar source, 2MASX J0413-0050, first identified as a narrow-line Seyfert 1 (NLS1s) galaxy in 2004. When re-observed twice in 2021, it showed a transition in the spectral type (towards a Seyfert 1.9) and the complete and mysterious disappearance of the Hβ line while the source was in a high-accretion state. In the meantime, the X-ray flux decreased between observations taken in 2020 and 2022, and again in the most recent spectrum of 2023. Shortly after this, another optical spectrum revealed the re-emergence of both the narrow and broad Hβ components (Seyfert 1.8). Despite the fact that it was not possible to retrieve the line-of-sight column density from the X-ray spectra, which would have helped in assessing whether this event could be attributed to a CO-AGN scenario, the observational evidence does not necessarily support such an interpretation. J0413-0050 may have undergone several switch-on and switch-off phases over the past 20 years, on an unknown timescale, which could have affected the accretion power and, consequently, the optical continuum and so the emission lines coming from the broad-line region (BLR). For these reasons, it is reasonable to classify this source as a CS-AGN. The case of J0413-0050 supports the hypothesis that NLS1s can indeed experience CL phenomena.
Key words: galaxies: active / galaxies: individual: 2MASX J04130709-0050165 / galaxies: Seyfert
© The Authors 2026
 Open Access article, published by EDP Sciences, under the terms of the Creative Commons Attribution License (https://creativecommons.org/licenses/by/4.0), which permits unrestricted use, distribution, and reproduction in any medium, provided the original work is properly cited.
This article is published in open access under the Subscribe to Open model. This email address is being protected from spambots. You need JavaScript enabled to view it. to support open access publication.
1. Introduction
Observational evidence has proved that active galactic nuclei (AGN) are powered by accreting supermassive black holes (SMBHs, MBH ≈ 106–1010 M⊙) whose growth is regulated by an active feeding process from their surroundings (e.g. Magorrian et al. 1998). Several diverse classes of AGN are known, whose classification is often based on multi-band spectral features, showing different observable properties mainly due to the orientation with respect to the observer (Antonucci 1993). The physical reason behind the main observational difference relies on the presence of an obscuring dusty medium, probably lying on the plane of the accretion disc, which was originally hypothesised to have a toroidal shape. However, an increasing number of studies favour a more complex clumpy structure for this absorbing medium (Elitzur & Shlosman 2006), for which a wide range of dust temperatures can be found coexisting at similar distances from the source (Nenkova et al. 2008).
In Type 2 AGN, this medium prevents the ionised light coming from the broad-line region (BLR) from reaching the observer and, consequently, hides the presence of the broad lines (≳1000 km s−1) in the optical spectra. Conversely, when the AGN is observed from a small viewing angle (face-on view), the line of sight does not intercept the dusty medium and the AGN, classified as Type 1 (unobscured), exhibits both broad and narrow (≲1000 km s−1) optical emission lines in its spectra. A finer classification also exists (Osterbrock 1977) for sources sharing properties of Type 1 and Type 2, the Intermediate Seyfert (IS) (Dalla Barba et al. 2023), classified according to the increasing faintness of the broad component compared to the narrow component (Type 1.2, 1.5, 1.8, and 1.9, Vaona et al. 2012). This model of classification can also be matched with the X-ray observational properties, identifying Type 1 AGN with unobscured sources showing line-of-sight column density NH ≤ 1022 cm−2, and Type 2 AGN with obscured sources having NH ≥ 1022 cm−2 (e.g. Ricci et al. 2017).
The variability of AGN, spanning all frequencies and timescales, is one of their defining elements. When variability becomes drastic to the point that AGN can switch from one classification type to another on short timescales (less than a few months; e.g. Zeltyn et al. 2024), the observed spectral changes cannot be explained in the context of the unification model. Starting from the first evidence in the 1970s (Pastoriza & Gerola 1970; Tohline & Osterbrock 1976; Barr et al. 1977), an increasing number of sources have been observed showing these kinds of drastic changes in the optical/UV and X-ray spectral properties, requiring the definition of a complete new class: changing-look (CL) AGN.
This new classification is primarily associated with the extreme changes in the X-ray absorption of the AGN, bringing the line-of-sight column density from Compton thin (NH ≤10−24 cm−2) to Compton thick (CT, i.e. NH > 10−24 cm−2, Matt et al. 2003; Ricci et al. 2015) and vice versa, due to a strong variation in the obscuring material covering the X-ray continuum source (e.g. Matt et al. 2003; Ricci et al. 2016). Recently, this change in the X-ray spectrum has been labelled a ‘changing-obscuration’ (CO) AGN phenomenon. These temporal variations in NH are generally observed in the X-rays since the size of the region producing this high energy emission, the corona, is significantly smaller than the BLR. However, the obscuring clumpy material can move, causing variability (Yaqoob et al. 1989), and it can pass through the BLR or even beyond the dust sublimation radius, reaching the torus (Ricci & Trakhtenbrot 2023). As the level of the obscuration increases and the source becomes CT, the X-ray continuum is suppressed by the effect of the Compton scattering, and the features of the reprocessed X-rays (Fe Kα line, Compton hump) become prominent in the spectrum.
Conversely, drastic variability in the optical/UV range can be due to a change in the accretion flow, which in turn causes variability in the continuum and the appearance or disappearance of the broad emission lines (Graham et al. 2020). This is known as a ‘changing-state’ (CS) AGN, and can be as dramatic as a spectral change from Type 1 to Type 2 and vice versa (LaMassa et al. 2015), falling under the name of ‘turn-off’ and ‘turn-on’ events (Arévalo et al. 2024; Sánchez-Sáez et al. 2024), respectively. Several explanations have been proposed involving processes occurring in the accretion disc, such as thermal instabilities (Grupe et al. 2015; Stern et al. 2018; Śniegowska et al. 2022), tidal disruptions of stars into AGN discs (e.g. Merloni et al. 2015), rapid mass-accretion rate (Noda & Done 2018) drops and other disc events. The CS transitions are therefore an important probe of the accretion disc physics, allowing us to study the different regions emitting continuum and generating the emission lines. CS-AGN must be close to the accretion state transition threshold, beyond which the ionising luminosity changes and the emission lines are produced, to account for the variable accretion rate scenario (Li et al. 2022; Zeltyn et al. 2024; Wang et al. 2024). Indeed, spectral-type changes usually occur in AGN which show bolometric luminosities of a few percent of Eddington luminosity, LEdd (Noda & Done 2018).
Although AGN with high bolometric luminosity Lbol and a high Eddington ratio  have always been a priori excluded as a potential host of CL events (Wang et al. 2023), recent studies prove that they can also be good candidates (Miniutti et al. 2013; Elitzur et al. 2014; Wang et al. 2023; Xu et al. 2024). From this point of view, narrow-line Seyfert 1 galaxies (NLS1s, Osterbrock & Pogge 1985) seem to be good candidates for hosting this CL phenomenon under those mechanisms that operate close to the Eddington limit (Xu et al. 2024). The NLS1s are identified, by definition, with a full width at half maximum (FWHM) of Hβ less than 2000 km s−1 (Goodrich 1989) and an [O III] λ5007/Hβ ratio of less than three (Osterbrock & Pogge 1985). Many NLS1s also exhibit prominent Fe II multiplet emissions, often relatively stronger than the total Hβ emission (Osterbrock & Pogge 1985; Rakshit et al. 2017). Their black hole mass is believed to be lower (< 108 M⊙) than a typical broad-line Seyfert 1 (BLS1, Peterson 2011). Since their bolometric luminosity is similar to that of BLS1s, they are probably characterised by an extremely high accretion rate (Marziani et al. 2014), often near or even exceeding the Eddington limit (Eddington ratio 0.1 ≤ ε ≤ 10; Boroson & Green 1992; Komossa et al. 2006; Jin et al. 2017b; Tortosa et al. 2022). This is likely due to accretion occurring in ‘puffed-up’ slim discs, which are the ones able to sustain this extreme regime (Wang & Netzer 2003), but also to block a significant part of the ionising continuum from reaching the narrow-line region (NLR), bringing to the observed weak [O III] emission (e.g. Luo et al. 2015; Jin et al. 2017a, and references therein).
The disc instabilities produced in super-Eddington sources such as NLS1s are recognised as one of the physical mechanisms behind the CL-AGN. In the X-ray band, NLS1s are known for their complex spectral features, including a steep X-ray slope (Γ ≈ 2.0−2.2, e.g. Boller 2000) and an excess in the ultra-soft X-ray region (below 1 keV, e.g. Komossa & Meerschweinchen 2000), above the prediction of a single power law. The spectral shape and X-ray brightness are indeed further indicators of their high accretion rates. Their rapid and significant variability in the X-rays is another point in favour of NLS1s to be prone to CL events, since the great majority of these objects have been discovered due to peculiar behaviour in the X-ray (Gallo 2018).
In this paper, we present an optical and X-ray study of a particular source, 2MASX J04130709-0050165, first classified as NLS1 in 2004, which has undergone X-ray flux variability and optical spectral type changes over a period of almost twenty years. In Sect. 2, we describe the multiple observations we collected for this object; in Sect. 3 and Sect. 4 we present the analysis of the optical and X-ray spectral fitting. In Sect. 5 we discuss the results and give our conclusions in Sect. 6. Additional technical details are given in the Appendix. For this analysis, we adopted a standard Lambda cold dark matter (ΛCDM) cosmology with a Hubble constant H0 = 67.8 km s−1 Mpc−1, considering a flat Universe with the matter density parameter ΩM = 0.308 and the vacuum density parameter Ωvac = 0.692 (Planck Collaboration XIII 2016).
2. 2MASX J04130709-0050165: Multiple observations
2MASX J04130709-0050165 (hereafter J0413-0050, RA 04h13m07.05s, Dec −00d50m16.63s, z = 0.04) is an AGN that has been observed several times in the optical and X-ray range in the last two decades. The observations are summarised in Table 1. The first observation was performed in 2004 within the Six-degree Field Galaxy Survey (6dF) (Colless & Parker 2000) (hereafter 2004-04). It is worth noting that since the 6dF does not provide flux calibration, this spectrum was flux-calibrated by Chen et al. (2018), who created a calibration curve for the survey and analysed its optical properties. It must be said that the calibration function used by Chen et al. (2018), built as an average function for a sample of 167 NLS1s, may not be properly suitable for the spectrum of J0413-0050. However, Chen et al. (2018) classified this source as a NLS1 galaxy, measuring an FWHM(Hβ) = 2133 ± 634 km s−1.
Optical observations of J0413-0050.
Meanwhile, the field of view (FoV) of this object was observed with the extended ROentgen Survey with an Imaging Telescope Array (eROSITA hereafter; Predehl et al. 2021) in 2020 (ID: 065090-220/920). Almost one year later, an optical spectrum of this object was taken with the European Southern Observatory (ESO) Faint Object Spectrograph and Camera v.2 (EFOSC2) mounted on the New Technology Telescope (NTT; proposal ID: NTT/106.21HS, PI M. Berton) in January 2021 (hereafter 2021-01). Noticing the drastic change between the 2004-04 and 2021-01 spectra, another spectrum was taken with the Nordic Optical Telescope (NOT) at the end of 2021 (hereafter 2021-12).
One year later (November 2022), we requested a Target of Opportunity (ToO) observation (ObsID 00015418001) with the Neil Gehrels Swift Observatory (Swift/XRT hereafter; Gehrels et al. 2004). Considering the strong short-term X-ray variability for NLS1s (Grupe 2004), we decided to ask for another Swift/XRT ToO in September 2023 (ObsID 00015418004). To explore a possible relation between the X-ray flux variations and the variability seen in the optical range we asked for Director’s Discretionary Time at ESO Unit Telescope 1 (UT1), right after this last Swift/XRTspectrum, requesting a FOcal Reducer/low dispersion Spectrograph 2 (FORS2) spectrum (hereafter 2023-09) covering the main emission lines for precise modelling of the line profile, searching for broad components to appear. In conclusion, we collected four epochs of optical spectroscopy and three epochs of X-ray spectroscopy.
3. Optical analysis: Spectral fitting
3.1. Data preparation and fitting procedure
Before applying line decomposition, all spectra were corrected for Galactic extinction with IRAF (version NOIRLab IRAF V2.18; Tody 2000), adopting A(V) = 0.38 and assuming a reddening law with Rv = 3.1 (Cardelli et al. 1989). The spectra were then shifted to the rest frame using z = 0.040178 (NED). The 2004-04 and 2021-12 spectra were already calibrated at this stage, whereas the 2021-01 and 2023-09 spectra were reduced using the ESO EFOSC and FORS2 pipelines through ESO Reflex (Izzo et al. 2010; Freudling et al. 2013).
To analyse and quantify the spectral variability of J0413−0050, we fitted its four optical spectra with the Fully Automated pythoN tool for AGN Spectra analYsis (fantasy; Ilić et al. 2020; Rakić 2022; Ilić et al. 2023), a Python code for multi-component spectral fitting optimised for Type 1 AGN, which simultaneously fits the underlying continuum and sets of emission lines on a wavelength range of 3700–11 000 Å. To properly isolate the AGN contribution and, in particular, the NLR and BLR components of the emission lines, we removed host galaxy contamination. The host galaxy subtraction was performed using a linear combination of quasar and galaxy eigenspectra (for details see Ilić et al. 2023), yielding a pure AGN spectrum in each case.
At this point, we applied the fantasy multi-component spectral fitting, from which we extracted their broad and narrow components to constrain the CL phenomenon. Within the 4000–7000 Å spectral range, we fit the model with a broken power-law continuum, broad lines (hydrogen Balmer lines as Hα, Hβ, Hγ, and HeI, HeII) fixed to have the same width and shift; narrow lines (Hα, Hβ, Hγ, [O III] λ4959,5007, [N II] λ6548,6583, SII λ6716,6731) tied to the [O III] λ5007 width and shift (the ratios of [O III] and [N II] doublets in particular were fixed to three Osterbrock & Ferland 2006; Dimitrijević et al. 2007; Dojčinović et al. 2023), and an Fe II model in which all lines have the same width and shift (see Ilić et al. 2023, for details). The optical Fe II model, built on atomic data of the transitions (Ilić et al. 2023), also includes the Hα line region (which is highly populated in NLS1s; see e.g. Park et al. 2022), which was not covered by the previous Fe II models developed in Kovačević et al. (2010), Shapovalova et al. (2012). In the next subsection, we examine all the fitted spectra, describing the model and the parameters we applied.
3.2. 2004-04 spectrum
We initially smoothed the spectrum (each pixel was replaced with an average of five pixels) to reduce the noise and to facilitate comparison with the other spectra. Details on host galaxy subtraction will be described in the Appendix A.1. Once we isolated the AGN spectrum, we fitted it with a multi-component spectral model, as described in the previous subsection. The results of the fitting are plotted in Fig. 1.
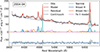 |
Fig. 1. Multi-component fitting with fantasy of J0413-0050 2004-04 spectrum (grey line) in the 4000–6850 Å range. The model (red line) is composed of an underlying continuum (dotted dark blue line), broad components of Balmer lines (light blue line), narrow emission lines (water green line), Fe II multiplets (fuchsia line) and broad components of He I (orange line). The residuals, subtraction of the model to the AGN spectrum, are shown in grey at the bottom of the panel. |
The main Balmer lines, Hα and Hβ, both show narrow and broad components, indicating an unobscured view of the central engine. The FWHM of the broad components resulted to be 3675 km s−1 while the FWHM of the narrow components was 741 km s−1 (Table 2). The integrated fluxes for the single components are reported in Table 2. Despite the fact that the Hα-[N II] complex was not completely resolved, due to poor spectral resolution, fantasy could decompose the Hα contribution from the [N II] doublet.
Fitting parameters of the hydrogen Balmer lines.
The flux measurements related to the [O III] λ4959,5007 lines in all four spectra are reported in Table 3. Comments on these results follow in the Discussion section. In 2004, J0413-0050 also showed strong Fe II multiplets, which are typical features of NLS1s. The total Fe II emission can be identified in three different wavelength bands (Fe II blue 4340–4680 Å, Fe II green 5100–5600 Å, Fe II red 6100–6650 Å) as suggested by Ilić et al. (2023) and, in our case, all three are identified. The Fe II multiplets can also be blended with the main emission lines, as in the case of [O III] λ5007, for which the Fe II components are responsible for a faint red wing. The Fe II red is also visible in this spectrum, but it does not affect the Hα-[N II] complex.
[O III] measurements.
From the BLR radius and the second-order moment (line dispersion), following the method in Berton et al. (2015), Chen et al. (2018) calculated a BH mass of (2.87 ± 0.79) × 106 M⊙ for this source. We also measured the BLR radius from the relation found in Greene et al. (2010)
 (1)
(1)
where L(Hβ) is the integrated luminosity of the broad Hβ component, and the BLR radius is expressed in light days. We obtained a value of about six light days for RBLR. Taking as valid the mass measurements from Chen et al. (2018), we calculated the Eddington ratio as
 (2)
(2)
where Lbol is the bolometric luminosity and LEdd is the Eddington luminosity (Beckmann & Shrader 2012). The Eddington luminosity is LEdd = 3.73 × 1044 erg s−1.
Bolometric luminosity can be estimated from the continuum luminosity at 5100 Å, although bolometric corrections may depend on luminosity and accretion rate (e.g. Runnoe et al. 2012; Duras et al. 2020), typically with relatively small uncertainties. Since bolometric calibrations have not yet been specifically tested on systems undergoing strong accretion-state variations, we adopt the prescription of Netzer (2019). This relation is calibrated on a large sample that spans a wide luminosity range, including high-Eddington sources (up to λEdd ≈ 0.5 for thin accretion discs) and has been employed in recent studies of variability and CL AGN (e.g. Lyu et al. 2025; Kollatschny et al. 2026). The Netzer (2019) formula represents a revised version of the classical relation (Lbol = 9λLλ5100; Kaspi et al. 2000), in which the bolometric correction factor kbol explicitly depends on the inclination
![Mathematical equation: $$ \begin{aligned} L_{\rm {bol}} = k_{\rm bol} \lambda L_{\lambda }(5100\,\AA ); \quad k_{\rm bol} = 40 \times \left[\frac{\lambda L_{\lambda }(5100\,\AA )}{10^{42}\,\mathrm{erg/s}}\right]^{-0.2} \times \left[\frac{1}{f_i}\right]. \end{aligned} $$](/articles/aa/full_html/2026/06/aa59474-26/aa59474-26-eq4.gif) (3)
(3)
For typical Type 1 AGN, which generally have inclinations (i) around 56°, the corresponding correction factor (fi) is approximately 1.4, while for nearly face-on accretion discs it increases to about 2.5 (Netzer 2019). Since the inclination of our source cannot be constrained, we adopt an average fi = 2, following the approach of Crepaldi et al. (2025), Dalla Barba et al. (2026). This relation can be affected by the host galaxy component (Crepaldi et al. 2025). For this reason, we measured the flux of the continuum at λ = 5100 Å on the spectrum for which the host contribution had already been subtracted, and then we retrieved the relative luminosity. These values are reported in Table 4.
Luminosity measurements and Eddington ratio λEdd.
3.3. 2021-01 spectrum
The host galaxy modelling and subtraction is described and shown in Appendix A.2. Also in this case, we obtained a rising continuum towards the blue wavelength for the pure AGN spectrum, with a steep slope. We then built up the model as we did for the 2004-04 spectrum, and the result of the fitting is plotted in Fig. 2.
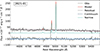 |
Fig. 2. Multi-component fitting with fantasy of J0413-0050 2021-01 spectrum (grey line) in the 4300–5700 Å range. The model (red line) is composed of an underlying continuum (dotted dark blue line) and narrow emission lines (water green line). The residuals, subtraction of the model to the AGN spectrum, are shown in grey at the bottom of the panel. |
Although Hβ was identified in the fit, both its broad and narrow component show an amplitude lower than 14.55, the value of the root-mean-square (rms) or σ measured in an interval of 100 pix around 5100 Å. The same issue is seen for the Fe II multiplets amplitude, which remains below 2σ. For this reason, it is a reliable hypothesis that those are not real lines, rather fantasy fits the noise. Instead, Hα is not present in this spectral range. We can confirm that emission lines from the BLR are not present in these spectra.
Regarding the oxygen lines, their fluxes are consistent with measurements made on the 2004-04 spectrum (Tables 3, 2). The computed values for the several luminosities and Eddington ratio are listed in Table 4.
3.4. 2021-12 spectrum
The host galaxy model we retrieved from this spectrum is described and shown in Appendix A.3. The continuum slope of the pure AGN spectrum we obtained is rising towards the blue wavelengths. As for the previous observations, we fitted the 2021-12 spectrum with a multi-component spectral model. Although we initially included the He lines and the Fe II multiplets, their amplitude turned out to be negligible, and we therefore excluded them from the model.
The results of the fit are shown in Fig. 3. Within the spectral range of 4500–6850 Å only the [O III] λ4959,5007 lines and the resolved Hα-[N II] complex (zoom-in in Fig. 4) were detected. In a second attempt, we also fitted the Hα-[N II] complex including the broad component of Hα (zoom-in in Fig. 5), with its amplitude measuring exactly 3σ (the rms in this spectrum is 4.592). The FWHM of both components are reported in Table 2. The two different models, with and without broad components, yield a similar value for χ2, 35, and 34.3, respectively. Conversely, the peaks of the narrow and broad line fitted in the spectra at the Hβ line position lie at the same level as the rms, indicating that this component is not significantly detected and can be attributed to noise (zoom-in in Fig. 6). We can confirm that throughout the entire year 2021, the Hβ emission line completely disappeared from the spectra of J0413-0050, while the Hα broad component may still be present in this spectrum. This would correspond to an IS 1.9 classification (the broad component is only visible in Hα) although the Hβ narrow component is absent.
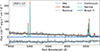 |
Fig. 3. Multi-component fitting with fantasy of J0413-0050 2021-12 spectrum (grey line) in the 4500–6850 Å range. The model (red line) is composed of an underlying continuum (dotted dark blue line) and narrow emission lines (water green line) and broad emission lines (light blue line). No relevant broad components for Hβ and He or FeII multiplets are present in this fit. The residuals, subtraction of the model to the AGN spectrum, are shown in grey at the bottom of the panel. |
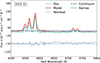 |
Fig. 4. Zoom-in of the Hα-[N II] complex for the 2021-12 spectrum, which is totally resolved. A first attempt at fitting only narrow components of [N II] and Hα. |
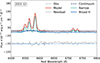 |
Fig. 5. Zoom-in of the Hα-[N II] complex of the 2021-12 spectrum, also including the broad component for Hα, with amplitude results slightly higher than 3σ. |
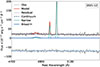 |
Fig. 6. Zoom-in of the Hβ–[OIII] region of the 2021-12 spectrum, showing the attempted fit of an Hβ component despite the absence of a real emission line at that position. |
The oxygen lines are comparable to the ones shown in the 2021-01 spectrum, although they are slightly fainter (Table 3). Finally, we computed the luminosities (Table 4), obtaining lower values than those measured in the earlier spectra.
3.5. 2023-09 spectrum
Once the AGN spectrum was isolated (see Appendix A.4), we fitted it with a multi-component spectral model, the same as for the 2004-04 spectrum. The results of the multi-component fitting are shown in Fig. 7.
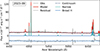 |
Fig. 7. Multi-component fitting with fantasy of J0413-0050 2023-09 spectrum (grey line) in the 4450–6740 Å range. The model (red line) is composed of an underlying continuum (dotted dark blue line), broad components of Balmer lines (light blue line) and narrow emission lines (water green line). The residuals, subtraction of the model to the AGN spectrum, are shown in grey at the bottom of the panel. |
In the spectral range 4450–6740 Å, fantasy identified both broad and narrow components for the Balmer lines (Hα, Hβ, and Hγ), Fe II multiplets in the blue and green wavelength range, faint He emission and forbidden narrow lines. In this spectrum of September 2023, emission lines coming from the BLR (broad components of the Balmer lines, FeII multiplets) reappeared in the spectrum, indicating a clear view of the central region of the AGN. The Hα-[N II] complex is completely resolved, showing both narrow and broad components (Fig. 9) such as Hβ (Fig. 8). The FWHM of the broad and narrow components and their integrated fluxes are reported in Table 2. Those values seem to point again towards an IS classification, which can also be determined through the ratio between the [O III] λ5007 and the Hβ broad component flux (R; Whittle 1992). In this spectrum, the object showed an R ≈ 4.8, which brings to IS 1.8 classification.
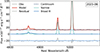 |
Fig. 8. Zoom-in of the Hβ-[O III] λ4959,5007 region of the 2023-09 spectrum. Hβ is decomposed in a broad and a narrow component, fixed to the [O III] λ5007 line. We cut the plot in flux to zoom into the Hβ component, keeping out the majority of the emission of the [O III] λ4959,5007 lines. |
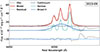 |
Fig. 9. Zoom-in of the Hα-[N II] complex of the 2023-09 spectrum, which is completely resolved. The Hα clearly show both broad and narrow components. |
The oxygen fluxes peak at half the value reported in the 2021-01 and 2021-12 spectra (Table 3) while the continuum level is the same as for the 2021-12 and 2021-01 spectra (Fig. 11). Since these three spectra have been taken with the same slit aperture and seeing conditions, this oxygen flux decrease could be due to the different position angle (PA) of the slit for the three observations (see figure in Appendix B). Also, for this spectrum, we computed the values for the luminosities (Table 4).
4. X-ray analysis
J0413-0050 was also observed in the X-rays in 2020 by the eROSITA, in 2022 and 2023 with Swift/XRT. The Swift/XRT data were reduced following standard procedures using the latest calibration files. Details of the observations are reported in Table 5. Swift/XRT spectra were extracted using the XSELECT line interface (v2.4k) within the HEASOFT package (version 6.28). The background extractions are measured in an annular region with a radius from 30″ to 60″. If there is pile-up, the measured rate of the source is high (above ∼0.6 counts s−1 in the photon-counting mode). The Swift/XRT spectra of the sources of our sample did not have a high pile-up degree; the source’s extraction regions are measured using a circular region with a radius of 20″.
Details of the X-ray observations analysed in this work together with X-ray flux, luminosity, Γ measurements, and Eddington ratio.
The eROSITA data were retrieved from the public archive1 as processed spectral products (including source and background spectra and response files), and thus no additional data reduction was required prior to spectral analysis. The spectral analysis has been performed with the XSPEC v.12.11.1b software package (Arnaud 1996). We performed the modelling by using the Cash statistics with direct background subtraction (W-stat in xspec, Cash 1979; Wachter et al. 1979). Due to the low net counts, a simple model composed by a primary power-law absorbed by the Galactic column density at the position of the source (NH = 1.25 × 1021 cm−2, HI4PI Collaboration 2016), was employed (XSPEC model: Tbabs * (powerlaw)).
The 2–10 keV fluxes of J0413-0050 are reported in Table 5, which also shows the Γ values and the count rate. X-ray flux between the two Swift/XRT observations drops by a factor ∼3 (i.e. ∼0.5-dex; see Fig. 10). Due to the low net count rate of the observations, constraining the intrinsic column density NH, required to determine the level of obscuration and any relative changes, was not possible. Despite this variability, the photon index remains consistent within uncertainties, indicating no significant spectral evolution. This suggests that the observed variability is primarily driven by changes in the normalisation of the primary continuum rather than by strong modifications of the coronal properties or variations in the line-of-sight absorption. No clear evidence for a ‘softer-when-brighter’ trend is observed.
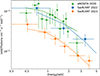 |
Fig. 10. X-ray spectra of J0413-0050 from the eROSITA observation from 2020 (green triangles), Swift-XRT observation from 2022-11 (blue squares), and 2023-09 (orange circles). X-ray spectra are fitted with a simple power law absorbed by Galactic absorption. Spectra are visually re-binned for clarity. Spectra above 5 keV are dominated by noise. |
We also estimated the Eddington ratio by deriving the bolometric luminosity from the 2–10 keV luminosity, following the relation presented in Gupta et al. (2024)
 (4)
(4)
This calibration accounts for the known dependence of X-ray bolometric corrections on luminosity and Eddington ratio, as discussed in Gupta et al. (2024), and is based on a large and homogeneous sample of unobscured AGN with simultaneous optical-to-X-ray observations. The resulting Eddington ratios (Table 5) are consistent with the estimates derived from the optical spectra.
5. Discussion
5.1. First phase: 2004–2022
During the last 20 years, J0413-0050 has changed its optical classification, switching from an NLS1s (2004-04) to an IS 1.8 (2023-09), passing through a high-Eddington phase without showing any broad component for the Balmer lines (2021-01) and through an IS 1.9-like phase (2021-12), both lacking any evidence of the Hβ line. Figure 11 shows all the host-subtracted spectra of J0413-0050, highlighting the different spectral features at different epochs, such as continuum levels and shape, presence or absence of the Balmer lines, and the width and amplitude of the emission lines. The appearance and disappearance of the broad lines in the optical spectra, leading to changes in the spectral type, suggest that this source is a CS-AGN. The X-ray flux remained almost constant within the observations taken in 2020, 2022, and 2023, showing a stronger but mild decrease between the last two spectra. Since it was not possible to retrieve the NH values, we cannot determine whether the source experienced an additional CO-AGN phase between 2014 and 2022.
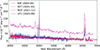 |
Fig. 11. All the host subtracted spectra of J0413-0050. The Hβ line is only visible in 2004-04 and 2023-09 spectra, while the spike at the same position in the 2021-01 one is probably due to the noise. The change in the Hα and the continuum shapes is also visible. |
The 2004-04 optical spectrum (Fig. 1) showed both broad and narrow components of the main Balmer lines and a continuum rising towards the blue, typical of Type 1 AGN. At that time, the source was classified as an NLS1. However, as already noted, the flux calibration may have misestimated the continuum level. At the beginning of 2021, the spectrum showed the complete disappearance of the Hβ line, while nothing could be said about the Hα line, which was not included in the wavelength range (Fig. 2).
This first change between two optical spectral types can be interpreted as a transition phase occurring at some point between 2004 and 2021, possibly due to the ‘switching-off’ of the central engine, followed by a ‘switching-on’ phase which could have begun shortly before the 2021-01 spectrum, potentially explaining the absence of the Balmer line despite the rising continuum. At the same time, no specific trend is observed in the X-ray band for the flux and the photon index between the eROSITA (2020) and Swift/XRT (2022-11) observations.
The non-simultaneity of the optical and X-ray observations between 2004 and 2022 prevents us from properly tracing the relevant timescales or determining how many phase changes the source has undergone. There should have been a drop in the accretion luminosity between 2004 and 2021, explaining what we see in the optical spectra, but, at the same time, it should have been followed by an equal increase of the luminosity to justify the constant level of the X-ray flux.
For this reason, we refrain from linking the changes we see in the optical regime to those seen in the X-rays. Several transitions between high- and low-flux states may have occurred during this period, but they cannot be constrained given the sparse sampling and the intrinsic short-term variability of the X-ray emission.
5.2. What happened in 2021?
The 2021-01 spectrum shows a continuum rising towards the blue wavelengths, as in the 2004-04 spectrum, but with an even steeper spectral slope (spectral index of the broken power law fitting the continuum: index2004 − 04 = −1.8 while index2021 − 01 = −2). This behaviour contrasts with the presence of both broad and narrow Balmer components in the 2004-04 spectrum and the non-detection of the entire Hβ line in the 2021-01 spectrum.
Several explanations can be proposed to account for the variations observed in these two spectra. The difference in the continuum level between the 2004 and 2021 observations could be related either to changes in the accretion state or to uncertainties on the 2004-04 flux calibration. Assuming the 2004-04 is correctly flux calibrated, the AGN may have experienced several ‘switch-on-and-of’ phases, and the 2021-01 observation may have been taken during the rise of the continuum, just before it reached the BLR and ionised it (considering the lower limit on the BLR size measured from the 2004-04 spectrum, ≈6 light-days). This serendipitous timing could explain the total absence of the Hβ line, as neither the BLR nor the NLR would have yet been reached by the newly emerging ionising continuum. However, due to very mild variability in the X-ray flux, this hypothesis should be treated with caution.
It is also worth noting that the Eddington ratio is consistently high in both the 2004-04 (λEdd = 0.46) and 2021-01 (λEdd = 0.19) spectra, but also in the eROSITA 2020 observation (λEdd = 0.11). An unexpected aspect is that objects with high λEdd are usually characterised by strong Fe II multiplets (Marziani et al. 2018), which are present in the 2004-04 spectrum but absent in the 2021-01 one. We can state that this non-detection is not related to the S/N (Table 1), which is comparable to the other spectra, nor to observational effects. Recent studies support the idea that the production of Fe II lines is governed by photoionisation from the central source (Gaskell et al. 2022; Ilić et al. 2023), a hypothesis motivated by variability analyses (Shapovalova et al. 2012; Barth et al. 2013). For this reason, the physical interpretation for the absence of the iron emission lines could be the same as that suggested for the non-detection of the Hβ broad components: the fortuitous coincidence of having observed the source just before the BLR became fully ionised. As outlined earlier, this scenario must be carefully taken.
According to the disc-wind scenario (Elitzur et al. 2014), an outflow of clouds embedded in a wind originating from the disc is responsible for the formation of the torus and the BLR. In this framework, the BLR is expected to vanish when the AGN luminosity drops below a critical threshold. For this spectrum, the bolometric luminosity exceeds the critical value required for the formation of the broad emission lines (the Elitzur & Ho 2009 boundary, log L = 28.8 − 2 log(λEdd)), although the broad lines are absent. However, Jana et al. (2025) recently showed that the disc-wind model alone is not sufficient to explain all CL transitions, and that CL-AGN can exhibit bolometric luminosities well above the critical threshold predicted by the disc-wind model while still lacking broad emission lines.
Despite the uncertainties and uncommon spectral features, the differences between the 2004-04 and 2021-01 spectra seem to favour a CS scenario (switch-on-and-off phases), driven by changes in the accretion flow, given that the CL transitions do not appear to be related to the presence of an obscuring medium (Jana et al. 2025).
Regarding the second observation of 2021 (Fig. 3), the continuum level and its slope (index1, NOT = −2, Fig. 11), as well as the accretion rate (Table 4), do not show any significant differences with respect to the first observation. As in 2021-01, neither the broad nor the narrow Hβ components are detected, while both Hα components are present. We cannot determine whether these components were also present in the 2021-01 spectrum due to its shorter wavelength coverage. One possible interpretation is that we observed the AGN during the very early stages of its turn-on phase in 2021-01, which may have led to the ionisation of the BLR seen in 2021-12 through the reappearance of the broad Hα component.
The complete absence of Hβ in the 2021 spectra remains puzzling. The disappearance of the broad Hβ component is consistent with a CL scenario, but the lack of the narrow component is more difficult to explain. One possibility is that the emitting-line regions are shielded by a puffed-up disc (often present in NLS1s), similar to what is observed in weak-line quasars with high Eddington ratios (Luo et al. 2015; Jin et al. 2017a,b). However, if this mechanism affects all optical/UV NLR lines, it should suppress both the Balmer and the oxygen lines, whereas the latter are clearly visible in the 2021 spectra. We therefore leave open the additional possibility of an obscuring medium absorbing precisely at that wavelength, although no studies have explored this specific scenario. A combination of this phenomenon with the dramatic and rapid transformations that occur in the innermost regions of accreting SMBHs (a CS event, Ricci et al. 2020) may account for the main spectral variations observed across the epochs.
5.3. Second phase: 2023
Lastly, the observed X-ray variability between the two Swift/XRT observations (2022-11 and 2023-09), characterised by a decrease in flux by a factor of ∼3, motivated the subsequent 2023-09 observation, taken shortly after the latest X-ray epoch. The 2023-09 spectra may provide further insight into a new phase of this AGN. The latest optical spectrum shows the reappearance the Hβ line, with both its components. Although J0413-0050 appears to be transitioning toward a IS 1.8 classification, the 5100 Å luminosity, the bolometric luminosity, and the Hα integrated flux in the 2023-09 spectrum are still lower than the ones seen in the previous epochs.
The decrease in the flux of the oxygen emission lines in the last optical spectrum can be explained by differences in the slit PA (PA2021 − 01 = ≈−80°, PA2021 − 12 = ≈ 45°, PA2023 − 09 = ≈ 0°, Fig. B.1), since the slit apertures were the same and the seeing conditions were similar for all three spectra. In the case of the 2023-09 observation, the slit orientation may have missed additional star-forming regions or the area where the ionised NLR cones or extended-NLR lie. For this reason, we decided not to normalise the spectra to the [O III] λ4959,5007 fluxes, which is usually done in AGN variability studies to minimise the observational and instrumental effects when comparing spectra from different epochs (e.g. Shapovalova et al. 2019, and references therein). On the other hand, the level of the [O III] λ5007 should remain constant and is expected to vary only over long timescales (Peterson et al. 2013), since NLR emission lines are insensitive to rapid continuum flaring because of the large distance, large spatial extent, and low gas densities. However, recent studies reported variations in the narrow Balmer components on shorter timescales (Li et al. 2022).
As discussed previously, the FWHM of the Hβ broad component (1900 km s−1), the continuum luminosity (Table 4), and the prominence of the Hβ narrow component compared to the broad one resemble an IS 1.8 classification. The reappearance of the BLR components was not followed by an increase in the accretion rate, possibly suggesting that an obscuration scenario could be responsible for this phase. Variable optical spectra of several IS 1.8 and IS 1.9 galaxies have shown changes in the accretion disc and BLR components (Goodrich 1995, and references therein). Variations in the profile of the broad emission lines have been interpreted as partial obscuration of the BLR by outflowing dusty gas clumps (e.g. Gaskell & Harrington 2018; Zeltyn et al. 2022), although this explanation has been considered unlikely in most cases (Ricci & Trakhtenbrot 2023). Due to the mild changes observed in the X-rays, and as already discussed, this cannot be confirmed without NH measurements.
Finally, the exceptionality of this source lies in its CL transition occurring at high Eddington ratios, compared to the typical CL behaviour outlined in Sect. 1. However, recent results suggest that the threshold for such events can reach as low as 1% of the Eddington ratio (Jana et al. 2025, and references therein).
6. Summary and conclusions
Non-simultaneous optical and X-ray observations of 2MASX J04130709-0050165 were obtained at several epochs between 2004 and 2023. The first optical spectrum, collected in 2004 within the 6dF survey, led to its classification as an NLS1 galaxy (Chen et al. 2018), showing both broad and narrow Balmer components and a high Eddington ratio. In January 2021, the NTT spectrum displayed only forbidden oxygen lines, whereas in December 2021 the NOT observations revealed both components of Hα. The Hβ line was completely absent in the 2021 spectra, despite the source accreting at a high Eddington rate. The most recent optical spectrum, obtained with UT1 in 2023, indicated an IS 1.8 classification due to the reappearance of both Balmer components.
The available X-ray spectra, obtained in 2020, 2022, and 2023, do not show evidence of a long-term increase in flux; instead, the X-ray emission appears broadly consistent within a factor of a few, with a decrease by a factor of ∼3 between the 2022 and 2023 observations. The photon index Γ remains consistent within uncertainties across all epochs, indicating that there is no significant spectral evolution. Due to limited count statistics, it is not possible to constrain the intrinsic column density, NH, and therefore we cannot establish whether the source experienced a CT phase. The optical spectral changes observed across the different epochs seem to favour a CS scenario, in which the source underwent multiple switch-on and switch-off phases. Although this remains the most plausible interpretation, it does not fully account for the complete disappearance of the Hβ line in 2021. Several scenarios may be invoked, particularly to explain the challenging state observed in 2021-01, but a definitive picture will require simultaneous, multi-epoch observations.
To this aim and to obtain a precise determination of the variability timescale of the X-ray flux, as well as to establish a more accurate connection between the flux changes observed in the X-ray and optical ranges, we requested and were granted a 1-year XMM-VLT monitoring programme (P.I. Vietri, A., nr. 94131), consisting of three joint observations between 2024 and 2025. In the X-rays, thanks to the high sensitivity of the EPIC cameras, XMM-Newton provided high-quality spectra of the target, in stark contrast to the low net counts we had for the previous X-ray observations. The analysis of the optical and X-rays simultaneous observations will be presented in a forthcoming paper.
In conclusion, this comprehensive analysis enables us to explore in detail the behaviour of a source accreting at a very high rate, as is typical for NLS1s. The Eddington regime appears to be one of the main drivers of the peculiar variability observed in J0413-0050 over the past two decades. This cadence-based study allows us to probe the different phases of one of the defining properties of NLS1s. Understanding the physical mechanisms at work during the earliest stages of AGN activity, when the accretion rate can reach its maximum, is a challenging but promising avenue that can be addressed through this approach.
Acknowledgments
A.V. and M.B. acknowledge the support from the ESO Early-Career Scientific Visitor Programme. I.V. wants to thank the Swedish Cultural Foundation in Finland for their support. D.I. acknowledges funding provided by the University of Belgrade–Faculty of Mathematics (contract 451-03-66/2024-03/200104) through grants of the Ministry of Education, Science, and Technological Development of the Republic of Serbia. Based on observations collected at the European Southern Observatory under ESO programmes 0104.B-0587(A), 106.21HS and 113.26X0. CR acknowledges support from SNSF Consolidator grant F01−13252, Fondecyt Regular grant 1230345, ANID BASAL project FB210003 and the China-Chile joint research fund. This research has made use of the NASA/IPAC Extragalactic Database (NED), which is operated by the Jet Propulsion Laboratory, California Institute of Technology, under contract with the National Aeronautics and Space Administration. This research has made use of the SIMBAD database, operated at CDS, Strasbourg, France. Based on observations made with the Nordic Optical Telescope, owned in collaboration by the University of Turku and Aarhus University, and operated jointly by Aarhus University, the University of Turku and the University of Oslo, representing Denmark, Finland and Norway, the University of Iceland and Stockholm University at the Observatorio del Roque de los Muchachos, La Palma, Spain, of the Instituto de Astrofisica de Canarias. The 2021-12 data were obtained under program ID P64-407. This research has made use of data obtained from the Chandra Data Archive provided by the Chandra X-ray Center (CXC). We thank Dr. Luigi Foschini and Prof. Benjamin Trakhtenbrot for the valuable suggestions. We thank Kostas Valeckas for the support with NOT technical information. We thank Dr. Alessandro Bianchetti for valuable feedback and assistance in improving the clarity and presentation of the manuscript.
References
- Antonucci, R. 1993, ARA&A, 31, 473 [Google Scholar]
- Arévalo, P., López-Navas, E., Martínez-Aldama, M. L., et al. 2024, A&A, 683, L8 [NASA ADS] [CrossRef] [EDP Sciences] [Google Scholar]
- Arnaud, K. A. 1996, ASP Conf. Ser., 101, 17 [Google Scholar]
- Barr, P., White, N. E., Sanford, P. W., & Ives, J. C. 1977, MNRAS, 181, 43P [Google Scholar]
- Barth, A. J., Pancoast, A., Bennert, V. N., et al. 2013, ApJ, 769, 128 [NASA ADS] [CrossRef] [Google Scholar]
- Beckmann, V., & Shrader, C. R. 2012, Active Galactic Nuclei [Google Scholar]
- Berton, M., Foschini, L., Ciroi, S., et al. 2015, A&A, 578, A28 [NASA ADS] [CrossRef] [EDP Sciences] [Google Scholar]
- Boller, T. 2000, in New Vistas in Astrophysics, eds. M. M. Shapiro, R. Silberberg, T. S. Stanev, & J. P. Wefel, 143 [Google Scholar]
- Boroson, T. A., & Green, R. F. 1992, ApJS, 80, 109 [Google Scholar]
- Cardelli, J. A., Clayton, G. C., & Mathis, J. S. 1989, ApJ, 345, 245 [Google Scholar]
- Cash, W. 1979, ApJ, 228, 939 [Google Scholar]
- Chen, S., Berton, M., La Mura, G., et al. 2018, A&A, 615, A167 [NASA ADS] [CrossRef] [EDP Sciences] [Google Scholar]
- Colless, M., & Parker, Q. 2000, arXiv e-prints [arXiv:astro-ph/0306104] [Google Scholar]
- Costantin, L., Pérez-González, P. G., Méndez-Abreu, J., et al. 2022, ApJ, 929, 121 [NASA ADS] [CrossRef] [Google Scholar]
- Crepaldi, L., Berton, M., Dalla Barba, B., et al. 2025, A&A, 696, A74 [NASA ADS] [CrossRef] [EDP Sciences] [Google Scholar]
- Dalla Barba, B., Berton, M., Foschini, L., et al. 2023, Physics, 5, 1061 [Google Scholar]
- Dalla Barba, B., Foschini, L., Berton, M., et al. 2026, A&A, 705, A122 [NASA ADS] [CrossRef] [EDP Sciences] [Google Scholar]
- Dimitrijević, M. S., Popović, L. Č., Kovačević, J., Dačić, M., & Ilić, D. 2007, MNRAS, 374, 1181 [CrossRef] [Google Scholar]
- Dojčinović, I., Kovačević-Dojčinović, J., & Popović, L. Č. 2023, Adv. Space Res., 71, 1219 [CrossRef] [Google Scholar]
- Duras, F., Bongiorno, A., Ricci, F., et al. 2020, A&A, 636, A73 [NASA ADS] [CrossRef] [EDP Sciences] [Google Scholar]
- Elitzur, M., & Ho, L. C. 2009, ApJ, 701, L91 [Google Scholar]
- Elitzur, M., & Shlosman, I. 2006, ApJ, 648, L101 [Google Scholar]
- Elitzur, M., Ho, L. C., & Trump, J. R. 2014, MNRAS, 438, 3340 [Google Scholar]
- Freudling, W., Romaniello, M., Bramich, D. M., et al. 2013, A&A, 559, A96 [NASA ADS] [CrossRef] [EDP Sciences] [Google Scholar]
- Gallo, L. 2018, in Proceedings of Science, Vol. Revisiting Narrow-line Seyfert 1 Galaxies and Their Place in the Universe, 34 [Google Scholar]
- Gaskell, C. M., & Harrington, P. Z. 2018, MNRAS, 478, 1660 [NASA ADS] [CrossRef] [Google Scholar]
- Gaskell, M., Thakur, N., Tian, B., & Saravanan, A. 2022, Astron. Nachr., 343, e210112 [NASA ADS] [CrossRef] [Google Scholar]
- Gehrels, N., Chincarini, G., Giommi, P., et al. 2004, ApJ, 611, 1005 [Google Scholar]
- Goodrich, R. W. 1989, ApJ, 342, 224 [Google Scholar]
- Goodrich, R. W. 1995, ApJ, 440, 141 [CrossRef] [Google Scholar]
- Graham, M. J., Ross, N. P., Stern, D., et al. 2020, MNRAS, 491, 4925 [NASA ADS] [Google Scholar]
- Greene, J. E., Hood, C. E., Barth, A. J., et al. 2010, ApJ, 723, 409 [NASA ADS] [CrossRef] [Google Scholar]
- Grupe, D. 2004, AJ, 127, 1799 [NASA ADS] [CrossRef] [Google Scholar]
- Grupe, D., Komossa, S., & Saxton, R. 2015, ApJ, 803, L28 [NASA ADS] [CrossRef] [Google Scholar]
- Gupta, K. K., Ricci, C., Temple, M. J., et al. 2024, A&A, 691, A203 [NASA ADS] [CrossRef] [EDP Sciences] [Google Scholar]
- HI4PI Collaboration (Ben Bekhti, N., et al.) 2016, A&A, 594, A116 [NASA ADS] [CrossRef] [EDP Sciences] [Google Scholar]
- Ilić, D., Oknyansky, V., Popović, L. Č., et al. 2020, A&A, 638, A13 [NASA ADS] [CrossRef] [EDP Sciences] [Google Scholar]
- Ilić, D., Rakić, N., & Popović, L. Č. 2023, ApJS, 267, 19 [CrossRef] [Google Scholar]
- Izzo, C., de Bilbao, L., Larsen, J., et al. 2010, SPIE Conf. Ser., 7737, 773729 [NASA ADS] [Google Scholar]
- Jana, A., Ricci, C., Temple, M. J., et al. 2025, A&A, 693, A35 [NASA ADS] [CrossRef] [EDP Sciences] [Google Scholar]
- Jin, C., Done, C., & Ward, M. 2017a, MNRAS, 468, 3663 [NASA ADS] [CrossRef] [Google Scholar]
- Jin, C., Done, C., Ward, M., & Gardner, E. 2017b, MNRAS, 471, 706 [NASA ADS] [CrossRef] [Google Scholar]
- Kaspi, S., Smith, P. S., Netzer, H., et al. 2000, ApJ, 533, 631 [Google Scholar]
- Klindt, L., Alexander, D. M., Rosario, D. J., Lusso, E., & Fotopoulou, S. 2019, MNRAS, 488, 3109 [Google Scholar]
- Kollatschny, W., Grupe, D., Winkler, H., et al. 2026, A&A, 707, A46 [NASA ADS] [CrossRef] [EDP Sciences] [Google Scholar]
- Komossa, S., & Meerschweinchen, J. 2000, A&A, 354, 411 [NASA ADS] [Google Scholar]
- Komossa, S., Voges, W., Xu, D., et al. 2006, AJ, 132, 531 [NASA ADS] [CrossRef] [Google Scholar]
- Kovačević, J., Popović, L. Č., & Dimitrijević, M. S. 2010, ApJS, 189, 15 [Google Scholar]
- LaMassa, S. M., Cales, S., Moran, E. C., et al. 2015, ApJ, 800, 144 [NASA ADS] [CrossRef] [Google Scholar]
- Li, R., Ho, L. C., Ricci, C., et al. 2022, ApJ, 933, 70 [NASA ADS] [CrossRef] [Google Scholar]
- Luo, B., Brandt, W. N., Hall, P. B., et al. 2015, ApJ, 805, 122 [Google Scholar]
- Lyu, B., Yan, Z., Wu, X.-B., et al. 2025, MNRAS, 537, 1099 [Google Scholar]
- Magorrian, J., Tremaine, S., Richstone, D., et al. 1998, AJ, 115, 2285 [Google Scholar]
- Marziani, P., Sulentic, J. W., Negrete, C. A., et al. 2014, Astron. Rev., 9, 6 [Google Scholar]
- Marziani, P., del Olmo, A., D’Onofrio, M., et al. 2018, in Proceedings of Science, Vol. Revisiting Narrow-line Seyfert 1 Galaxies and Their Place in the Universe, 2 [Google Scholar]
- Matt, G., Guainazzi, M., & Maiolino, R. 2003, MNRAS, 342, 422 [NASA ADS] [CrossRef] [Google Scholar]
- Merloni, A., Dwelly, T., Salvato, M., et al. 2015, MNRAS, 452, 69 [Google Scholar]
- Miniutti, G., Saxton, R. D., Rodríguez-Pascual, P. M., et al. 2013, MNRAS, 433, 1764 [NASA ADS] [CrossRef] [Google Scholar]
- Nenkova, M., Sirocky, M. M., Nikutta, R., Ivezić, Ž., & Elitzur, M. 2008, ApJ, 685, 160 [Google Scholar]
- Netzer, H. 2019, MNRAS, 488, 5185 [NASA ADS] [CrossRef] [Google Scholar]
- Noda, H., & Done, C. 2018, MNRAS, 480, 3898 [Google Scholar]
- Osterbrock, D. E. 1977, ApJ, 215, 733 [Google Scholar]
- Osterbrock, D. E., & Ferland, G. J. 2006, Astrophysics of Gaseous Nebulae and Active Galactic Nuclei (University Science Books) [Google Scholar]
- Osterbrock, D. E., & Pogge, R. W. 1985, ApJ, 297, 166 [Google Scholar]
- Park, D., Barth, A. J., Ho, L. C., & Laor, A. 2022, ApJS, 258, 38 [NASA ADS] [CrossRef] [Google Scholar]
- Pastoriza, M., & Gerola, H. 1970, Astrophys. Lett., 6, 155 [NASA ADS] [Google Scholar]
- Peterson, B. M. 2011, Narrow-Line Seyfert 1 Galaxies and their Place in the Universe, 32 [Google Scholar]
- Peterson, B. M., Denney, K. D., De Rosa, G., et al. 2013, ApJ, 779, 109 [NASA ADS] [CrossRef] [Google Scholar]
- Planck Collaboration XIII. 2016, A&A, 594, A13 [NASA ADS] [CrossRef] [EDP Sciences] [Google Scholar]
- Predehl, P., Andritschke, R., Arefiev, V., et al. 2021, A&A, 647, A1 [EDP Sciences] [Google Scholar]
- Rakić, N. 2022, MNRAS, 516, 1624 [CrossRef] [Google Scholar]
- Rakshit, S., Stalin, C. S., Chand, H., & Zhang, X.-G. 2017, ApJS, 229, 39 [Google Scholar]
- Ricci, C., & Trakhtenbrot, B. 2023, Nat. Astron., 7, 1282 [Google Scholar]
- Ricci, C., Ueda, Y., Koss, M. J., et al. 2015, ApJ, 815, L13 [Google Scholar]
- Ricci, C., Bauer, F. E., Arevalo, P., et al. 2016, ApJ, 820, 5 [NASA ADS] [CrossRef] [Google Scholar]
- Ricci, C., Trakhtenbrot, B., Koss, M. J., et al. 2017, ApJS, 233, 17 [Google Scholar]
- Ricci, C., Kara, E., Loewenstein, M., et al. 2020, ApJ, 898, L1 [Google Scholar]
- Runnoe, J. C., Brotherton, M. S., & Shang, Z. 2012, MNRAS, 422, 478 [Google Scholar]
- Sánchez-Sáez, P., Hernández-García, L., Bernal, S., et al. 2024, A&A, 688, A157 [NASA ADS] [CrossRef] [EDP Sciences] [Google Scholar]
- Shapovalova, A. I., Popović, L. Č., Burenkov, A. N., et al. 2012, ApJS, 202, 10 [NASA ADS] [CrossRef] [Google Scholar]
- Shapovalova, A. I., Popović, L. Č., Afanasiev, V. L., et al. 2019, MNRAS, 485, 4790 [NASA ADS] [CrossRef] [Google Scholar]
- Śniegowska, M., Grzedzielski, M., Czerny, B., & Janiuk, A. 2022, Astron. Nachr., 343, e210065 [Google Scholar]
- Stern, D., McKernan, B., Graham, M. J., et al. 2018, ApJ, 864, 27 [Google Scholar]
- Tody, D. 2000, in Encyclopedia of Astronomy and Astrophysics, ed. P. Murdin, 2923 [Google Scholar]
- Tohline, J. E., & Osterbrock, D. E. 1976, ApJ, 210, L117 [Google Scholar]
- Tortosa, A., Ricci, C., Tombesi, F., et al. 2022, MNRAS, 509, 3599 [Google Scholar]
- Vaona, L., Ciroi, S., Di Mille, F., et al. 2012, MNRAS, 427, 1266 [NASA ADS] [CrossRef] [Google Scholar]
- Wachter, K., Leach, R., & Kellogg, E. 1979, ApJ, 230, 274 [NASA ADS] [CrossRef] [Google Scholar]
- Wang, J. M., & Netzer, H. 2003, A&A, 398, 927 [NASA ADS] [CrossRef] [EDP Sciences] [Google Scholar]
- Wang, J., Zheng, W. K., Brink, T. G., et al. 2023, arXiv e-prints [arXiv:2308.16521] [Google Scholar]
- Wang, S., Woo, J.-H., Gallo, E., et al. 2024, ApJ, 966, 128 [NASA ADS] [CrossRef] [Google Scholar]
- Whittle, M. 1992, ApJS, 79, 49 [Google Scholar]
- Xu, D. W., Komossa, S., Grupe, D., et al. 2024, arXiv e-prints [arXiv:2401.10600] [Google Scholar]
- Yaqoob, T., Warwick, R. S., & Pounds, K. A. 1989, MNRAS, 236, 153 [NASA ADS] [CrossRef] [Google Scholar]
- Zeltyn, G., Trakhtenbrot, B., Eracleous, M., et al. 2022, ApJ, 939, L16 [NASA ADS] [CrossRef] [Google Scholar]
- Zeltyn, G., Trakhtenbrot, B., Eracleous, M., et al. 2024, ApJ, 966, 85 [NASA ADS] [CrossRef] [Google Scholar]
Appendix A: Host modelling
A.1. 2004-04 host galaxy modelling
Since the reconstruction of the host galaxy contribution using eigenspectra did not provide reliable results for the 2004-04 spectrum, we used the host model extracted from the 2021-12 spectrum (see Sect. 3.4). It is reasonable to assume that the host contribution remains constant, as it is not expected to vary significantly over 15-year timescale. To subtract the host model from the 2004-04 spectrum, we rebinned the latter to match the wavelength range of the 2021-12 spectrum. Fig. A.1 shows the observed spectrum, the host model derived from the 2021-12 data, and the resulting subtraction. The main absorption lines seen in the stellar continuum (G-band at 4304Å, Mg at 5175 Å, Na at 5894Å) disappear from the subtracted spectrum, confirming that it represents a pure AGN spectrum. For this reason, no flux-scaling correction between the 2004-04 spectrum and the 2021-12 host model was required. Once the host contribution is removed, the pure AGN spectrum clearly shows a continuum rising toward the blue wavelengths, as commonly observed in NLS1s (Costantin et al. 2022).
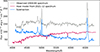 |
Fig. A.1. Host galaxy spectrum (2021-12 model, pink magenta), the observed 2004-04 spectrum (grey) and the pure AGN spectrum obtained (bright blue). |
A.2. 2021-01 host galaxy modelling
We reconstructed the host galaxy contribution for the 2021-01 spectrum using all fantasy available eigenspectra, masking the narrow emission lines. The resulting host galaxy model shows stellar absorption features- such as G-band at 4304Å, Mg at 5175 Å and Na at 5894Å- which, combined with the absence of strong hydrogen absorption lines, resembles a galaxy hosting an older stellar population (Fig. A.2). This is likely due to the fact that the spectra were extracted from the central region of the galaxy, where the AGN contribution is strongest and where old stars typically dominate.
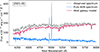 |
Fig. A.2. Host galaxy model (magenta pink), observed spectrum (grey) and actual subtraction (bright blue) from the 2021-01 spectrum. |
A.3. 2021-12 host galaxy modelling
We performed the host-galaxy reconstruction for the 2021-12 spectrum following the same procedure adopted for the 2021-01 spectrum. Here we show the actual fit of the host model provided by fantasy (Fig. A.3), which yields the best reduced χ2. This is the reason why we chose to use this host model to account for the galaxy contribution in the 2004-04 spectrum.
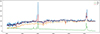 |
Fig. A.3. fantasy fit of the host galaxy model for the 2021-12 spectrum. The host model is shown in orange, the extracted AGN spectrum in green, the observed spectrum in blue, and the fit in red. |
A.4. 2023-09 host modelling
We performed the host-galaxy reconstruction for the 2023-09 spectrum following the same procedure adopted for the 2021-01 spectrum, using fantasy ((Fig. A.4).
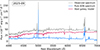 |
Fig. A.4. Host galaxy model (magenta pink), observed spectrum (grey) and actual subtraction (bright blue) from the 2023-09 spectrum. |
Appendix B: Slit position angles
The choice not to apply absolute [O III] calibration to the 2021-01 and 2023-09 spectra is motivated earlier in the text. Figure B.1 shows the different slit orientations for each observation.
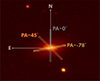 |
Fig. B.1. NTT g−band image of J0413-0050, oriented North–East (N-E). The PAs of the slits for the different observations are shown. The PAs of the 2021-01, 2021-12, and 2023-09 spectra are indicated in orange, yellow, and grey, respectively. |
Appendix C: Light curve
We retrieved the All-Sky Automated Survey for Supernovae (ASAS-SN 2) light curve, covering the period from 2013 to 2025. It does not show any significant magnitude variations; only mild changes associated with the ‘classical’ AGN variability are present, with no evidence of CL-related events. It should be noted that the host galaxy may dominate the light curve, potentially preventing dramatic AGN flux changes from being detected. Figure C.1 shows a zoom-in of the light curve over the 2021–2025 interval.
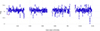 |
Fig. C.1. ASAS-SN curve-light 2021-2025 |
Appendix D: Host galaxy
The optical images of this source were obtained with NTT (proposal ID: 0104.B-0587(A), PI M. Berton) in October 2019. The g- and i-band observations were carried out using the ESO EFOSC2 (seeing ≈1.3"). The exposure time was 300s for both images. We performed a standard reduction using IRAF, including bias and flat-field correction, followed by alignment, sky subtraction, fringing removal, and combination of the images in each filter.
The g − i colour map is shown in Fig. D.1. The colour is fairly uniform across the entire galaxy, except for the nucleus. The central region of the map appears yellowish, with g − i ≈ 2, a value typically observed in red quasars at this redshift (Klindt et al. 2019). The host galaxy image and colour map (Fig. D.1) reveal a disc structure, suggesting a late-type morphology for J0413-0050, likely hosting an old stellar population in its centre, as also indicated by the absorption lines seen in the host galaxy spectrum.
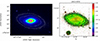 |
Fig. D.1. g − i colour map of J0413-0050 |
All Tables
Details of the X-ray observations analysed in this work together with X-ray flux, luminosity, Γ measurements, and Eddington ratio.
All Figures
|
Fig. 1. Multi-component fitting with fantasy of J0413-0050 2004-04 spectrum (grey line) in the 4000–6850 Å range. The model (red line) is composed of an underlying continuum (dotted dark blue line), broad components of Balmer lines (light blue line), narrow emission lines (water green line), Fe II multiplets (fuchsia line) and broad components of He I (orange line). The residuals, subtraction of the model to the AGN spectrum, are shown in grey at the bottom of the panel. |
| In the text | |
|
Fig. 2. Multi-component fitting with fantasy of J0413-0050 2021-01 spectrum (grey line) in the 4300–5700 Å range. The model (red line) is composed of an underlying continuum (dotted dark blue line) and narrow emission lines (water green line). The residuals, subtraction of the model to the AGN spectrum, are shown in grey at the bottom of the panel. |
| In the text | |
|
Fig. 3. Multi-component fitting with fantasy of J0413-0050 2021-12 spectrum (grey line) in the 4500–6850 Å range. The model (red line) is composed of an underlying continuum (dotted dark blue line) and narrow emission lines (water green line) and broad emission lines (light blue line). No relevant broad components for Hβ and He or FeII multiplets are present in this fit. The residuals, subtraction of the model to the AGN spectrum, are shown in grey at the bottom of the panel. |
| In the text | |
|
Fig. 4. Zoom-in of the Hα-[N II] complex for the 2021-12 spectrum, which is totally resolved. A first attempt at fitting only narrow components of [N II] and Hα. |
| In the text | |
|
Fig. 5. Zoom-in of the Hα-[N II] complex of the 2021-12 spectrum, also including the broad component for Hα, with amplitude results slightly higher than 3σ. |
| In the text | |
|
Fig. 6. Zoom-in of the Hβ–[OIII] region of the 2021-12 spectrum, showing the attempted fit of an Hβ component despite the absence of a real emission line at that position. |
| In the text | |
|
Fig. 7. Multi-component fitting with fantasy of J0413-0050 2023-09 spectrum (grey line) in the 4450–6740 Å range. The model (red line) is composed of an underlying continuum (dotted dark blue line), broad components of Balmer lines (light blue line) and narrow emission lines (water green line). The residuals, subtraction of the model to the AGN spectrum, are shown in grey at the bottom of the panel. |
| In the text | |
|
Fig. 8. Zoom-in of the Hβ-[O III] λ4959,5007 region of the 2023-09 spectrum. Hβ is decomposed in a broad and a narrow component, fixed to the [O III] λ5007 line. We cut the plot in flux to zoom into the Hβ component, keeping out the majority of the emission of the [O III] λ4959,5007 lines. |
| In the text | |
|
Fig. 9. Zoom-in of the Hα-[N II] complex of the 2023-09 spectrum, which is completely resolved. The Hα clearly show both broad and narrow components. |
| In the text | |
|
Fig. 10. X-ray spectra of J0413-0050 from the eROSITA observation from 2020 (green triangles), Swift-XRT observation from 2022-11 (blue squares), and 2023-09 (orange circles). X-ray spectra are fitted with a simple power law absorbed by Galactic absorption. Spectra are visually re-binned for clarity. Spectra above 5 keV are dominated by noise. |
| In the text | |
|
Fig. 11. All the host subtracted spectra of J0413-0050. The Hβ line is only visible in 2004-04 and 2023-09 spectra, while the spike at the same position in the 2021-01 one is probably due to the noise. The change in the Hα and the continuum shapes is also visible. |
| In the text | |
|
Fig. A.1. Host galaxy spectrum (2021-12 model, pink magenta), the observed 2004-04 spectrum (grey) and the pure AGN spectrum obtained (bright blue). |
| In the text | |
|
Fig. A.2. Host galaxy model (magenta pink), observed spectrum (grey) and actual subtraction (bright blue) from the 2021-01 spectrum. |
| In the text | |
|
Fig. A.3. fantasy fit of the host galaxy model for the 2021-12 spectrum. The host model is shown in orange, the extracted AGN spectrum in green, the observed spectrum in blue, and the fit in red. |
| In the text | |
|
Fig. A.4. Host galaxy model (magenta pink), observed spectrum (grey) and actual subtraction (bright blue) from the 2023-09 spectrum. |
| In the text | |
|
Fig. B.1. NTT g−band image of J0413-0050, oriented North–East (N-E). The PAs of the slits for the different observations are shown. The PAs of the 2021-01, 2021-12, and 2023-09 spectra are indicated in orange, yellow, and grey, respectively. |
| In the text | |
|
Fig. C.1. ASAS-SN curve-light 2021-2025 |
| In the text | |
|
Fig. D.1. g − i colour map of J0413-0050 |
| In the text | |
Current usage metrics show cumulative count of Article Views (full-text article views including HTML views, PDF and ePub downloads, according to the available data) and Abstracts Views on Vision4Press platform.
Data correspond to usage on the plateform after 2015. The current usage metrics is available 48-96 hours after online publication and is updated daily on week days.
Initial download of the metrics may take a while.