


Fig. 2.
Download original image
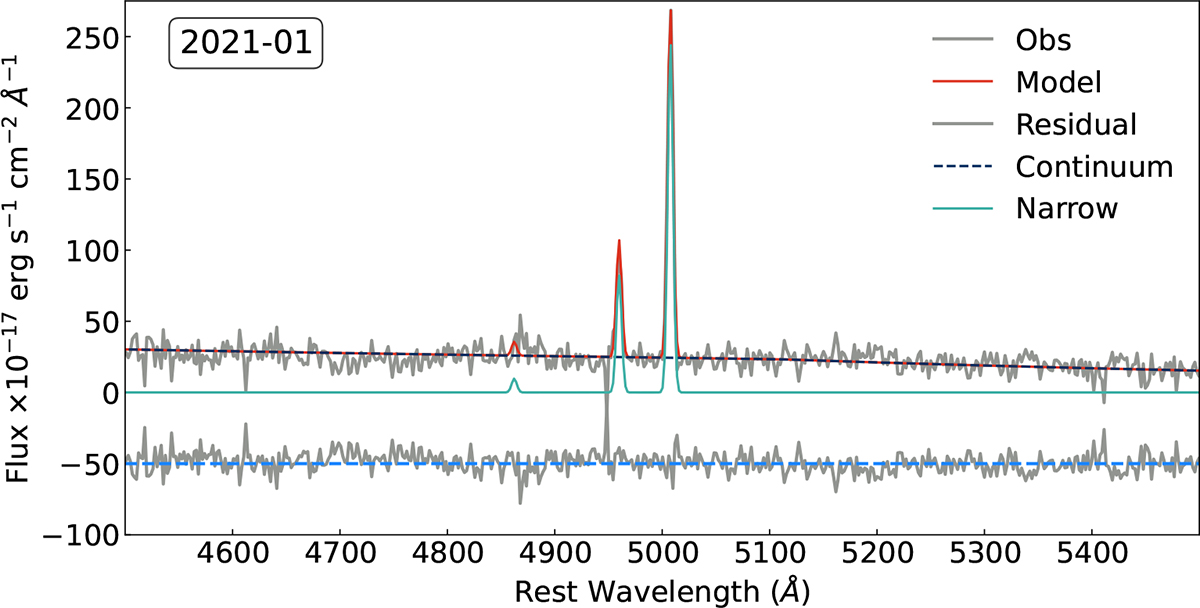
Multi-component fitting with fantasy of J0413-0050 2021-01 spectrum (grey line) in the 4300–5700 Å range. The model (red line) is composed of an underlying continuum (dotted dark blue line) and narrow emission lines (water green line). The residuals, subtraction of the model to the AGN spectrum, are shown in grey at the bottom of the panel.
Current usage metrics show cumulative count of Article Views (full-text article views including HTML views, PDF and ePub downloads, according to the available data) and Abstracts Views on Vision4Press platform.
Data correspond to usage on the plateform after 2015. The current usage metrics is available 48-96 hours after online publication and is updated daily on week days.
Initial download of the metrics may take a while.