


| Issue |
A&A
Volume 710, June 2026
|
|
|---|---|---|
| Article Number | A180 | |
| Number of page(s) | 17 | |
| Section | Catalogs and data | |
| DOI | https://doi.org/10.1051/0004-6361/202558223 | |
| Published online | 10 June 2026 | |
CURLING
III. Identifying candidate wide-separation gravitationally lensed quasars from the CatNorth catalogue
1
National Astronomical Observatories, Chinese Academy of Sciences,
20A Datun Road, Chaoyang District,
Beijing
100101,
China
2
School of Astronomy and Space Science, University of Chinese Academy of Sciences,
Beijing
100049,
China
3
Department of Physics, Nanchang University,
Nanchang
330031,
China
4
Center for Relativistic Astrophysics and High Energy Physics, Nanchang University,
Nanchang
330031,
China
5
Purple Mountain Observatory, Chinese Academy of Sciences,
Nanjing,
Jiangsu
210023,
China
6
Key Laboratory of Space Astronomy and Technology, National Astronomical Observatories, Chinese Academy of Sciences,
20A Datun Road, Chaoyang District,
Beijing
100101,
China
7
Kavli Institute for Astronomy and Astrophysics, Peking University,
Yi He Yuan Lu 5, Haidian Qu,
100871
Beijing,
China
8
Department of Astronomy, School of Physics, Peking University,
Beijing
100871,
China
9
Leiden Observatory, Leiden University,
Leiden,
The Netherlands
10
Kapteyn Astronomical Institute, University of Groningen,
PO Box 800,
9700 AV
Groningen,
The Netherlands
★ Corresponding author: This email address is being protected from spambots. You need JavaScript enabled to view it.
; This email address is being protected from spambots. You need JavaScript enabled to view it.
Received:
23
November
2025
Accepted:
1
April
2026
Abstract
Aims. Wide-separation lensed quasars (WSLQs) represent a special but rare subclass of strongly lensed quasars with multiple images, magnified by massive galaxy cluster lenses, which offer valuable probes for the properties of dark matter halos and detailed characteristics of quasar host galaxies. However, only around ten WSLQ systems are known so far, limiting the development of relevant investigations.
Methods. To enlarge the sample of WSLQs by mining candidates from large-scale sky surveys, we develop a catalogue-based pipeline and apply it to the CatNorth, which is a quasar candidate catalogue with more than 1.5 million candidates constructed from Gaia DR3. The CatNorth has a purity of ~90% and a limiting magnitude in the Gaia G band of ≲21.
Results. Our pipeline unfolds in three sequential stages. First, to search for groups of quasar candidates with a maximum quasar image separation between 10 and 72 arcsec, we applied a friends-of-friends-like algorithm to the HEALPix grids of CatNorth objects using a grid size of 25.6 arcsec. Second, these identified groups undergo an automatic filtering process that assesses the intra-group similarity of photometric colours or spectral information when available. These two steps yield 14 760 quasar candidate groups, while retaining all discoverable previously known WSLQs. Third, a visual inspection, guided primarily by the projected geometry of the quasar images and plausible foreground objects, yields the final candidate sample, with a label indicating the candidates’ quality.
Conclusions. We have identified a total of 333 new WSLQ candidates with separations ranging from 10 to 56.8 arcsec. By exploiting the available SDSS DR16/DESI DR1 spectroscopic data, we uncovered two novel WSLQ candidate systems, but 331 WSLQ candidates - 45 Grade A, 98 Grade B, and 188 Grade C systems - lack sufficient spectral information. In addition, a sample of 29 dual quasar candidates is presented as a by-product. When feasible, we plan to secure follow-up spectroscopy and deeper imaging to confirm WSLQs from the above candidates and proceed with pertinent scientific investigations.
Key words: gravitational lensing: strong / methods: data analysis / catalogs / galaxies: clusters: general / quasars: general
© The Authors 2026
 Open Access article, published by EDP Sciences, under the terms of the Creative Commons Attribution License (https://creativecommons.org/licenses/by/4.0), which permits unrestricted use, distribution, and reproduction in any medium, provided the original work is properly cited.
This article is published in open access under the Subscribe to Open model. This email address is being protected from spambots. You need JavaScript enabled to view it. to support open access publication.
1 Introduction
A strongly lensed quasar is a quasar whose light is magnified, distorted, and multiplied by the gravitational field of a massive object, such as a foreground galaxy or galaxy cluster, situated along the line of sight (Walsh et al. 1979). Such multiply imaged strongly lensed quasar systems are of high scientific value, and can be used to study the properties of active galactic nuclei (AGNs) through microlensing effects caused by stars in the foreground galaxies (Anguita et al. 2008; Motta et al. 2012; Fian et al. 2024), measure the Hubble constant via time-delay measurements, and explore the properties of dark matter (Oguri et al. 2014; Suyu et al. 2014; Wong et al. 2020; Kochanek 2020; Sonnenfeld 2021).
In particular, as a type of lensed quasar, the wide-separation lensed quasar (WSLQ) whose maximum separation is greater than 10 arcsec (Napier et al. 2023) holds particular scientific value. These systems are produced by galaxy group or galaxy cluster scale dark matter halos’ gravitational lensing effect, and their wide separations allow observations of the quasar along multiple, widely separated lines of sight, which facilitates the construction of the three-dimensional spatial distribution of outflows of the source AGN (Misawa et al. 2013, 2014; Misawa et al. 2016). The image positions, time delays, and magnification factors of WSLQs can place constraints on the mass distributions of the cluster-scale dark matter halos (Sharon et al. 2017; Martinez et al. 2023; Napier et al. 2023). Moreover, the wide separations and high magnifications of WSLQs help resolve quasar host galaxies (Bayliss et al. 2017; Cloonan et al. 2025).
The number of WSLQs remains limited. To date, approximately 300 lensed quasars have been discovered (see, e.g. Lemon et al. 2023); among them, eight are WSLQs (Inada et al. 2003, 2006; Oguri et al. 2008; Dahle et al. 2013; Shu et al. 2018, 2019; Stern et al. 2021; Martinez et al. 2023; Napier et al. 2023). Despite these findings, significant potential remains for further discoveries of WSLQs within currently available datasets, because the observed number remains far below the prediction (Robertson et al. 2020).
In this work, we constructed a WSLQ candidate catalogue by applying the quasar group-finding method of He et al. (2023). The parent sample is CatNorth (Fu et al. 2024), a new high-quality catalogue derived from the Gaia DR3 quasar candidate catalogue (Gaia Collaboration 2023a). The purity of the CatNorth quasar candidate catalogue is up to 90%, while the primordial Gaia DR3 quasar candidate catalogue only has a purity of about 52% (Gaia Collaboration 2023b). The higher purity helps reduce the false positive rate of lensed quasar searching.
The selection has three stages. First, we grouped CatNorth quasar candidates on the sky with a HEALPix-based friends-of-friends-like algorithm, clustering objects that are adjacent in projection. Second, we kept only groups whose maximum pairwise separation exceeds 10 arcsec and subjected them to an automatic filter that assessed intra-group similarity in photometric colours or, when available, spectroscopic consistency by the spectrum retrieved from several spectrum datasets. Together these steps reduced CatNorth from 1545 514 candidates to 14 760 quasar candidate groups. Finally, a visual inspection (VI), guided by the image geometry and the presence of plausible foreground deflectors, yielded our final sample of WSLQ candidates; objects in this sample lack sufficient spectroscopic information. In addition, we identified two further valuable WSLQ candidates with available spectra. For the final candidate sample, we performed the cross-match with three catalogues of a total of about 1.9 million galaxy clusters to find the most likely WSLQ candidates. Besides this, we estimated the completeness of our WSLQ candidate catalogue by testing the discoverable rate of the known WSLQs and assessing our searching algorithm by examining the recovery rate of discoverable WSLQs.
In the process of searching for lensed quasars, dual quasars can often be found as a by-product (He et al. 2025a). We also generated a dual quasar candidate catalogue in this work. Dual quasars refer to physically associated quasar pairs, typically separated by 1 pc to 100 kpc (De Rosa et al. 2019). The corresponding angular separation extends to ∼ 12 arcsec at redshift 2 in the Λ cold dark matter (ΛCDM) Universe. They are often picked up in searches for lensed quasars because the member quasars of dual quasars lie close to one another in terms of the angular position on the sky, which is similar to the angular position relation between the member images of multiply lensed quasar images. Dual quasars serve as valuable objects for investigating the galaxy merger process and the properties of supermassive black holes (Boylan-Kolchin et al. 2008; Roedig et al. 2014; Romero et al. 2016; Martin et al. 2018). However, the number of known dual quasars remains limited. Pfeifle et al. (2025) reported that, at that time, the number of confirmed dual AGNs was only ∼160. More recent work, such as Jing et al. (2025) (hereafter J25), identified ∼900 spectroscopically confirmed quasar pairs that are potentially tightly bound, selected by requiring a line-of-sight velocity difference of <600 km s−1 and a projected physical separation of <110 kpc.
The paper is organised as follows. Section 2 introduces the datasets that we utilised in this work. In Section 3, we detail our quasar group finding algorithm and the further screening method. The results of the WSLQ candidate catalogue and dual quasar candidate catalogue are shown in Section 4. Sections 5 and 6 include the discussion and the conclusion of this work, respectively. We adopt a ΛCDM cosmology in which parameters are from Planck 2018 results (Planck Collaboration VI 2020). All magnitudes quoted in this paper are in the AB system.
2 Datasets
Our analysis is anchored in CatNorth, whose properties are summarised in Section 2.1. To aid in the selection of high-value lensed quasar candidates (LQCs) and assess the reliability of our algorithm, we further drew on several auxiliary resources, including spectroscopic archives, galaxy cluster catalogues, and discoverable known WSLQs in CatNorth, introduced in Sections 2.2, 2.3, and 2.4, respectively.
2.1 CatNorth
Our search for LQCs was performed based on the CatNorth (Fu et al. 2024). CatNorth lists 1 545 514 quasar candidates extracted from the approximately 6.6 million sources in the Gaia DR3 quasar candidate catalogue (Gaia Collaboration 2023a) and raises the purity to about 90%. This catalogue is primarily selected with a machine learning classification model trained on multi-band photometry; the machine-learning-selected candidates are further purified with proper motions. During this process Fu et al. (2024) utilised g, r, i, z, and y photometry from Pan-STARRS1 (Chambers et al. 2016) together with W1 and W2 photometry from the CatWISE2020 (Marocco et al. 2021) and incorporated these in the final CatNorth table. CatNorth covers about 3π steradians of sky and has a limiting magnitude of ≲21 in the Gaia G band. For each quasar candidate, it also provides a photometric redshift, zph, derived using an ensemble regression model. Owing to its large area and high purity, CatNorth constitutes a suitable parent sample for the discovery of WSLQs and dual quasars.
2.2 Spectrum datasets
To refine the LQCs found by our quasar group finder, we retrieved the relevant optical spectra from two spectroscopic surveys: SDSS Data Release 16 (SDSS DR16; Ahumada et al. 2020) and the DESI Data Release 1 (DESI DR1; DESI Collaboration 2025). The Sloan Digital Sky Survey (SDSS; York et al. 2000; Eisenstein et al. 2011; Blanton et al. 2017) is conducted at the Apache Point Observatory (APO). The quasar catalogue of the SDSS sixteenth data release (DR16; Lyke et al. 2020) compiles all quasar spectra obtained since the inception of SDSS (Richards et al. 2002; Dawson et al. 2013; Dawson et al. 2016), including observations from the Baryon Oscillation Spectroscopic Survey (BOSS; Dawson et al. 2013) and the Extended BOSS (eBOSS; Dawson et al. 2016), and contains a total of 750 414 quasars, of which ∼500 000 lie in the redshift range 0.8 < z < 2.2 (Dawson et al. 2016). The Dark Energy Spectroscopic Instrument (DESI; Levi et al. 2013; DESI Collaboration 2016, 2022) is carried out by the Mayall 4 m Telescope at Kitt Peak National Observatory (KPNO). The first public data release, DESI DR1 (DESI Collaboration 2025), constitutes a milestone for spectroscopic sky surveys, providing spectra for 1 647 484 quasars reaching a maximum redshift of z ∼6-7; about 95% of these quasars lie at redshifts of z ∼ 0-3.
For objects with existing spectra in these catalogues, we applied an automatic filter to reject quasar groups whose spectroscopic information is inconsistent with the nature of strongly lensed quasars. By doing so, we flagged a subset of high-priority LQCs. In addition to LQCs, we yielded a catalogue of dual quasar candidates based on quasar groups’ projected separation and line-of-sight velocity difference. Details of the filtering are given in Section 3.2.
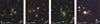 |
Fig. 1 Optical images of the four discoverable WSLQs. From left to right: SDSS J1004+4112, SDSS J1029+2623, SDSS J1326+4806, and GraL J165105.3-041725. Quasar images included in CatNorth are marked with white circles. The quasar images that belong to known WSLQ systems but are not included in CatNorth are marked as red circles (we only plot the non-odd image). The images of the first three panels are from DESI Legacy Imaging Surveys DR9, and the rightmost panel is from Pan-STARRS1. (Orientation: north is up, south is down, west is left, and east is right; same hereafter). |
2.3 Galaxy cluster catalogue
We cross-matched WSLQ candidates obtained in this work with several galaxy group and galaxy cluster catalogues. Systems whose image separations exceed 10 arcsec at a typical redshift configuration (lens redshift at 0.5 and source redshift at 2) require a massive deflector of σv ≳ 522 km s−1 under the simple SIS (singular isothermal sphere) assumption, using the relation between velocity dispersion and mass for massive dark matter halo provided by Evrard et al. (2008), we infer that this value corresponds to the M500 of 7.87 × 10¹³ M⊙, typically a galaxy group or cluster (Sharon et al. 2020); thus, the presence of a known cluster near a candidate improves the probability that the system is a real WSLQ.
We employed three galaxy cluster catalogues:
WEN_CAT - the compilation of Wen & Han (2024) - lists 1581 179 clusters with M500 > 4.7 × 10¹³ M⊙. The median mass is 7.9 × 10¹³ M⊙ and redshifts reach z ≈ 1.5.
ZOU_CAT - the catalogue from Zou et al. (2021) - contains 540 432 clusters with a median M500 = 1.23 × 10¹⁴ M⊙ and z ≤ 1.
ERO_CAT - the eRASS1 Galaxy Groups and Clusters primary catalogue (Bulbul et al. 2024) - comprises 12 247 clusters and groups spanning 5 × 10¹² M⊙ < M500 < 2 × 10¹⁵ M⊙ and extending to z = 1.32.
Together, WEN_CAT and ZOU_CAT comprise close to two million clusters, offering a particularly rich resource for our studies. Roughly 40% of ZOU_CAT objects and 90% of ERO_CAT objects have counterparts in WEN_CAT. The ERO_CAT, constructed from X-ray observations, is a galaxy cluster or group catalogue that can serve as a valuable complement, because X-ray selection is more sensitive to the true three-dimensional mass distribution, whereas optical selection is more easily affected by structures along the line of sight (Rosati et al. 2002; Ebeling et al. 2010; Allen et al. 2011; Marulli et al. 2018; Koulouridis et al. 2021). These catalogues allow us to mark the LQCs that lie near known clusters and to single out high-priority systems. The relevant cross-matching process is presented in Section 4.1.
2.4 Known WSLQs
Up to now, eight WSLQ systems are known. By the fraction of these lenses that appear in the CatNorth and the fraction of discoverable known lenses that successfully pass through our pipeline, we can estimate the completeness of CatNorth and evaluate the reliability of our LQC search algorithm. Among the eight known WSLQs, four are present in CatNorth: J1004+4112 (Inada et al. 2003, 2005), SDSS J1029+2623 (Inada et al. 2006; Oguri et al. 2008), SDSS J1326+4806 (Shu et al. 2019), and GraL J165105.3-041725 (Stern et al. 2021), i.e. at least two images were found in CatNorth; the remaining WSLQs are missing because they fall below the CatNorth’s limiting magnitude, with only the brightest image of COOL J0542-2125 (Martinez et al. 2023) in the DESI Legacy Imaging Surveys DR9 having a counterpart image in CatNorth. This yields a coverage of approximately 50% for the known WSLQs within CatNorth. For the four discoverable lenses, CatNorth contains only two images each. Their image cut-outs are displayed from left to right in Figure 1, while the intrinsic image multiplicities of these systems are 5, 3, 2, and 4 from left to right, respectively. In Section 5.1, we assess the performance of these known lenses in our search pipeline and, on that basis, infer the reliability of our algorithm.
3 Methodology
The search for WSLQ and dual quasars in CatNorth was carried out in three stages, summarised in Figure 2. First, we applied the group finder in He et al. (2023) to the sky positions of quasar candidates in CatNorth to form a quasar group sample; full details are given in Section 3.1. Second, an automatic filter based on the spectroscopic or photometric similarity of the members within each group was performed, as described in Section 3.2. In this step, we retained only those quasar groups whose maximum pairwise separation is greater than 10 arcsec, which is the typical scale of a galaxy cluster lensed quasar. Groups in CatNorth with a maximum image separation smaller than 10 arcsec were analysed in a companion work (He et al., in prep.). All discoverable known WSLQs present in CatNorth survive these two steps. Third, a VI based on the projected spatial configuration of the group members and the plausible foreground object yielded the final samples of LQCs and dual quasar candidates, outlined in Section 3.3.
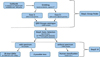 |
Fig. 2 Flowchart illustrating the methodology employed to select WSLQ candidates and dual quasar candidates from the CatNorth. |
3.1 Quasar group finder
We adopted the quasar group search algorithm from He et al. (2023) to construct a catalogue of quasar candidate groups whose members’ projected angular positions are adjacent on the sky. All CatNorth sources were first assigned to the grid defined by Hierarchical Equal Area isoLatitude Pixelization (HEALPix; Gorski et al. 1999) with Nside = 213; this choice gives an angular resolution of about 25.6 arcsec and a total of 8.1 × 108 pixels. The 1 545 514 objects in CatNorth occupy 1 542 794 distinct pixels. For a WSLQ system, two possible cases of its image-pixel mapping are expected. Pixels containing at least two candidates while none of their eight neighbours host any candidates formed Case 1 of the quasar candidate group sample, which comprises 2636 groups. Then, starting from every pixel that contains at least one quasar candidate, we examined its surrounding pixels; whenever additional candidates were found, they were iteratively collected, together with their neighbouring pixels, until no further quasar candidates appeared. Each assembly of candidates obtained in this way, together with those in the initial pixel, defines a sample labelled Case 2; it contains 20 096 groups. Combining Case 1 and Case 2 yields 22 732 quasar candidate groups, which we refer to as the quasar group catalogue (QGC).
Within the QGC, 22 280 groups contain exactly two quasar candidates, and 452 groups contain three or more. For each group with N ≥ 3, we also formed every subgroup of size 2 to N – 1 and added it to the QGC. This adds 1 669 groups, increasing the catalogue to 24401. The goal is to keep real lenses that might otherwise fail the colour-similarity filter because the original group includes unrelated neighbours with different colours (detailed in Section 3.2).
3.2 Automatic screening
From the roughly 24000 quasar groups returned by the group finder, we conducted a series of automatic screenings. We first excluded systems whose maximum pairwise separation was ≤10 arcsec. Then, because the optical spectra and colours of multiple images in a lensed quasar were expected to be highly alike, we then applied an automatic filter based on spectroscopic or photometric similarity to eliminate groups whose members displayed pronounced discrepancies.
To perform the automatic screening based on the available spectroscopic data, we cross-matched the positions of member quasar candidates in each group with the SDSS DR16 and DESI DR1 within a 1 arcsec radius. We found that 6730 groups possess spectra for at least two members1. For every pair of spectra of member quasar candidates in such a group, we computed the velocity difference of (Hogg 2000):
 (1)
(1)
where Δz is the redshift difference, zmean is the average redshift of the pair, and c is the speed of light in vacuum. Groups containing any member pair with Δv > 3000 km s−1 were rejected. For the main spectroscopic database used in this work, DESI DR1, the probability of catastrophic spectroscopic redshift failures with velocity errors exceeding 3000 km s−1 is extremely low DESI Collaboration (2023). Such large velocity offsets are highly improbable for multiple images of a lensed quasar. After this cut, 516 out of 6730 groups remained.
For groups that lacked at least two spectroscopic measurements, we turned to photometry. Following the prescription of He et al. (2023), we calculated the colour similarity, Scolour, from the g, r, z, W1, and W2 magnitudes and discarded all groups with Scolour < 0.5. The definition of colour similarity is
![Mathematical equation: S_{\rm colour} = \begin{cases} 1 - \dfrac{1}{10}\displaystyle\sum_{i=1}^{10}\sigma_i, & \text{if } \dfrac{1}{10}\displaystyle\sum_{i=1}^{10}\sigma_i < 1\\[6pt] 0, & \text{if } \dfrac{1}{10}\displaystyle\sum_{i=1}^{10}\sigma_i \ge 1 \end{cases} \label{eq:s_colour} .](/articles/aa/full_html/2026/06/aa58223-25/aa58223-25-eq2.png) (2)
(2)
Here, Ncolour = 10 for the five photometric bands {g, r, z, W1, W2}, i.e. the ten colours {g – r, g – z, g – W1, g –W2, r – z, r – W1, r – W2, z – W1, z – W2, W1 – W2}. For a candidate group with n ≥ 2 images, σi is the standard deviation of the i-th colour measured across the n images. All four discoverable known lenses in CatNorth satisfy Scolour > 0.5, indicating that this cut preserves real strong lenses. After applying this filter, 14244 groups without sufficient spectroscopic information remain. We note that, for a direct comparison with the selection criterion of Scolour > 0.5 used in He et al. (2023), we chose the same three optical bands, g, r, and z, in our optical-band selection. In this work, applying the selection criterion of Scolour > 0.5 removes only ∼15% of the groups, which is much lower than the 36% reported in He et al. (2023). This may be because the AGN purity of CatNorth, reaching as high as ∼90%, means that the original CatNorth sources tend to have a certain degree of colour similarity. In addition, we also tried including the Pan-STARRS1 i band in the calculation of Scolour, while still keeping all colours with the same weight and scoring on a scale from 0 to 1, which is similar to Eq. (2). We find that the total number of samples selected with the criterion of Scolour > 0.5 from the full set of groups found by the group finder differs by only ∼4% between the cases with and without the i band, and that the small sub-sample that is only belong to the selection results including the i band all have Scolour < 0.57, which is far below that of the known discoverable lenses. This indicates that the inclusion of the i band has little impact on the total sample size, and a limited effect on the sample of high-value WSLQ candidates. Therefore, we decided to adopt the same three optical bands, g, r, and z, as in He et al. (2023) for our colour similarity calculation.
After the conservative automatic filtering, we retained 516 groups in which at least two quasar candidate images possess optical spectra, together with 14 244 groups that lack adequate optical spectra. We subsequently conducted a VI to isolate systems that are possibly WSLQs.
For the 516 groups with spectra, we first evaluated spectral similarity and the presence or absence of a foreground galaxy cluster. This examination identified two systems that are plausible WSLQs, which are described in Section 4.2; their confirmation or refutation will require higher-quality follow-up observations. Among the remaining groups, we applied the criteria about velocity difference between group members and the projected distance, subsequently producing 29 dual quasar candidates; the relevant selection criteria and the results are detailed in Section 4.3.
3.3 Human classification for WSLQs
For the 14 244 groups that lack adequate optical spectra, Di Wu and Shenzhe Cui carried out a VI based on their DESI Legacy Imaging Surveys DR9 images (Zou et al. 2017; Dey et al. 2019) and Pan-STARRS1 images (Chambers et al. 2016; since for a part of the samples, the image from DESI Legacy Imaging Surveys DR9 is not available). Before VI, the inspectors reviewed the DESI Legacy Imaging Surveys DR9 and Pan-STARRS1 images of the four discoverable known lenses to get familiar with the features of true lensed systems. During VI, each one in these 14244 groups received a score reflecting its likelihood of being a WSLQ, based on three criteria: (i) the presence of one or more bright, colour-similar member galaxies of the plausible foreground galaxy cluster near the geometric centre of the quasar images, with preference for a luminous brightest cluster galaxy (BCG); (ii) in double-image configurations, the opening angle of the triangle defined by the putative lens and the two images, with larger angles deemed more lens-like; (iii) the degree of colour similarity among the quasar images. We note that a relatively large fraction of WSLQs are in the naked cusp configuration (e.g. Inada et al. 2006; Napier et al. 2023), and in this case the image characteristics do not necessarily satisfy criterion (i), as the central lens galaxy in this configuration is not necessarily located between any two images. Therefore, this may cause us to miss lenses of this type in our final results, which is a limitation of our method.
Each group was then graded on a four-point scale (0, 1, 2, 3), where 0 denotes a system that is certainly not a strong lens and higher values indicate increasing probability. The final score is the average of the two inspectors’ assessments. Groups with a score below 1 were discarded; the remaining systems were retained as WSLQ candidates and assigned quality grades. Following the grading from Shu et al. (2022) and He et al. (2025b), we set Grade C for score = 1, Grade B for 1 < score ≤ 2, and Grade A for score >2. This procedure yields 331 candidates, with Grade C accounting for 57%, Grade B 29%, and Grade A 14%; these are described in detail in Section 4.1.
4 Results
We first describe, in Section 4.1, the properties of LQCs. These objects were selected through photometric colour similarity and VI. The two LQCs for which spectra are available are summarised in Section 4.2 and are discussed in Appendix A. Section 4.3 then presents the characteristics of the 29 dual quasar candidates identified in this study.
4.1 Lensed quasar candidates
We identified a total of 331 LQCs without sufficient spectroscopic information, of which 45 are classified as Grade A, 98 as Grade B, and 188 as Grade C. A cross-match with existing lensed-quasar candidate catalogues yielded no counterparts, indicating that our candidates are new. These catalogues include: Dawes et al. (2022), He et al. (2023), Chan et al. (2020), Lemon et al. (2023), Andika et al. (2023), He et al. (2025b), and Bazzanini et al. (2025). Among these samples, only Bazzanini et al. (2025) contains systems with separations larger than 10"; the other catalogues do not overlap with the LQC because their separations are smaller than 10". Bazzanini et al. (2025) reports a promising candidate that may be a naked cusp lens system or a quadruple-image lens system; this object is not in the LQC but is in the QGC. The region between the two known quasars of this system lacks possible foreground objects, i.e. it does not satisfy criterion (i) in VI, and therefore it was rejected in VI. This also indicates that our working algorithm may miss multiple-image system candidates with N > 2, such as naked cusp configurations. Besides, we also checked the quasar pair catalogue J25 and found no overlap with the LQC, because J25 is a sample selected based on DESI DR1 spectroscopy, whereas the LQC is produced from a sample without sufficient DESI DR1 records. To select high-value samples whose projected positions lie near galaxy clusters, a cross-match was carried out between LQC and the three galaxy cluster catalogues (WEN_CAT, ZOU_CAT, and ERO_CAT) using a radius of two arcminutes, because this covers the region where strong lensing by galaxy clusters may occur. The distance was calculated between the centre of the quasar candidates group and the BCG of the galaxy cluster. The relatively large radius was chosen to improve the completeness of the cluster cross-match. One hundred and eight samples in LQC successfully matched at least one galaxy cluster in these three cluster catalogues, including 21 Grade A, 30 Grade B, and 57 Grade C samples. The LQC and the cross-match results are summarised in a catalogue, which is made available online2.
Figure 3 compares the distributions of the angular separation between each quasar group’s mean position and the BCG of the nearest matched cluster for the pre-VI QGC and the postVI LQC (within a 2′ radius). In QGC, the counts grow steadily towards larger radii, a pattern characteristic of chance projections in a fixed search aperture. After VI, LQC shows a clear excess at small separations and a relative deficit at large separations, which is not expected for chance projection. This shift indicates that the VI step preferentially retains systems centred on, or close to, plausible cluster BCGs.
Table C.1 lists the columns of our LQC catalogue: a unique group id (identical for all members belonging to the system), right ascension (RA), declination (Dec), VI Grade, maximum separation, number of quasar candidate members within the group, colour similarity, and cross-matching results with three galaxy cluster catalogues. In addition to the parameters shown in Table C.1, the online table also retains all columns provided by the original CatNorth.
Figure 4 displays five Grade A candidates for which the BCGs of the galaxy cluster are found within 30 arcsec of the mean position of quasar candidate groups. The reason we chose 30 arcsec here is that the core region of the galaxy cluster can provide more matter density to form strong lensing, so that these would be the more promising cases. Besides, Figure 5 presents images of 15 Grade A candidates randomly selected from the remainder of the sample. All pictures are drawn from the DESI Legacy Imaging Survey DR9. These examples illustrate that most Grade A systems exhibit promising lens configurations, and therefore constitute the high-priority targets for future confirmation.
Figure 6 compares the distributions of PM_SIG, PLX_SIG, and the colour W1 – W2, z – W1 of the LQC, four discoverable WSLQs, and a set of stars. PM_SIG ≡ μ/σμ, where μ is the total proper motion and σμ is its uncertainty (given by Gaia DR3; Gaia Collaboration 2023b), and PLX_SIG ≡ p/σp, where p is the parallax and σp is its uncertainty. The stars are drawn from Gaia DR3 (Gaia Collaboration 2023b) by requiring (i) an angular distance smaller than 3′ from the quasar candidate group and (ii) a stellar probability, Pstar > 0.99, assigned in the Discrete Source Classifier described by Gaia Collaboration (2023b). By restricting the comparison stars to a small cone around each candidate (here <3′) in the first criterion, we ensured a similar sky position, which mitigates spatially varying astrometric systematics that depend on the position (Lindegren et al. 2018; Gaia Collaboration 2021).
In Figure 6, the candidates occupy similar regions of parameter space as the known lenses, while the stars are clearly segregated. Specifically, in the left panel the candidates cluster at low PM_SIG and low PLX_SIG, as expected for extragalactic sources, whereas the stellar population forms a conspicuous sequence towards large astrometric values. In the right panel, LQC (W1 – W2, z – W1) colours trace the discoverable lensed quasar locus and remain well separated from the stellar region. The tight overlap with known lenses and significant separation from stars in these astrometric and colour diagnostics indicate that objects in our sample are high in purity in being real quasars.
Figure 7 displays the distributions of the Scolour, the Pan-STARRS1 g band apparent magnitude, the maximum image separation, and the photometric redshift of LQC, QGC, and discoverable quasar images in CatNorth from discoverable known lenses. Vertical dashed lines mark the information of four discoverable known lenses. The g band magnitude and redshift panels exhibit the information of all member quasar candidate images within each group of LQC and QGC; photometric redshifts are zph provided by CatNorth. Besides, we note that three of four known systems whose Pan-STARRS1 g band apparent magnitudes are plotted in the upper right panel of Figure 7 have shown magnitude variations of at least 1 magnitude; these are SDSS J1029+2623 (Fohlmeister et al. 2013), SDSS J1326+4806 (Shu et al. 2019), and SDSS J1004+4112 (Muñoz et al. 2022). As is shown in Figure 7, the Scolour distribution of LQC shifts towards a higher colour similarity compared to QGC. This is due to the removal of groups with a low colour similarity during automatic filtering and the favouring of colour consistency during VI.
Figure 7 also shows the shift of the redshift distribution of LQC towards the low end compared to the original QGC. This is for two reasons:
6728 groups rejected by their spectroscopic information tend to reside at higher redshift, because the spectroscopic catalogues employed reach fainter magnitudes than Gaia. The redshift distribution information of this part of the samples is plotted as the blue curve in the lower-right panel of Figure 7, so the surviving sample moves to lower redshift.
During VI, brighter quasars, which are more prevalent at lower redshift, are more readily accepted because they have a higher signal-to-noise ratio, further biasing the accepted sample towards lower redshift.
We employed simple models to predict the distribution of the maximum image separation angles of lensed quasars produced by galaxy cluster lenses, in which we adopted the ellipsoidal Navarro-Frenk-White (eNFW) (Navarro et al. 1997; Golse & Kneib 2002) and singular isothermal ellipsoid (SIE) models for the foreground lens. The method of generating this is described in the Appendix B. The resulting distribution (separation >10 arcsec) is plotted in the lower left panel of Figure 7. From this, we see that the peak of the separation distribution in the LQC sample is located at larger values than predicted by theory: both the SIE and eNFW models peak between 10 and 20 arcsec, whereas the LQC sample peaks between 20 and 30 arcsec. The fractions of systems with separations exceeding 20 arcsec are approximately 25%, 35%, and 73% for eNFW, SIE, and LQC, respectively. These numbers imply that the false positive rate of LQC candidates becomes substantial at the large-separation end.
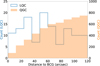 |
Fig. 3 Distribution of the angular separation between the mean sky position of each quasar group and the BCG of the nearest matched cluster (maximum allowed match radius 2′). Orange bars (right y axis) show all matches from the QGC (pre-VI), while blue bars (left y axis) show the corresponding results of visually inspected LQC (post-VI). |
 |
Fig. 4 DESI Legacy Imaging Surveys DR9 grz composite images of the five Grade A candidates for which at least one galaxy cluster is located within 30 arcsec of the quasar group centre. Each image spans 70 arcsec × 70 arcsec. White circles indicate the quasar candidate images, while red and blue circles mark the positions of the BCG matched in WEN_CAT and ZOU_CAT, respectively. |
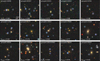 |
Fig. 5 DESI Legacy Imaging Surveys DR9 grz composite images of the first 15 Grade A candidates for which no galaxy cluster is matched within 30 arcsec of the quasar group centre. Each panel spans 70 arcsec × 70 arcsec. White circles mark the positions of the quasar candidate images. |
4.2 Candidates with spectra
We highlight two high-priority wide-separation candidates for which optical spectra are available (Figures 8 and 9). These figures are promoted here from the appendix for ease of reference; full descriptions of the spectral assessments and lens modelling are provided in Appendix A. Δθ denotes image separation.
4.2.1 J110121.67+060931.3 (Δθ = 14.14″)
DESI DR1 spectra of the two images show broadly consistent quasar features near z ≈ 0.83 (Figure 8). Imaging reveals a plausible foreground cluster: a BCG candidate from WEN_CAT and an eRASS1 X-ray source (Merloni et al. 2024) in the field. An SIE mass model centred at the X-ray peak (inverted yellow triangle in the right panel of Figure 8) reproduces the observed configuration, with a best fit of σv ≃ 608.6 km s−1, q ≃ 0.89, and φ ≃ 19.3°, and an Einstein radius of θE ≃ 7.19″; the enclosed mass is M(< θE) ≃ 7.4 × 10¹² M⊙. This is compatible with an X-ray-inferred cluster mass of M500 ≳ 2 × 10¹⁴ M⊙. We note that this X-ray source is classified as a ‘point-like’ source in the eRASS1 X-ray catalogues (Merloni et al. 2024), which makes the assumption that the X-ray emission corresponds to diffuse emission from the galaxy cluster dubious. In addition, we find that this object is also present in the catalogue of J25 and is flagged as a common quasar pair in J25. Further deep imaging and spectroscopy are needed to pin down the mass centroid and test for additional faint images. (For details, see Appendix A.2.1).
4.2.2 J150155.61-025728.4 (Δθ = 19.32″)
DESI DR1 spectrum yields zA = 1.6438 and zB = 1.6475 (Figure 9). The field likely hosts a foreground cluster or group about redshift 0.89. Plausible member galaxies are marked as white circles in the right panel of Figure 9. An SIE model centred on the z = 0.89 galaxy fits the observed geometry, with σv ≃ 989.0 kms−1, q ≃ 0.98, φ ≃ 29.2°, θE ≃ 9.36″, and M(< θE) ≃ 5.5 × 10¹³ M⊙. In addition, we do not find this object in the quasar pair catalogue of J25, because the projected physical distance of this object is larger than the upper limit on the projected physical distance adopted in J25. Confirmation requires deeper imaging to reveal additional lensing features. (Full details are provided in Appendix A.2.2).
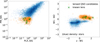 |
Fig. 6 Distribution of the properties of the LQC (orange plus signs), the eight images of the four discoverable known lenses in CatNorth (green cross symbols), and the stellar population located within 3′ of all LQC objects (blue density map). Left : two-dimensional distribution of total PM_SIG (the absolute value of the proper motion divided by its uncertainty) versus PLX_SIG (the absolute value of the parallax divided by its uncertainty). Right : two-dimensional distribution of the W1 - W 2 and z - W1, which is defined in AB magnitude system. We want to note that WISE photometry is calibrated in the Vega system. We converted to AB using mAB = mVega + Δm, with Δmw1,w2 = (2.699, 3.339), given by Cutri et al. (2013). |
 |
Fig. 7 Statistical properties of LQC, QGC, and discoverable known lenses. First panel: distribution of the colour similarity, Scolour (we note that the vertical marker line for SDSS J1004+4112 falls on top of the line for SDSS J1029+2623, which makes the line for SDSS J1029+2623 difficult to see). Second panel: distribution of the Pan-STARRS1 g band magnitudes for all quasar images contained in each quasar candidate group or known lensed quasar system. Third panel: distribution of the maximum image separation. The blue and green curves are the simulation results derived from the model in Appendix B, corresponding to different lens mass profile models. Fourth panel: distribution of the photometric redshift zph for all quasar images in each group or known system; the blue curve shows the zph distribution for those quasar candidate groups in the QGC that have sufficient spectroscopic matches. Dashed lines indicate the positions of the corresponding values for the four discoverable known lenses in CatNorth. Stepped black histograms trace the distributions for the QGC. |
4.3 Dual quasars
After the sub-sample with spectroscopic information had been purged of likely WSLQ systems, to select dual quasars, we imposed two additional constraints that the maximum projected separation between group members is less than 100 kpc and the velocity difference below 2000 kms−1, the velocity difference criterion simultaneously accounts for the peculiar-velocity difference of the dual quasars and the uncertainty in their broad-line spectroscopic redshifts J25. Those criteria yielded a set of 29 dual quasar candidates. The complete catalogue and the DESI legacy survey and Pan-STARRS1 images of each dual quasar candidate are also available online. Table C.2 lists the principal properties of these systems; the online table also contains all parameters provided by the original CatNorth, which are not exhibited in Table C.2 for brevity.
Figure 11 presents cut-outs from the DESI Legacy Imaging Survey DR9 of the 29 dual quasar candidates. Each panel spans the same angular extent of a side length of 30 arcsec. These image pairs either lack evidence of the presence of enough foreground matter to form strong gravitational lensing or have clearly different spectral redshift or features. Figures 10 displays the optical spectra of two randomly selected systems; the upper system and lower systems’ velocity differences are 661.56 km s−1 and 818.04 km s−1, and their projected separations are 95.01 kpc and 96.51 kpc, respectively.
J25 selected 1 842 quasar pairs from the DESI DR1 spectra. Cross-matching our 29 dual quasar candidate samples with J25 shows that 14 have counterparts in J25. The other 15 dual quasar candidates are not included in J25 because their spectra are not all from DESI DR1, i.e. the spectrum of at least one image of the system is from SDSS DR16. The final table records this information in the column labelled in_J25, which flags whether the sample is present in J25.
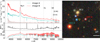 |
Fig. 8 Spectra and image of J110121.67+060931.3, the image separation is 14.14″. Left: DESI DR1 spectra of images A and B (smoothed for clarity; shaded bands show the unsmoothed noise); reference lines correspond to z = 0.8305. Right: DESI Legacy Surveys DR9 image; the white circle marks the BCG from WEN_CAT, and the yellow triangle the eRASS1 X-ray source. See Appendix A.2.1 for details. |
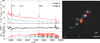 |
Fig. 9 Spectra and image of J150155.61-025728.4, the image separation is 19.32″. Left: DESI DR1 spectra of images A and B (smoothed for clarity; shaded bands show noise); vertical markers at z = 1.646. Right: DESI Legacy Surveys DR9 image. Data suggest that a galaxy group or cluster at z ≈ 0.89 may reside between the two quasar images; these plausible member galaxies are marked as white circles. See Appendix A.2.2 for details. |
5 Discussion
This section is arranged as follows. Section 5.1 discusses the completeness of the WSLQ candidate sample obtained in this work. Section 5.2 analyses the proportion of two-image systems within that sample. Section 5.3 introduces planned follow-up aimed at confirming the nature of these candidates and the potential scientific significance.
5.1 Completeness
The completeness of the known WSLQs in CatNorth is 50%. Four of the eight published systems are discoverable in CatNorth. Of the remaining four, only COOL J0542–2125 (Martinez et al. 2023) has its brightest image (photometric information comes from the DESI Legacy Imaging Survey DR9, see Table 1) detected in CatNorth, whereas SDSS J2222+2745 (Dahle et al. 2013), SDSS J0909+4449 (Shu et al. 2018), and COOL J0335–1927 (Napier et al. 2023) lack any counterparts in CatNorth. The principal reason is that the magnitudes of their lensed images lie around or below the limiting magnitude of CatNorth. In addition, the performance of the four discoverable WSLQs within our candidate-selection workflow indicates that the pre-VI stages, namely the quasar group finder and the automatic screening, are consistent with a high completeness for potential lensed quasars present in CatNorth, albeit based on only four systems.
5.2 Proportion of lensed quasar candidates with two images
Among the 331 LQC systems identified in this work, only two display three images, whereas the remaining 329 have two image counterparts in CatNorth. This proportion of two-image systems is much higher than the proportion of doubles predicted by theoretical simulations (see, e.g. Oguri & Keeton 2004), and is also far higher than the observed proportion of doubles in the set of eight published WSLQs, where only SDSS J1326+ 4806 is a double image system. Important reasons for the difference are the restricted limiting magnitude of Gaia and CatNorth and the non-zero probability that the CatNorth construction process removed one or more true quasar images. These factors likewise explain why three of the four discoverable known lenses (the ones with N≥3) present in CatNorth, i.e. J1004 + 4112, SDSSJ1029 + 2623, and GraLJ165105.3–041725, which possess four, three, and four images respectively, appear with only two image counterparts recorded in CatNorth. Consequently, any as-yet-unknown positive systems that can be detected in CatNorth are likely to be represented by no more than two images. In addition, another possible factor is that criterion (i) in VI may cause us to miss three-image systems of the naked cusp configuration in our final candidate sample, which would finally tend to decrease the fraction of N>2 image systems.
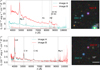 |
Fig. 10 Spectra and images of two dual quasar candidates. In each row the left sub-panel shows the spectra and the right sub-panel presents the DESI Legacy Imaging Surveys DR9 grz composite image. Top : dual quasar candidate of groupid = 9333. Spectrum of image A is from SDSS DR16 and that of image B is from DESI DR1; automated spectral redshifts are zA = 0.7239 and zB = 0.7201. The angular separation is 13.17 arcsec, corresponding to a projected distance of 95.01 kpc; the velocity difference is 661.56 km s−1. Bottom : dual quasar candidate of groupid = 26644. Spectrum of image A derives from DESI DR1 and image B from SDSS DR16 with automated spectral redshifts zA = 2.3028 and zB = 2.2938. The angular separation is 11.61 arcsec, giving a projected distance of 96.51 kpc; the velocity difference is 818.04 km s−1. |
Eight known WSLQs and their basic properties.
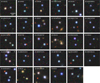 |
Fig. 11 DESI Legacy Imaging Surveys DR9 grz composite images of the 29 dual quasar candidate systems. Each cut-out spans 30 arcsec × 30 arcsec. White circles mark the positions of the quasar candidate images. |
5.3 Follow-up and scientific significance
We plan to carry out follow-up confirmation of the strong lensing candidates identified in this study, employing distinct verification strategies tailored to each class of candidate. For the high-quality LQCs, especially those that can be matched with galaxy clusters in Grade A and the samples that already have spectral information, we plan to request observing time on the Canada-France-Hawaii Telescope (CFHT) and the 200-inch Hale Telescope (P200) to follow up on them. For the remaining LQCs, we shall cross-match with DESI future release spectroscopy, and - as public releases expand - Euclid imaging and slitless spectroscopy, future survey observations on the 4-metre Multi-Object Spectroscopic Telescope (4MOST), and the forthcoming CSST imaging and slitless spectroscopy wide-field surveys when data is available.
If confirmed, these candidates would offer substantial scientific value. For instance, within the subset in which the BCG of a galaxy cluster lies within 30 arcsec of the quasar-group centre (shown in Figure 4), the rightmost panel of Figure 4 shows the candidate with groupid = 37148, whose image separation is 37.59 arcsec, exceeding that of all currently known WSLQs. If genuine, its large separation would provide a uniquely valuable case for probing the three-dimensional structure of quasars (Misawa et al. 2016). As another example, Appendix A.2.1 discusses a candidate in which the mass centroid and luminosity centroid may be offset; if verified, this system would be highly informative for constraining the mass distribution of this irregular foreground galaxy cluster.
6 Summary
In this work, the catalogue-based searching strategy of He et al. (2023) was applied to CatNorth, a high-purity and highly complete quasar candidate catalogue derived from Gaia DR3, to search for WSLQ candidates. The analysis delivered and released two samples: a set of WSLQ candidates and a set of dual quasar candidates. The procedure consisted of three steps. (i) The group finder was run on the 1 545 514 quasars and generated about 24000 quasar groups. (ii) These groups were filtered by their colour properties or by spectra retrieved from SDSS DR16 and DESI DR1. This operation reduced the sample to about 14000 groups. (iii) Visual inspection assigned scores and categories to the surviving systems and removed those that were very likely to be spurious.
The resulting WSLQ candidate sample contains two systems for which spectroscopic data are available and 331 systems selected solely on the basis of colour and imaging information in the absence of adequate spectroscopy. The two systems with spectroscopic records have been subjected to spectral analysis and preliminary lens modelling. The 331 colour-selected candidates were scored and placed into three classes: 45 Grade A, 98 Grade B, and 188 Grade C. The complete sample has been crossmatched with roughly 1.9 million galaxy clusters and groups. 108 samples successfully matched at least one galaxy cluster within 2 arcmin in three cluster catalogues that we used, and the result is included in the publicly available table.
Applying the additional criteria of a velocity difference of Δv < 2000 km s−1 and a projected separation smaller than 100 kpc on the remaining quasar candidate groups whose spectra are available yields a catalogue of 29 dual quasar candidates. Their images show no morphology or spectral features characteristic of strong lensing, but their small line-of-sight velocity separations suggest that they satisfy conventional criteria for the dual quasar.
We plan to obtain supplementary spectroscopy and deep imaging for the candidates identified in this study using CFHT, P200, and the DESI future release, while the ongoing and forthcoming wide-field surveys with Euclid and CSST will aid the confirmation of lensed quasars in the long term. Spectroscopic observations will refine the sample by confirming plausible strong lens systems and discarding obvious contaminants, whereas deeper imaging will reveal additional strong lensing indicators and impose tighter constraints on the mass distribution of the foreground deflectors. Together, these data are essential for establishing the physical nature of the candidates.
In summary, we have implemented a robust pipeline that starts from the quasar candidate catalogue CatNorth and produces a catalogue of WSLQ candidates together with a catalogue of dual quasar candidates. Lens modelling has been carried out for the two high-quality systems whose spectroscopic information is available. Follow-up spectroscopy and deep imaging of the most promising candidates are planned to confirm new WSLQs based on these samples in the near future. And, as part of our ClUsteR strong Lens modellIng for the Next-Generation observations (CURLING) programme (Xie et al. 2024, 2025), the newly confirmed WSLQs will be used to constrain the properties of dark matter and dark energy by employing our advanced pixelised lens-modelling technique. This study also demonstrates that the proposed automatic procedure can markedly compress a very large parent sample of quasar candidates while maintaining high completeness, an ability that will be invaluable for efficiently selecting WSLQs in the next-generation deep, wide-field imaging surveys.
Data availability
Tables C.1 and C.2 are available at the CDS via https://cdsarc.cds.unistra.fr/viz-bin/cat/J/A+A/710/A180.
Acknowledgements
We thank astropy, HEALPix, pandas, and lenstronomy for providing convenient and reliable Python packages. We thank Yiping Shu for insightful discussions. Z.H. acknowledges support from the National Natural Science Foundation of China (Grant No. 12403104). N.L. acknowledges the support of the science research grants from the China Manned Space Project (No. CMS-CSST-2021-A01) and the CAS Project for Young Scientists in Basic Research (No. YSBR-062). The Pan-STARRS1 Surveys (PS1) and the PS1 public science archive have been made possible through contributions by the Institute for Astronomy, the University of Hawaii, the Pan-STARRS Project Office, the Max-Planck Society and its participating institutes, the Max Planck Institute for Astronomy, Heidelberg and the Max Planck Institute for Extraterrestrial Physics, Garching, The Johns Hopkins University, Durham University, the University of Edinburgh, the Queen’s University Belfast, the Harvard-Smithsonian Center for Astrophysics, the Las Cumbres Observatory Global Telescope Network Incorporated, the National Central University of Taiwan, the Space Telescope Science Institute, the National Aeronautics and Space Administration under Grant No. NNX08AR22G issued through the Planetary Science Division of the NASA Science Mission Directorate, the National Science Foundation Grant No. AST-123 8877, the University of Maryland, Eotvos Lorand University (ELTE), the Los Alamos National Laboratory, and the Gordon and Betty Moore Foundation. This research used data obtained with the Dark Energy Spectroscopic Instrument (DESI). DESI construction and operations is managed by the Lawrence Berkeley National Laboratory. This material is based upon work supported by the U.S. Department of Energy, Office of Science, Office of High-Energy Physics, under Contract No. DE-AC02-05CH11231, and by the National Energy Research Scientific Computing Center, a DOE Office of Science User Facility under the same contract. Additional support for DESI was provided by the U.S. National Science Foundation (NSF), Division of Astronomical Sciences under Contract No. AST-0950945 to the NSF’s National Optical-Infrared Astronomy Research Laboratory; the Science and Technology Facilities Council of the United Kingdom; the Gordon and Betty Moore Foundation; the Heising-Simons Foundation; the French Alternative Energies and Atomic Energy Commission (CEA); the National Council of Humanities, Science and Technology of Mexico (CONAHCYT); the Ministry of Science and Innovation of Spain (MICINN), and by the DESI Member Institutions: www.desi.lbl.gov/collaborating-institutions. The DESI collaboration is honored to be permitted to conduct scientific research on I’oligam Du’ag (Kitt Peak), a mountain with particular significance to the Tohono O’odham Nation. Any opinions, findings, and conclusions or recommendations expressed in this material are those of the author(s) and do not necessarily reflect the views of the U.S. National Science Foundation, the U.S. Department of Energy, or any of the listed funding agencies. The DESI Legacy Imaging Surveys consist of three individual and complementary projects: the Dark Energy Camera Legacy Survey (DECaLS), the Beijing-Arizona Sky Survey (BASS), and the Mayall z-band Legacy Survey (MzLS). DECaLS, BASS and MzLS together include data obtained, respectively, at the Blanco telescope, Cerro Tololo Inter-American Observatory, NSF’s NOIRLab; the Bok telescope, Steward Observatory, University of Arizona; and the Mayall telescope, Kitt Peak National Observatory, NOIRLab. NOIRLab is operated by the Association of Universities for Research in Astronomy (AURA) under a cooperative agreement with the National Science Foundation. Pipeline processing and analyses of the data were supported by NOIRLab and the Lawrence Berkeley National Laboratory (LBNL). Legacy Surveys also uses data products from the Near-Earth Object Wide-field Infrared Survey Explorer (NEOWISE), a project of the Jet Propulsion Laboratory/California Institute of Technology, funded by the National Aeronautics and Space Administration. Legacy Surveys was supported by: the Director, Office of Science, Office of High Energy Physics of the U.S. Department of Energy; the National Energy Research Scientific Computing Center, a DOE Office of Science User Facility; the U.S. National Science Foundation, Division of Astronomical Sciences; the National Astronomical Observatories of China, the Chinese Academy of Sciences and the Chinese National Natural Science Foundation. LBNL is managed by the Regents of the University of California under contract to the U.S. Department of Energy. This publication makes use of data products from the Wide-field Infrared Survey Explorer, which is a joint project of the University of California, Los Angeles, and the Jet Propulsion Laboratory/California Institute of Technology, funded by the National Aeronautics and Space Administration. This work has made use of data from the European Space Agency (ESA) mission Gaia (https://www.cosmos.esa.int/gaia), processed by the Gaia Data Processing and Analysis Consortium (DPAC, https://www.cosmos.esa.int/web/gaia/dpac/consortium). Funding for the DPAC has been provided by national institutions, in particular the institutions participating in the Gaia Multilateral Agreement. Funding for the Sloan Digital Sky Survey IV has been provided by the Alfred P. Sloan Foundation, the U.S. Department of Energy Office of Science, and the Participating Institutions. SDSS-IV acknowledges support and resources from the Center for High Performance Computing at the University of Utah. The SDSS website is www.sdss4.org. SDSS-IV is managed by the Astrophysical Research Consortium for the Participating Institutions of the SDSS Collaboration including the Brazilian Participation Group, the Carnegie Institution for Science, Carnegie Mellon University, Center for Astrophysics | Harvard & Smithsonian, the Chilean Participation Group, the French Participation Group, Instituto de Astrofísica de Canarias, The Johns Hopkins University, Kavli Institute for the Physics and Mathematics of the Universe (IPMU) / University of Tokyo, the Korean Participation Group, Lawrence Berkeley National Laboratory, Leibniz Institut für Astrophysik Potsdam (AIP), Max-Planck-Institut für Astronomie (MPIA Heidelberg), Max-Planck-Institut für Astrophysik (MPA Garching), Max-Planck-Institut für Extraterrestrische Physik (MPE), National Astronomical Observatories of China, New Mexico State University, New York University, University of Notre Dame, Observatário Nacional / MCTI, The Ohio State University, Pennsylvania State University, Shanghai Astronomical Observatory, United Kingdom Participation Group, Universidad Nacional Autónoma de México, University of Arizona, University of Colorado Boulder, University of Oxford, University of Portsmouth, University of Utah, University of Virginia, University of Washington, University of Wisconsin, Vanderbilt University, and Yale University.
References
- Ahumada, R., Allende Prieto, C., Almeida, A., et al. 2020, ApJS, 249, 3 [NASA ADS] [CrossRef] [Google Scholar]
- Allen, S. W., Evrard, A. E., & Mantz, A. B. 2011, ARA&A, 49, 409 [Google Scholar]
- Allgood, B., Flores, R. A., Primack, J. R., et al. 2006, MNRAS, 367, 1781 [NASA ADS] [CrossRef] [Google Scholar]
- Andika, I. T., Suyu, S. H., Cañameras, R., et al. 2023, A&A, 678, A103 [NASA ADS] [CrossRef] [EDP Sciences] [Google Scholar]
- Anguita, T., Schmidt, R. W., Turner, E. L., et al. 2008, A&A, 480, 327 [NASA ADS] [CrossRef] [EDP Sciences] [Google Scholar]
- Bayliss, M. B., Sharon, K., Acharyya, A., et al. 2017, ApJ, 845, L14 [Google Scholar]
- Bazzanini, L., Angora, G., Scialpi, M., et al. 2025, A&A, 698, A29 [NASA ADS] [CrossRef] [EDP Sciences] [Google Scholar]
- Birrer, S., & Amara, A. 2018, Phys. Dark Universe, 22, 189 [NASA ADS] [CrossRef] [Google Scholar]
- Birrer, S., Shajib, A., Gilman, D., et al. 2021, J. Open Source Softw., 6, 3283 [NASA ADS] [CrossRef] [Google Scholar]
- Blanton, M. R., Bershady, M. A., Abolfathi, B., et al. 2017, AJ, 154, 28 [Google Scholar]
- Böhringer, H., Schuecker, P., Guzzo, L., et al. 2004, A&A, 425, 367 [NASA ADS] [CrossRef] [EDP Sciences] [Google Scholar]
- Boylan-Kolchin, M., Ma, C.-P., & Quataert, E. 2008, MNRAS, 383, 93 [Google Scholar]
- Bulbul, E., Liu, A., Kluge, M., et al. 2024, A&A, 685, A106 [NASA ADS] [CrossRef] [EDP Sciences] [Google Scholar]
- Chambers, K. C., Magnier, E. A., Metcalfe, N., et al. 2016, arXiv e-prints [arXiv:1612.05560] [Google Scholar]
- Chan, J. H. H., Suyu, S. H., Sonnenfeld, A., et al. 2020, A&A, 636, A87 [NASA ADS] [CrossRef] [EDP Sciences] [Google Scholar]
- Child, H. L., Habib, S., Heitmann, K., et al. 2018, ApJ, 859, 55 [NASA ADS] [CrossRef] [Google Scholar]
- Cloonan, A. P., Khullar, G., Napier, K. A., et al. 2025, ApJ, 987, 194 [Google Scholar]
- Cutri, R. M., Wright, E. L., Conrow, T., et al. 2013, Explanatory Supplement to the AllWISE Data Release Products, Explanatory Supplement to the AllWISE Data Release Products, by R. M. Cutri et al. [Google Scholar]
- Dahle, H., Gladders, M. D., Sharon, K., et al. 2013, ApJ, 773, 146 [NASA ADS] [CrossRef] [Google Scholar]
- Dawes, C., Storfer, C., Huang, X., et al. 2022, Finding Multiply-Lensed and Binary Quasars in the DESI Legacy Imaging Surveys [arXiv:2208.06356] [astro-ph] [Google Scholar]
- Dawson, K. S., Schlegel, D. J., Ahn, C. P., et al. 2013, AJ, 145, 10 [Google Scholar]
- Dawson, K. S., Kneib, J.-P., Percival, W. J., et al. 2016, AJ, 151, 44 [Google Scholar]
- De Rosa, A., Vignali, C., Bogdanovic, T., et al. 2019, New A Rev., 86, 101525 [NASA ADS] [CrossRef] [Google Scholar]
- DESI Collaboration (Aghamousa, A., et al.) 2016, The DESI Experiment Part I: Science, Targeting, and Survey Design [Google Scholar]
- DESI Collaboration (Abareshi, B., et al.) 2022, AJ, 164, 207 [NASA ADS] [CrossRef] [Google Scholar]
- DESI Collaboration 2023, Data for figures and tables in “Validation of the Scientific Program for the Dark Energy Spectroscopic Instrument” [Google Scholar]
- DESI Collaboration (Abdul-Karim, M., et al.) 2025, Data Release 1 of the Dark Energy Spectroscopic Instrument [Google Scholar]
- Dey, A., Schlegel, D. J., Lang, D., et al. 2019, AJ, 157, 168 [Google Scholar]
- Diemer, B. 2018, ApJS, 239, 35 [NASA ADS] [CrossRef] [Google Scholar]
- Ding, J., Dalal, R., Strauss, M., et al. 2023, in American Astronomical Society Meeting Abstracts, 241, American Astronomical Society Meeting Abstracts, 460.24 [Google Scholar]
- Ebeling, H., Edge, A. C., Mantz, A., et al. 2010, MNRAS, 407, 83 [NASA ADS] [CrossRef] [Google Scholar]
- Eisenstein, D. J., Weinberg, D. H., Agol, E., et al. 2011, AJ, 142, 72 [Google Scholar]
- Evrard, A. E., Bialek, J., Busha, M., et al. 2008, ApJ, 672, 122 [Google Scholar]
- Fian, C., Muñoz, J. A., Jiménez-Vicente, J., et al. 2024, A&A, 689, A129 [NASA ADS] [CrossRef] [EDP Sciences] [Google Scholar]
- Fohlmeister, J., Kochanek, C. S., Falco, E. E., et al. 2013, ApJ, 764, 186 [NASA ADS] [CrossRef] [Google Scholar]
- Foreman-Mackey, D., Hogg, D. W., Lang, D., & Goodman, J. 2013, PASP, 125, 306-312 [Google Scholar]
- Fu, Y., Wu, X.-B., Li, Y., et al. 2024, ApJS, 271, 54 [NASA ADS] [CrossRef] [Google Scholar]
- Gaia Collaboration (Brown, A. G. A., et al.) 2021, A&A, 649, A1 [NASA ADS] [CrossRef] [EDP Sciences] [Google Scholar]
- Gaia Collaboration (Bailer-Jones, C. A. L., et al.) 2023a, A&A, 674, A41 [NASA ADS] [CrossRef] [EDP Sciences] [Google Scholar]
- Gaia Collaboration (Vallenari, A., et al.) 2023b, A&A, 674, A1 [NASA ADS] [CrossRef] [EDP Sciences] [Google Scholar]
- Golse, G., & Kneib, J. P. 2002, A&A, 390, 821 [NASA ADS] [CrossRef] [EDP Sciences] [Google Scholar]
- Gorski, K. M., Wandelt, B. D., Hansen, F. K., Hivon, E., & Banday, A. J. 1999, [arXiv:astro-ph/9905275] [Google Scholar]
- He, Z., Li, N., Cao, X., et al. 2023, A&A, 672, A123 [NASA ADS] [CrossRef] [EDP Sciences] [Google Scholar]
- He, Z., Chen, Q., Deng, L., et al. 2025a, A&A, 695, A76 [NASA ADS] [CrossRef] [EDP Sciences] [Google Scholar]
- He, Z., Li, R., Shu, Y., et al. 2025b, ApJ, 981, 168 [Google Scholar]
- Hogg, D. W. 2000 [arXiv:astro-ph/9905116] [Google Scholar]
- Hopkins, P. F., Bahcall, N. A., & Bode, P. 2005, ApJ, 618, 1 [NASA ADS] [CrossRef] [Google Scholar]
- Hutsemékers, D., Sluse, D., Savic, D., & Richards, G. T. 2023, A&A, 672, A45 [NASA ADS] [CrossRef] [EDP Sciences] [Google Scholar]
- Inada, N., Oguri, M., Pindor, B., et al. 2003, Nature, 426, 810 [NASA ADS] [CrossRef] [Google Scholar]
- Inada, N., Oguri, M., Keeton, C. R., et al. 2005, PASJ, 57, L7 [NASA ADS] [Google Scholar]
- Inada, N., Oguri, M., Morokuma, T., et al. 2006, ApJ, 653, L97 [Google Scholar]
- Jing, L., Chen, Q., Deng, Z., et al. 2025 [arXiv:2505.03103] [Google Scholar]
- Kochanek, C. S. 2020, MNRAS, 493, 1725 [NASA ADS] [CrossRef] [Google Scholar]
- Koulouridis, E., Clerc, N., Sadibekova, T., et al. 2021, A&A, 652, A12 [NASA ADS] [CrossRef] [EDP Sciences] [Google Scholar]
- Lauer, T. R., Postman, M., Strauss, M. A., Graves, G. J., & Chisari, N. E. 2014, ApJ, 797, 82 [Google Scholar]
- Lemon, C., Anguita, T., Auger-Williams, M. W., et al. 2023, MNRAS, 520, 3305 [NASA ADS] [CrossRef] [Google Scholar]
- Levi, M., Bebek, C., Beers, T., et al. 2013, The DESI Experiment, a whitepaper for Snowmass 2013 [Google Scholar]
- Lindegren, L., Hernández, J., Bombrun, A., et al. 2018, A&A, 616, A2 [NASA ADS] [CrossRef] [EDP Sciences] [Google Scholar]
- Lyke, B. W., Higley, A. N., McLane, J. N., et al. 2020, ApJS, 250, 8 [NASA ADS] [CrossRef] [Google Scholar]
- Marocco, F., Eisenhardt, P. R. M., Fowler, J. W., et al. 2021, ApJS, 253, 8 [Google Scholar]
- Martin, G., Kaviraj, S., Devriendt, J. E. G., Dubois, Y., & Pichon, C. 2018, MNRAS, 480, 2266 [Google Scholar]
- Martinez, M. N., Napier, K. A., Cloonan, A. P., et al. 2023, ApJ, 946, 63 [NASA ADS] [CrossRef] [Google Scholar]
- Marulli, F., Veropalumbo, A., Sereno, M., et al. 2018, A&A, 620, A1 [NASA ADS] [CrossRef] [EDP Sciences] [Google Scholar]
- Merloni, A., Lamer, G., Liu, T., et al. 2024, A&A, 682, A34 [NASA ADS] [CrossRef] [EDP Sciences] [Google Scholar]
- Misawa, T., Inada, N., Ohsuga, K., et al. 2013, AJ, 145, 48 [Google Scholar]
- Misawa, T., Inada, N., Oguri, M., et al. 2014, ApJ, 794, L20 [Google Scholar]
- Misawa, T., Saez, C., Charlton, J. C., et al. 2016, ApJ, 825, 25 [Google Scholar]
- Motta, V., Mediavilla, E., Falco, E., & Muñoz, J. A. 2012, ApJ, 755, 82 [NASA ADS] [CrossRef] [Google Scholar]
- Muñoz, J. A., Kochanek, C. S., Fohlmeister, J., et al. 2022, ApJ, 937, 34 [CrossRef] [Google Scholar]
- Napier, K., Gladders, M. D., Sharon, K., et al. 2023, ApJ, 954, L38 [NASA ADS] [CrossRef] [Google Scholar]
- Navarro, J. F., Frenk, C. S., & White, S. D. M. 1997, ApJ, 490, 493 [Google Scholar]
- Oguri, M., & Keeton, C. R. 2004, ApJ, 610, 663 [Google Scholar]
- Oguri, M., Ofek, E. O., Inada, N., et al. 2008, ApJ, 676, L1-L4 [Google Scholar]
- Oguri, M., Rusu, C. E., & Falco, E. E. 2014, MNRAS, 439, 2494 [Google Scholar]
- Pfeifle, R. W., Weaver, K. A., Secrest, N. J., Rothberg, B., & Patton, D. R. 2025, ApJS, 281, 25 [Google Scholar]
- Planck Collaboration VI. 2020, A&A, 641, A6 [NASA ADS] [CrossRef] [EDP Sciences] [Google Scholar]
- Plionis, M., Barrow, J. D., & Frenk, C. S. 1991, MNRAS, 249, 662 [Google Scholar]
- Reiprich, T. H., & Böhringer, H. 2002, ApJ, 567, 716 [Google Scholar]
- Richards, G. T., Fan, X., Newberg, H. J., et al. 2002, AJ, 123, 2945 [NASA ADS] [CrossRef] [Google Scholar]
- Robertson, A., Smith, G. P., Massey, R., et al. 2020, MNRAS, 495, 3727 [NASA ADS] [CrossRef] [Google Scholar]
- Roedig, C., Krolik, J. H., & Miller, M. C. 2014, ApJ, 785, 115 [NASA ADS] [CrossRef] [Google Scholar]
- Romero, G. E., Vila, G. S., & Pérez, D. 2016, A&A, 588, A125 [NASA ADS] [CrossRef] [EDP Sciences] [Google Scholar]
- Rosati, P., Borgani, S., & Norman, C. 2002, ARA&A, 40, 539 [Google Scholar]
- Sehgal, N., Addison, G., Battaglia, N., et al. 2013, ApJ, 767, 38 [NASA ADS] [CrossRef] [Google Scholar]
- Sharon, K., Bayliss, M. B., Dahle, H., et al. 2017, ApJ, 835, 5 [NASA ADS] [CrossRef] [Google Scholar]
- Sharon, K., Bayliss, M. B., Dahle, H., et al. 2020, ApJS, 247, 12 [CrossRef] [Google Scholar]
- Shen, Y., Hall, P. B., Horne, K., et al. 2019, ApJS, 241, 34 [NASA ADS] [CrossRef] [Google Scholar]
- Shu, Y., Marques-Chaves, R., Evans, N. W., & Pérez-Fournon, I. 2018, MNRAS, 481, L136 [Google Scholar]
- Shu, Y., Koposov, S. E., Evans, N. W., et al. 2019, MNRAS, 489, 4741 [Google Scholar]
- Shu, Y., Cañameras, R., Schuldt, S., et al. 2022, A&A, 662, A4 [NASA ADS] [CrossRef] [EDP Sciences] [Google Scholar]
- Sluse, D., Hutsemékers, D., Courbin, F., Meylan, G., & Wambsganss, J. 2012, A&A, 544, A62 [NASA ADS] [CrossRef] [EDP Sciences] [Google Scholar]
- Sonnenfeld, A. 2021, A&A, 656, A153 [NASA ADS] [CrossRef] [EDP Sciences] [Google Scholar]
- Stern, D., Djorgovski, S. G., Krone-Martins, A., et al. 2021, ApJ, 921, 42 [NASA ADS] [CrossRef] [Google Scholar]
- Suto, D., Kitayama, T., Nishimichi, T., Sasaki, S., & Suto, Y. 2016, PASJ, 68 [Google Scholar]
- Suyu, S. H., Treu, T., Hilbert, S., et al. 2014, ApJ, 788, L35 [NASA ADS] [CrossRef] [Google Scholar]
- Walsh, D., Carswell, R. F., & Weymann, R. J. 1979, Nature, 279, 381 [Google Scholar]
- Wen, Z. L., & Han, J. L. 2024, ApJS, 272, 39 [NASA ADS] [CrossRef] [Google Scholar]
- Wong, K. C., Suyu, S. H., Chen, G. C. F., et al. 2020, MNRAS, 498, 1420 [Google Scholar]
- Xie, Y., Shan, H., Li, N., et al. 2024, MNRAS, 531, 1179 [Google Scholar]
- Xie, Y., Shan, H., Shu, Y., et al. 2025, MNRAS, 544, 708 [Google Scholar]
- York, D. G., Adelman, J., Anderson, Jr., J. E., et al. 2000, AJ, 120, 1579 [NASA ADS] [CrossRef] [Google Scholar]
- Zhang, Y., Jeltema, T., Hollowood, D. L., et al. 2019, MNRAS, 487, 2578 [NASA ADS] [CrossRef] [Google Scholar]
- Zou, H., Zhou, X., Fan, X., et al. 2017, PASP, 129, 064101 [CrossRef] [Google Scholar]
- Zou, H., Gao, J., Xu, X., et al. 2021, ApJS, 253, 56 [NASA ADS] [CrossRef] [Google Scholar]
When multiple spectra were available for a single member, we preferentially retained the DESI measurement, for which the deeper limiting magnitude usually provides a superior signal-to-noise ratio.
K-correction is neglected here; for galaxy clusters with kT=0.5-10 keV at z = 0.25, the K-correction affects the luminosity by 0 to about 13% (Böhringer et al. 2004).
Appendix A Candidates with spectrum
Spectroscopic observations of quasars are invaluable for excluding systems that are not real strong lenses. Microlensing (Sluse et al. 2012; Motta et al. 2012; Hutsemékers et al. 2023), variability in the broad emission lines and continuum (Shen et al. 2019), differential reddening, differences in sight-line (Misawa et al. 2016) can introduce differences between the spectra of multiple images. Nevertheless, the spectra of confirmed strong-lens systems are, in an overall sense, highly similar, and any systematic discrepancies can be attributed to the effects listed above. This section discusses two systems with spectroscopical information that are plausible strong lenses and presents their lens modelling process. A summary of the properties of these two samples is provided in Section 4.2 of the main text. Section A.1 outlines the modelling methodology, whereas Section A.2 describes the information of two candidate strongly lensed quasars and the corresponding modelling results.
Appendix A.1 Lens modelling methodology
In our lens modelling methodology the foreground lens is represented with a SIE mass profile. The model contains three free parameters: the velocity dispersion σv, the axis ratio q, and the position angle φ of the major axis of the mass contour. Deflection angles and image positions are computed with the lenstronomy package (Birrer & Amara 2018; Birrer et al. 2021), and the parameter posterior is sampled by the Markov chain Monte Carlo ensemble sampler emcee (Foreman-Mackey et al. 2013). The likelihood is built from the positional offsets between the model quasar image and the observations,
 (A.1)
(A.1)
where  and ri are the modelled and observed positions of the ith image, and σi is the corresponding astrometric uncertainty.
The SIE profile offers the advantage of a small parameter set, which limits degeneracies when only a few image positions are available. Its simplicity, however, makes it an imperfect description of cluster scale halos, whose central density profiles are usually flatter and often require multiple subhalos for an accurate modelling (Sharon et al. 2020). But given the limited observational constraints presently available for the candidates discussed here, the SIE model provides a useful first approximation; more elaborate mass models should be adopted once deeper imaging and additional spectroscopy become accessible.
Appendix A.2 Samples
Appendix A.2.1 J110121.67+060931.3
Two quasar images in this system have similar spectral features, and a foreground galaxy cluster acts as a plausible deflector. The spectra and DESI Legacy Imaging Surveys DR9 image of this system are displayed in Figure 8, left and right panels respectively. Images A and B are separated by 14.14 arcsec. In the uppermost panel of the spectral figure, the spectrum is convolved with a scale kernel whose width is five pixels for smoothing. Both spectra originate from DESI-DR1, automatic DESI-DR1 redshift fits yield zA = 0.8313 ± 0.0001 and zB = 0.8297 ± 0.0002. The spectrum of image A is of lower quality and exhibits numerous spurious “absorption” features with zero signal-to-noise (for example near 5907 Â), introduced when zero-filled regions were convolved with neighbouring valid data. Image B appears slightly redder than image A, and the continuum flux ratio varies with wavelength; these differences may arise from differential reddening, microlensing, and intervening line-of-sight structure.
A foreground galaxy cluster is matched in WEN_CAT, and an X-ray signal is recorded in eRASS1 Main catalogue (Merloni et al. 2024), which is the possible X-ray emission from the hot gas of this galaxy cluster. The BCG is marked by the white circle north of the quasar images in Figure 8. WEN_CAT lists a photometric redshift zph = 0.2503 and M500 = 5.0 × 10¹³ M⊙ of this cluster. A recorded X-ray signal from the eRASS1 Main catalogue (Merloni et al. 2024) is located at the yellow triangle in Figure 8. The position uncertainty of this X-ray signal in eRASS1 Main catalogue is 2.41 arcsec; the offset between this X-ray signal and image A and image B is 4.264 arcsec, so the X-ray emission may also originate from quasar image A. The 0.2-2.3 keV flux of this X-ray signal is 1.86 × 10⁻¹³ erg s−1 cm−2. Adopting this value as a lower limit for the galaxy cluster, with the assumption that the redshift equals 0.2503, yields a luminosity lower limit of 2.95 × 1043 erg s−1, using the empirical mass luminosity relation of Reiprich & Böhringer (2002) for the 0.1-2.4 keV band gives M500 ≳ 2 × 10¹⁴ M⊙.3
Lens modelling of this system follows the methodology outlined in Section A.1. Two centring hypotheses are examined. In the first, the BCG is adopted as the centre of the mass model; under this assumption a configuration with only two quasar images cannot be reconciled with the observations, and a search of the DESI Legacy Imaging Surveys DR9 image reveals no additional possible quasar images with similar colour in the regions where three- or four-image configurations would place them. In the second hypothesis the centre of the mass distribution is taken to coincide with the peak of the X-ray emission. Under this assumption the observed quasar images are well reproduced by the SIE model. The best fit gives σv = 608.58 km s−1, q = 0.89, and φ = 19.32°. The left panel of Figure A.1 displays the corresponding lens model.
Following the galaxy cluster mass estimation framework used in Shu et al. (2019), we estimate the mass of the second lens model assumption as follows, and found that the mass inferred based on X-ray observation is compatible with the lens model and is sufficient to generate the observed lensed quasar images separation. The Einstein radius of this lens model is 7.187 arcsec, which implies an enclosed mass of 7.394 × 10¹² M⊙ within Einstein radius. For an NFW halo with a lower mass limit of 2 × 10¹⁴ M⊙ (given by X-ray observation in this sample) and concentration 3 ≤ c ≤ 8, the projected mass within R < 7.187 arcsec has a lower mass limit which lies in the range (2.31-5.33) × 1012 M⊙, consistent with the value derived from the lens model. If the estimation M500 = 5 × 10¹³ M⊙ provided by WEN_CAT is adopted, where the M500 is given by the richness, the projected mass inside the same radius is insufficient to produce an Einstein radius as large as 7.187 arcsec.
We want to note that all eight known WSLQs can be satisfactorily fit with cluster mass centroids that nearly coincide with the BCG. Nevertheless, a non-negligible displacement between the cluster centre of mass and the BCG is still permitted by the data, leaving the second lens modelling hypothesis (assuming the X-ray peak as mass centre) possible. Some studies find significant offsets between the hot gas peak and the central galaxy in a fraction of clusters (Zhang et al. 2019; Lauer et al. 2014; Sehgal et al. 2013; Ding et al. 2023). For example, Lauer et al. (2014) find that in the sample of 433 BCGs with redshift smaller than 0.08 about 15% have an Xray-BCG offset exceeding 100 kpc. Ding et al. (2023) show that among 186 clusters with 0.1 ≤ z ≤ 1.4, approximately 25% have a central galaxy-SZ offset larger than 330 kpc, although refining the BCG identification reduces this fraction to about 10%. The same study reports that within a radius of 0.3 to 1 Mpc clusters with small X ray-BCG offsets exhibit considerably stronger lensing signals than clusters with large offsets. These results indicate that the central galaxy is not always a reliable indicator of the gravitational potential centre. For J110121.67+060931.3, if we assume that the X-ray emission originates from the foreground galaxy cluster at redshift 0.2503 given by WEN_CAT, then the offset between the X-ray position and the BCG is 47.79 kpc; this value is within the observed range of X ray-BCG offset reported in the aforementioned literature.
We want to point out that attributing this X-ray emission to the diffuse emission of the galaxy cluster provided by WEN_CAT is highly dubious; this model is only a suspicion. There are two reasons. First, this X-ray emission is classified as a ‘point-like’ source (EXT_LIKE= 0) in the eRASS1 Main catalogue (Merloni et al. 2024), which weakens the possibility that this X-ray emission is diffuse emission from a galaxy cluster. Another reason is that the aforementioned inferred M500 ≳ 2 × 10¹⁴ M⊙ based on the LX-M500 scaling relation and the cluster redshift of about 0.25 imply that such galaxy cluster falls well within the detection limit of the eRASS1 Galaxy Groups and Clusters catalogue (Bulbul et al. 2024). However, this source is not present in the eRASS1 Galaxy Groups and Clusters catalogue. It supports the smaller cluster-mass inference given by WEN_CAT, thereby weakening the possibility that this system is a WSLQ.
Further confirmation or refutation of this candidate requires deeper multi-wavelength imaging to pinpoint the cluster mass centroid and profile more accurately or to reveal fainter quasar image candidates below the DESI Legacy Imaging Surveys DR9 detection limit that would support a model centred on the BCG or another location.
Appendix A.2.2 J150155.61-025728.4
Figure 9 shows the spectra (left panel) and the DESI Legacy Imaging Surveys DR9 image (right panel) of this system. The separation between images A and B is 19.32 arcsec. Both spectra are from DESI DR1, which yields automatic redshifts zA = 1.6438 ± 0.0004 and zB = 1.6475 ± 0.0002.
The DESI Legacy Imaging Surveys DR9 image shows that a galaxy cluster or group possibly existed between images A and B. The brightest object situated between the two quasar images is a star. A galaxy immediately to its north has a spectroscopic redshift of 0.89 in DESI DR1. Two fainter red objects located west and northeast (close to image B) of this galaxy have photometric redshifts of 0.921 ± 0.075 and 0.923 ± 0.17 in the DESI Legacy Imaging Surveys DR9 catalogue. These three images are indicated by white circles in Figure 9. These measurements suggest that a galaxy group or cluster at z ≃ 0.89 may reside in the central region and provide the gravitational potential necessary to produce the double quasar images. Deeper imaging will be required to confirm or rule out this possibility.
The spectra of images A and B have some different features, which do not rule out the possibility of this system being a real lensing system, because these might be attributed to several mechanisms. For example, the ratio of the red to blue wings of the Mg II and C III] lines in image B differs markedly from that in image A. Such a difference could arise from microlensing (Sluse et al. 2012; Motta et al. 2012; Hutsemékers et al. 2023). At the position of C IV in image A, and on the blue wing of C IV in image B, multiple different narrow absorption lines (NALs) are present; these could be caused by the difference in quasar inner structure at different sightlines of the two images (Misawa et al. 2016). An alternative possibility is that some of these narrow absorption features originate in intervening material that is unrelated to the quasar.
Applying the lens modelling method outlined in Section A.1, the system was successfully modelled with a SIE mass profile. The lens centre was fixed at the object with spectroscopic redshift z = 0.89 located north of the bright star. The model reproduces the observed configuration well: the best-fitting value gives σv = 988.96 km s−1, q = 0.98, φ = 29.19°, an Einstein radius of 9.364 arcsec, and a projected mass within that radius of 5.503 × 10¹³ M⊙. The best-fitting result is shown in the right-hand panel of Figure A.1.
Confirmation or refutation of this candidate demands deeper imaging and additional high quality spectroscopy. Deeper data may uncover neighbouring strong-lensing features, allowing a more reliable estimate of the lens galaxy cluster properties, particularly its mass. Multiple spectroscopic observations of the quasar images will help to determine whether the observed spectral differences are produced by microlensing, differential absorption, or other mechanisms.
Appendix B Simulating multi-image maximum separation distribution
We employed Monte Carlo simulation to predict the distribution of the maximum image angular separation of lensed quasars produced by galaxy cluster lenses, the relevant result is shown in Figure 7. The simulation comprises three parts: a foreground light cone, a background light cone, and the lensing simulation.
For the deflectors in the foreground light cone we adopt the cluster redshifts, masses, and sky coordinates provided by the ZOU_CAT, but assign halo ellipticities through a Monte Carlo procedure. This procedure incorporates redshift evolution: we set the ellipticity distribution at z = 0 to have a mean ē = 0.33 (Hopkins et al. 2005) and standard deviation σe = 0.16 (Plionis et al. 1991), and let the mean evolve as ē = 0.33 + 0.05z (Hopkins et al. 2005), and assume σe does not evolve along redshift (Allgood et al. 2006; Suto et al. 2016); the position angle of the major axis is drawn from a uniform distribution. We assume two alternative mass models for the foreground halos, SIE and eNFW; for the latter, the concentration parameter is computed from the fitting formulae of Child et al. (2018), while the nonlinear (“collapse”) mass scale M* is calculated with the public Python package COLOSSUS (Diemer 2018).
The background quasar population is likewise generated by Monte Carlo sampling: source redshifts follow the quasar redshift distribution of CatNorth, whereas their sky positions are assumed to be uniformly distributed.
Based on the foreground light cone and the background quasar population, we perform the lensing simulation to generate the multi-image separation distribution. During the lensing simulation, mock quasars are treated as point sources. For each of the sources, we include all foreground halos within 100″ of the quasar and use the lenstronomy package (Birrer & Amara 2018; Birrer et al. 2021) to solve the maximum image separation angle of the lensed quasar (when multiple images are produced).
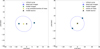 |
Fig. A.1 Left panel: Lens model for J110121.67+060931.3, the system shown in Figure 8, assuming that the lens centre is fixed at the plausible X-ray emission peak. Right panel: Lens model solution J150155.61-025728.4, the system shown in Figure 9, assuming that the lens centre is fixed at the galaxy north of the bright central star whose spectroscopic redshift is z = 0.89. |
Appendix C Column descriptions
In Table C.1 and Table C.2, we describe the columns of the published catalogues.
Column description of the WSLQ candidate catalogue (LQC).
Column description of the dual quasar candidate catalogue.
All Tables
All Figures
|
Fig. 1 Optical images of the four discoverable WSLQs. From left to right: SDSS J1004+4112, SDSS J1029+2623, SDSS J1326+4806, and GraL J165105.3-041725. Quasar images included in CatNorth are marked with white circles. The quasar images that belong to known WSLQ systems but are not included in CatNorth are marked as red circles (we only plot the non-odd image). The images of the first three panels are from DESI Legacy Imaging Surveys DR9, and the rightmost panel is from Pan-STARRS1. (Orientation: north is up, south is down, west is left, and east is right; same hereafter). |
| In the text | |
|
Fig. 2 Flowchart illustrating the methodology employed to select WSLQ candidates and dual quasar candidates from the CatNorth. |
| In the text | |
|
Fig. 3 Distribution of the angular separation between the mean sky position of each quasar group and the BCG of the nearest matched cluster (maximum allowed match radius 2′). Orange bars (right y axis) show all matches from the QGC (pre-VI), while blue bars (left y axis) show the corresponding results of visually inspected LQC (post-VI). |
| In the text | |
|
Fig. 4 DESI Legacy Imaging Surveys DR9 grz composite images of the five Grade A candidates for which at least one galaxy cluster is located within 30 arcsec of the quasar group centre. Each image spans 70 arcsec × 70 arcsec. White circles indicate the quasar candidate images, while red and blue circles mark the positions of the BCG matched in WEN_CAT and ZOU_CAT, respectively. |
| In the text | |
|
Fig. 5 DESI Legacy Imaging Surveys DR9 grz composite images of the first 15 Grade A candidates for which no galaxy cluster is matched within 30 arcsec of the quasar group centre. Each panel spans 70 arcsec × 70 arcsec. White circles mark the positions of the quasar candidate images. |
| In the text | |
|
Fig. 6 Distribution of the properties of the LQC (orange plus signs), the eight images of the four discoverable known lenses in CatNorth (green cross symbols), and the stellar population located within 3′ of all LQC objects (blue density map). Left : two-dimensional distribution of total PM_SIG (the absolute value of the proper motion divided by its uncertainty) versus PLX_SIG (the absolute value of the parallax divided by its uncertainty). Right : two-dimensional distribution of the W1 - W 2 and z - W1, which is defined in AB magnitude system. We want to note that WISE photometry is calibrated in the Vega system. We converted to AB using mAB = mVega + Δm, with Δmw1,w2 = (2.699, 3.339), given by Cutri et al. (2013). |
| In the text | |
|
Fig. 7 Statistical properties of LQC, QGC, and discoverable known lenses. First panel: distribution of the colour similarity, Scolour (we note that the vertical marker line for SDSS J1004+4112 falls on top of the line for SDSS J1029+2623, which makes the line for SDSS J1029+2623 difficult to see). Second panel: distribution of the Pan-STARRS1 g band magnitudes for all quasar images contained in each quasar candidate group or known lensed quasar system. Third panel: distribution of the maximum image separation. The blue and green curves are the simulation results derived from the model in Appendix B, corresponding to different lens mass profile models. Fourth panel: distribution of the photometric redshift zph for all quasar images in each group or known system; the blue curve shows the zph distribution for those quasar candidate groups in the QGC that have sufficient spectroscopic matches. Dashed lines indicate the positions of the corresponding values for the four discoverable known lenses in CatNorth. Stepped black histograms trace the distributions for the QGC. |
| In the text | |
|
Fig. 8 Spectra and image of J110121.67+060931.3, the image separation is 14.14″. Left: DESI DR1 spectra of images A and B (smoothed for clarity; shaded bands show the unsmoothed noise); reference lines correspond to z = 0.8305. Right: DESI Legacy Surveys DR9 image; the white circle marks the BCG from WEN_CAT, and the yellow triangle the eRASS1 X-ray source. See Appendix A.2.1 for details. |
| In the text | |
|
Fig. 9 Spectra and image of J150155.61-025728.4, the image separation is 19.32″. Left: DESI DR1 spectra of images A and B (smoothed for clarity; shaded bands show noise); vertical markers at z = 1.646. Right: DESI Legacy Surveys DR9 image. Data suggest that a galaxy group or cluster at z ≈ 0.89 may reside between the two quasar images; these plausible member galaxies are marked as white circles. See Appendix A.2.2 for details. |
| In the text | |
|
Fig. 10 Spectra and images of two dual quasar candidates. In each row the left sub-panel shows the spectra and the right sub-panel presents the DESI Legacy Imaging Surveys DR9 grz composite image. Top : dual quasar candidate of groupid = 9333. Spectrum of image A is from SDSS DR16 and that of image B is from DESI DR1; automated spectral redshifts are zA = 0.7239 and zB = 0.7201. The angular separation is 13.17 arcsec, corresponding to a projected distance of 95.01 kpc; the velocity difference is 661.56 km s−1. Bottom : dual quasar candidate of groupid = 26644. Spectrum of image A derives from DESI DR1 and image B from SDSS DR16 with automated spectral redshifts zA = 2.3028 and zB = 2.2938. The angular separation is 11.61 arcsec, giving a projected distance of 96.51 kpc; the velocity difference is 818.04 km s−1. |
| In the text | |
|
Fig. 11 DESI Legacy Imaging Surveys DR9 grz composite images of the 29 dual quasar candidate systems. Each cut-out spans 30 arcsec × 30 arcsec. White circles mark the positions of the quasar candidate images. |
| In the text | |
|
Fig. A.1 Left panel: Lens model for J110121.67+060931.3, the system shown in Figure 8, assuming that the lens centre is fixed at the plausible X-ray emission peak. Right panel: Lens model solution J150155.61-025728.4, the system shown in Figure 9, assuming that the lens centre is fixed at the galaxy north of the bright central star whose spectroscopic redshift is z = 0.89. |
| In the text | |
Current usage metrics show cumulative count of Article Views (full-text article views including HTML views, PDF and ePub downloads, according to the available data) and Abstracts Views on Vision4Press platform.
Data correspond to usage on the plateform after 2015. The current usage metrics is available 48-96 hours after online publication and is updated daily on week days.
Initial download of the metrics may take a while.