


Fig. 8
Download original image
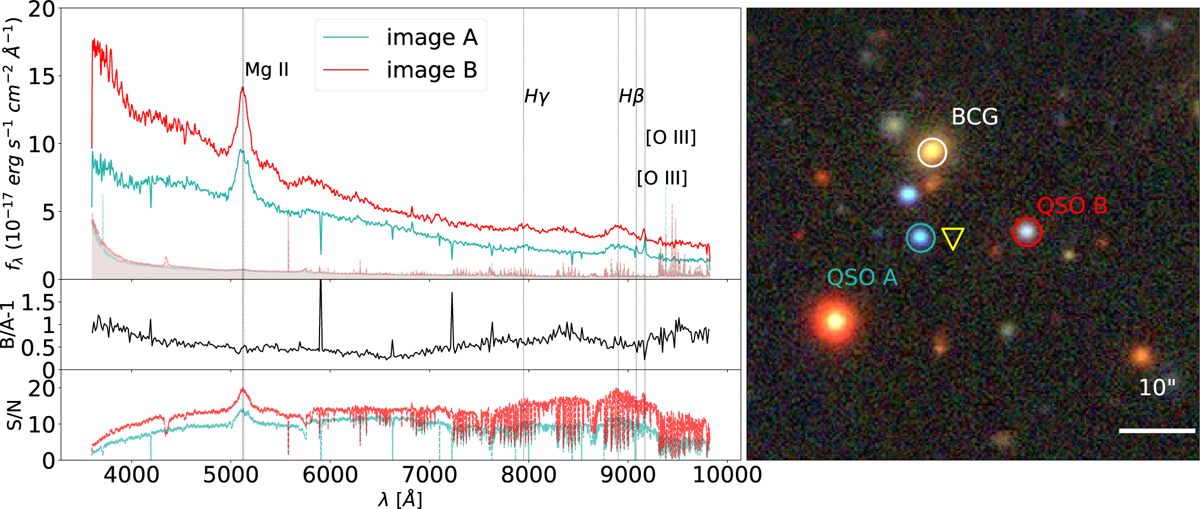
Spectra and image of J110121.67+060931.3, the image separation is 14.14″. Left: DESI DR1 spectra of images A and B (smoothed for clarity; shaded bands show the unsmoothed noise); reference lines correspond to z = 0.8305. Right: DESI Legacy Surveys DR9 image; the white circle marks the BCG from WEN_CAT, and the yellow triangle the eRASS1 X-ray source. See Appendix A.2.1 for details.
Current usage metrics show cumulative count of Article Views (full-text article views including HTML views, PDF and ePub downloads, according to the available data) and Abstracts Views on Vision4Press platform.
Data correspond to usage on the plateform after 2015. The current usage metrics is available 48-96 hours after online publication and is updated daily on week days.
Initial download of the metrics may take a while.