


Fig. 9
Download original image
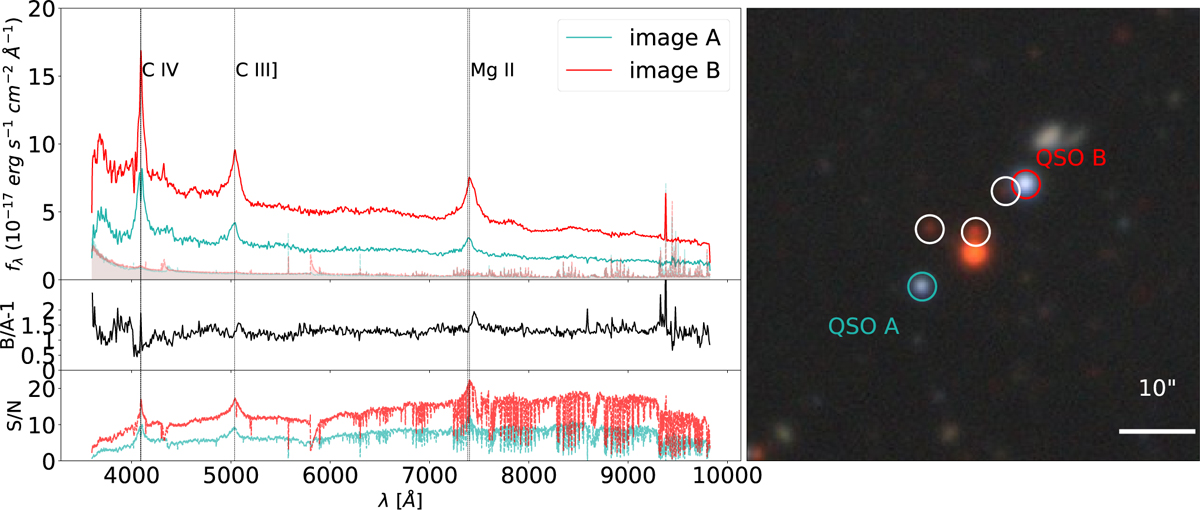
Spectra and image of J150155.61-025728.4, the image separation is 19.32″. Left: DESI DR1 spectra of images A and B (smoothed for clarity; shaded bands show noise); vertical markers at z = 1.646. Right: DESI Legacy Surveys DR9 image. Data suggest that a galaxy group or cluster at z ≈ 0.89 may reside between the two quasar images; these plausible member galaxies are marked as white circles. See Appendix A.2.2 for details.
Current usage metrics show cumulative count of Article Views (full-text article views including HTML views, PDF and ePub downloads, according to the available data) and Abstracts Views on Vision4Press platform.
Data correspond to usage on the plateform after 2015. The current usage metrics is available 48-96 hours after online publication and is updated daily on week days.
Initial download of the metrics may take a while.