


Fig. 6
Download original image
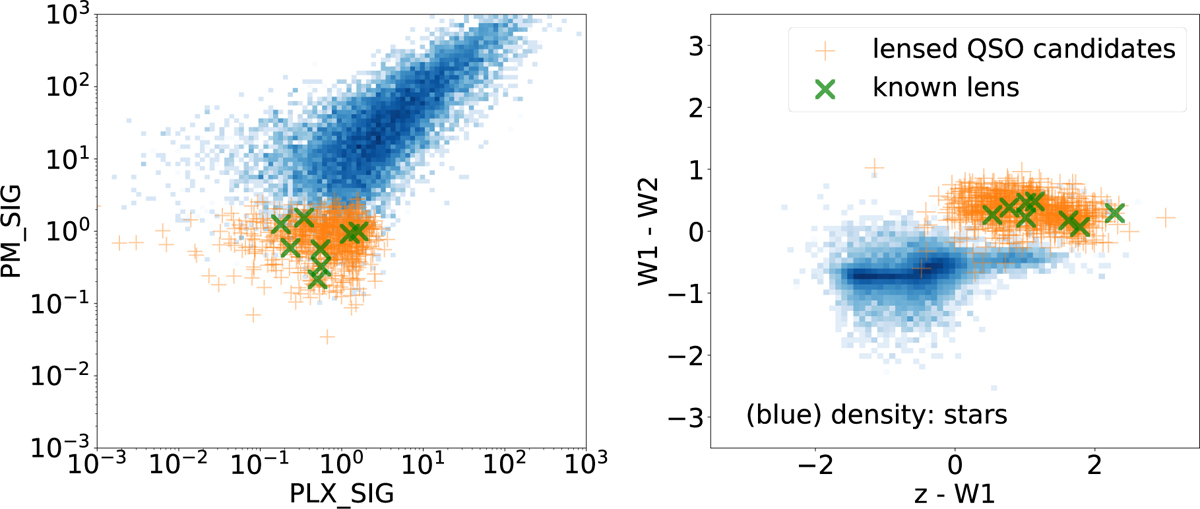
Distribution of the properties of the LQC (orange plus signs), the eight images of the four discoverable known lenses in CatNorth (green cross symbols), and the stellar population located within 3′ of all LQC objects (blue density map). Left : two-dimensional distribution of total PM_SIG (the absolute value of the proper motion divided by its uncertainty) versus PLX_SIG (the absolute value of the parallax divided by its uncertainty). Right : two-dimensional distribution of the W1 - W 2 and z - W1, which is defined in AB magnitude system. We want to note that WISE photometry is calibrated in the Vega system. We converted to AB using mAB = mVega + Δm, with Δmw1,w2 = (2.699, 3.339), given by Cutri et al. (2013).
Current usage metrics show cumulative count of Article Views (full-text article views including HTML views, PDF and ePub downloads, according to the available data) and Abstracts Views on Vision4Press platform.
Data correspond to usage on the plateform after 2015. The current usage metrics is available 48-96 hours after online publication and is updated daily on week days.
Initial download of the metrics may take a while.