


Fig. 3
Download original image
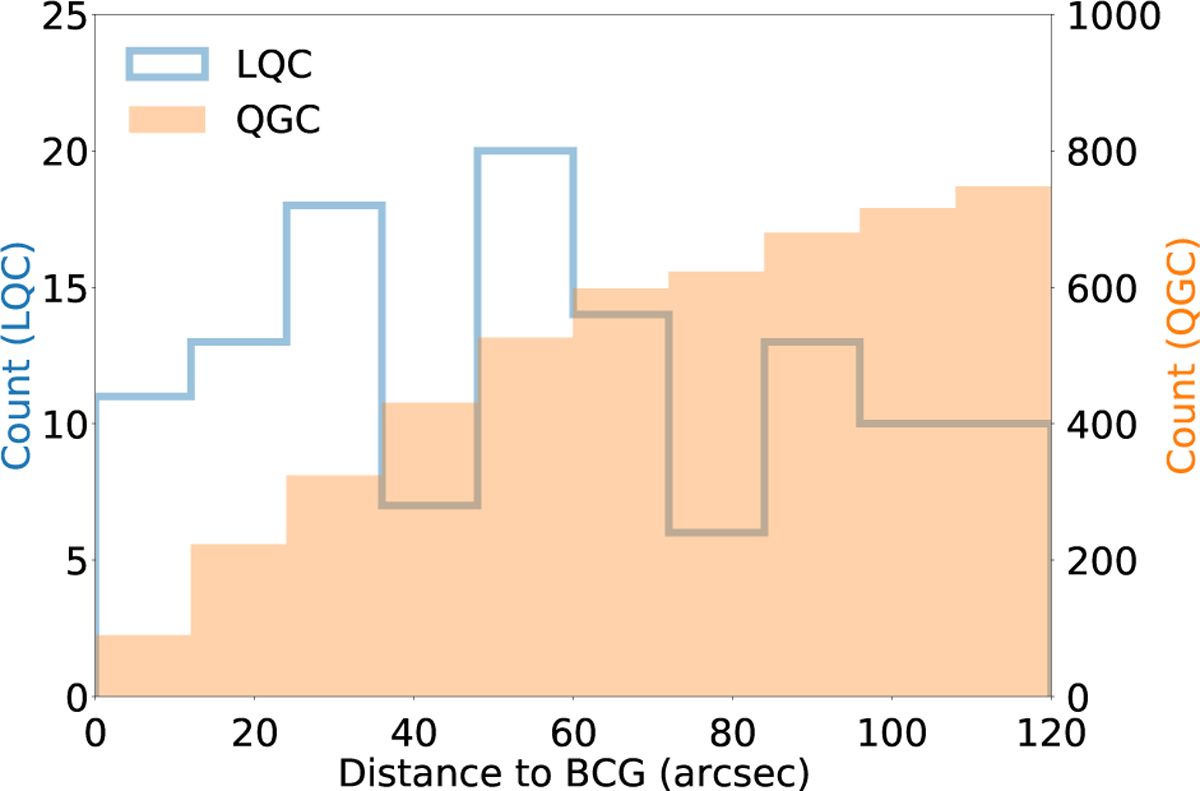
Distribution of the angular separation between the mean sky position of each quasar group and the BCG of the nearest matched cluster (maximum allowed match radius 2′). Orange bars (right y axis) show all matches from the QGC (pre-VI), while blue bars (left y axis) show the corresponding results of visually inspected LQC (post-VI).
Current usage metrics show cumulative count of Article Views (full-text article views including HTML views, PDF and ePub downloads, according to the available data) and Abstracts Views on Vision4Press platform.
Data correspond to usage on the plateform after 2015. The current usage metrics is available 48-96 hours after online publication and is updated daily on week days.
Initial download of the metrics may take a while.