| Issue |
A&A
Volume 709, May 2026
|
|
|---|---|---|
| Article Number | A144 | |
| Number of page(s) | 14 | |
| Section | Galactic structure, stellar clusters and populations | |
| DOI | https://doi.org/10.1051/0004-6361/202659572 | |
| Published online | 12 May 2026 | |
PENELLOPE
IX. Lithium, iron, and barium elemental abundances in eight nearby young clusters
1
INAF – Osservatorio Astronomico di Roma,
via Frascati 33,
00078
Monte Porzio Catone (RM),
Italy
2
INAF – Osservatorio Astrofisico di Catania,
via S. Sofia 78,
95123
Catania,
Italy
3
European Southern Observatory,
Karl-Schwarzschild-Straße 2,
85748
Garching bei München,
Germany
4
INAF – Osservatorio Astronomico di Capodimonte,
via Moiariello 16,
80131
Napoli,
Italy
5
Konkoly Observatory, HUN-REN Research Centre for Astronomy and Earth Sciences, MTA Centre of Excellence,
Konkoly-Thege Miklós út 15–17,
1121
Budapest,
Hungary
6
Institute of Physics and Astronomy, ELTE Eötvös Loránd University,
Pázmány Péter sétány 1/A,
1117
Budapest,
Hungary
7
Institute for Astronomy (IfA), University of Vienna,
Türkenschanzstrasse 17,
1180
Vienna,
Austria
8
Purple Mountain Observatory, Chinese Academy of Sciences,
10 Yuanhua Road,
Nanjing
210023,
PR China
9
ASI, Italian Space Agency,
Via del Politecnico snc,
00133
Rome,
Italy
10
Instituto de Astrofísica e Ciências do Espaço, Universidade do Porto, CAUP,
Ruadas Estrelas,
4150-762
Porto,
Portugal
11
Departamento de Física e Astronomia, Faculdade de Ciências, Universidade do Porto,
Ruado Campo Alegre 687,
4169-007
Porto,
Portugal
12
Max-Planck-Insitut für Astronomie,
Königstuhl 17,
69117
Heidelberg,
Germany
13
Instituto de Astronomía, Universidad Autónoma de México Ensenada,
B.C.,
Mexico
14
Centro de Astrobiología (CAB), CSIC-INTA,
Camino Bajo del Castillo s/n,
28692,
Villanueva de la Cañada,
Madrid,
Spain
15
Space Telescope Science Institute,
3700 San Martin Dr.,
Baltimore,
MD
21218,
USA
16
Johns Hopkins University, Bloomberg Center for Physics and Astronomy,
3400 N. Charles Street,
Baltimore,
MD
21218,
USA
17
Division of Physics and Astronomy, Alfred University,
1 Saxon Drive,
Alfred,
NY
14802,
USA
18
Institut für Theoretische Physik und Astrophysik Christian-Albrechts-Universität zu Kiel,
Leibnizstrasse 15,
24118
Kiel,
Germany
19
Mt. Suhora Astronomical Observatory, University of the National Education Commission,
ul. Podchorżych 2,
30-084
Kraków,
Poland
20
Thüringer Landessternwarte,
Sternwarte 5,
07778
Tautenburg,
Germany
21
Leiden Observatory, Leiden University,
PO Box 9513,
2300 RA
Leiden,
The Netherlands
22
SETI Institute,
339 Bernardo Ave., Suite 200,
Mountain View,
CA
94043,
USA
★ Corresponding author: This email address is being protected from spambots. You need JavaScript enabled to view it.
Received:
23
February
2026
Accepted:
24
March
2026
Abstract
We conducted a homogeneous chemical analysis of pre-main sequence stars with effective temperatures ranging from ∼3000 K to ∼5500 K in eight nearby star-forming regions (SFRs): Chamaeleon I, η Chamaeleonis, Lupus, Orion OB1a, Orion OB1b, σ Orionis, Taurus, and Corona-Australis. Our study aims to: (1) derive the lithium (Li) abundance (A(Li)) and highlight the impact of veiling correction on both the A(Li) and age determination; (2) perform an iron (Fe) and barium (Ba) abundance analysis in regions with scarce previous measurements; and (3) investigate the possible Ba enhancement. The analyzed data were obtained as part of the PENELLOPE Large Program using the ESPRESSO, UVES, and X-Shooter instruments. We measured the equivalent width (EW) of the Li line (EWLi) at λ = 6707.8 Å, from which A(Li) was derived using the curves of growth method. The Fe and Ba abundances have been measured through spectral synthesis analysis. Using the EAGLES code, we derived an upper limit on the age of the eight SFRs. Our findings underscore the necessity of veiling corrections on EWLi, which can shift A(Li) and age estimates by up to ∼0.7 dex and ∼20 Myr, respectively. When accounting for veiling, the A(Li) distributions peak in a range between 3.3 and 3.8 dex for most clusters and the upper age limit is approximately 5 Myr for all SFRs. We successfully measured the mean Fe and Ba abundances in Lupus, Taurus, Cha I, and η Cha, finding slightly subsolar Fe abundances and a clear Ba overabundance, with [Ba/H] values reaching up to 0.75 dex.
Key words: techniques: spectroscopic / stars: abundances / stars: low-mass / stars: pre-main sequence
© The Authors 2026
 Open Access article, published by EDP Sciences, under the terms of the Creative Commons Attribution License (https://creativecommons.org/licenses/by/4.0), which permits unrestricted use, distribution, and reproduction in any medium, provided the original work is properly cited.
This article is published in open access under the Subscribe to Open model. This email address is being protected from spambots. You need JavaScript enabled to view it. to support open access publication.
1 Introduction
The determination of the chemical composition of star-forming regions (SFRs) and young open clusters (YOCs) is critically important for various astrophysical issues, in both planetary and stellar contexts. These young regions are key objects for tracing the current chemical pattern of the Galactic thin disk. Given their recent formation, these regions have not undergone significant radial migration across the Galactic disk. Their chemical abundances are therefore expected to closely mirror the current composition of the local interstellar medium (ISM), exhibiting minimal evidence of subsequent chemical enrichment (Spina et al. 2014).
One of the most important elements for studying young regions is lithium (7Li). This element is indeed sensitive to stellar interior processes and it serves as a tracer of internal mixing processes, representing a benchmark for stellar evolution models. In pre-main sequence (PMS) stars, the deviations of the observed Li patterns from predictions by standard stellar models provide a crucial test for theoretical models, highlighting the limitations with respect to the treatment of overshooting and nonstandard mixing mechanisms (e.g., rotation or magnetic fields; see e.g., Pinsonneault 1997; Jeffries 2006; Somers & Pinsonneault 2015; Baraffe et al. 2017). Furthermore, since Li is easily destroyed at relatively low temperatures (∼2.5 × 10⁶ K), its depletion in stellar atmosphere provides an age indicator for low-mass PMS stars in young (age < 200 Myr) populations (Bildsten et al. 1997). The amount of depletion depend on mass, age, metallicity, and other mixing processes occurring during the early stellar evolution. Low-mass (<0.5 M⊙) PMS stars reach these temperatures as they contract toward the MS (Bodenheimer 1965). Low-mass stars require relatively long time to reach the critical temperature for Li burning. Specifically, stars with mass lower than 0.2 M⊙ initiate 7Li burning after ∼20–25 Myr, while those in the ∼0.2–0.5 M⊙ begin after ∼15–5 Myr (Baraffe et al. 2015 and reference within). Since these stars remain fully convective, they eventually deplete their entire 7Li content during the PMS phase. Stars more massive than 0.5 M⊙ initiate Li burning during the early stages of their PMS evolution. For example, a 0.6 M⊙ star begins depletion at ∼3 Myr. The duration of this process is limited, concluding once a radiative core develops. This transition is mass-dependent; in more massive stars, the convective envelope gradually shrinks. Consequently, the temperature at the base of the envelope becomes too low, halting further 7Li destruction. As a result, these stars retain a portion of their initial Li abundance (typically A(Li) ∼ 3.3 dex). For instance, a 1.0 M⊙ star is expected to deplete only 60% of its initial 7Li, while stars with masses greater than ∼1.2 M⊙ are not expected to destroy Li in their envelopes (Randich & Magrini 2021 and reference within). Consequently, the depletion of 7Li serves as a robust chronometer for characterizing the ages of young stellar associations and open clusters (e.g., Song et al. 2002; Palla et al. 2007; Lim et al. 2016; Randich & Magrini 2021).
In addition to Li, iron (Fe) is a fundamental tracer for investigating the origin and evolution of star-forming regions and the chemical evolution of the Galactic disk. As the primary proxy for overall metallicity, the Fe abundance [Fe/H]1 provides critical constraints on the star formation, possible chemical enrichment history, and chemical patterns of stellar populations. Furthermore, knowledge of the Fe abundance in SFRs is essential for investigating the formation and evolution of exoplanets.
A growing consensus supports the planet-metallicity correlation, wherein metal-rich environments facilitate the formation of planetary systems, particularly giant planets (e.g., Mulders et al. 2016; Swastik et al. 2022 and references therein). In SFRs and YOCs, the Fe abundance is typically observed to be slightly sub-solar or near-solar (e.g., Biazzo et al. 2011a,b; Spina et al. 2014 and reference therein).
Finally, another important element used to investigate the chemical pattern of young regions is barium (Ba), which is produced by neutron capture reaction, mostly by the s-process occurring in low-mass asymptotic giant branch (AGB) stars (Busso et al. 1999; Karakas et al. 2014; Kobayashi et al. 2020). In the last few decades, several studies have shown an overabundance of Ba content in young clusters; in particular, D’Orazi et al. (2009) discovered an anti-correlation between [Ba/Fe] and cluster age analyzing 20 open clusters (OCs) in the Galaxy. The old OCs (age ≳4 Gyr) exhibited a solar Ba abundance, while the OCs with ages of ∼100–200 Myr showed an enhancement up to 0.2–0.3 dex, while the younger clusters (≲70 Myr) showed an higher Barium content up to 0.6–0.7 dex. These results have been confirmed by other authors (e.g., D’Orazi et al. 2012; Jacobson et al. 2011; Mishenina et al. 2013; Baratella et al. 2021; Spina et al. 2021; Magrini et al. 2023). The contribution of the low-mass AGBs to the Galactic chemical enrichment can explain the enhancement observed in intermediate-age OCs (D’Orazi et al. 2009), but not in the younger ones. Currently, it is not possible to reconcile this large Ba abundance (∼0.7 dex) with any standard nucleosynthesis and galactic evolution model. Moreover, it remains controversial whether all other s-process elements follow the behavior seen for Ba. Specifically, elements formed in the second peak of the s-process (along with Ba), such as lanthanum (La) and cerium (Ce), would be expected to share the same patterns. However, some authors have found a lack of significant trend with age (D’Orazi et al. 2012; Jacobson & Friel 2013; Baratella et al. 2021), in contradiction with Maiorca et al. (2011), adding further complexity to the mystery.
In this work, we present a systematic and homogeneous analysis of Li, Fe, and Ba abundances of PMS stars in several star-forming regions: Chamaleon I (Cha I), η-Chamaleontis (η Cha), Lupus, Taurus, σ Orionis (σ Ori), Orion OB1a, Orion OB1b, and Corona-Australis (CrA). We analyze a set of spectra gathered as part of the PENELLOPE program. This ESO large program serves to complement the Hubble Space Telescope’s (HST) UV Legacy Library of Young Stars (ULLYSES, Roman-Duval et al. 2020). The goal of these two programs is to observe a large sample of young stars, probing a wide range of ages and masses to provide sufficient statistics for understanding the processes of accretion and ejection during the star formation. For a comprehensive description of the PENELLOPE survey, we refer to Manara et al. (2021). This paper is organized as follows. In Sect. 2, we describe the data. Our spectral analysis of Li is given in Sect. 3 and the study of Fe and Ba is presented in Sect. 4, while we summarize our findings in Sect. 5.
2 Data
The data used in this work were acquired within the PENEL-LOPE survey (Manara et al. 2021). Details on the observational strategy and data reduction of the PENELLOPE sample are reported in Manara et al. (2021). In brief, the spectra were obtained using the instruments ESPRESSO (Echelle SPectrograph for Rocky Exoplanets and Stable Spectroscopic Observations; Pepe et al. 2021), UVES (Ultraviolet and Visual Echelle Spectrograph; Dekker et al. 2000), and X-Shooter (Vernet et al. 2011), all mounted on ESO’s Very Large Telescope (ESO@VLT).
ESPRESSO spectra cover a wavelength range of 380–788 nm, with a resolution of R ∼ 140 000. UVES observations, conducted using the red and blue arms in dichroic mode, span the 330–450 nm and 480–680 nm with R ∼ 70 000. X-Shooter provides broader coverage from ∼300 nm to ∼2500 nm, divided in three arms: UVB (300–500 nm), VIS (500–1000 nm), and NIR (1000–2500 nm) with a resolution of ∼17 500.
The analyzed sample comprises 75 PMS stars belonging to eight different associations: Lupus (30), Cha I (15), Orion OB1a (2), Orion OB1b (7), Taurus (8), η Cha (7), σ Ori (3), and Corana-Australis (2). All targets were observed with X-Shooter. The brightest stars (V < 16 mag) were observed with ESPRESSO, while UVES was employed for the fainter stars and those that could not otherwise be observed with ESPRESSO. These high resolution observations were carried out simultaneously, or quasi-simultaneously, with the X-Shooter observations. The mean signal-to-noise ratios (S/N) measured around 6000 Å are about 50 for both ESPRESSO and X-Shooter spectra, and 40 for UVES spectra.
For both ESPRESSO and UVES, each target was observed at three distinct “epochs” (ep.) separated by intervals of a few days. The specific dates of the observations are reported in Tables A.1, A.2, and A.3, which are only available in electronic form. Consequently, we were able to analyze multiple spectra for each target, ensuring a robust cross-instrument comparison and the monitoring of short-term variability.
Estimates of the photospheric properties used in our analysis, such as effective temperature (Teff) and surface gravity (log g), radial velocity (RV), projected rotational velocity (v sin i), and veiling (r), were obtained for both the medium-resolution and the high-resolution spectra using the ROTFIT (Frasca et al. 2015) code by the PENELLOPE’s team (Manara et al. 2021 and Antonio Frasca priv. comm.). Briefly, the code was developed for deriving Teff, log g, v sin i, and r, comparing the target spectrum with a grid of templates at the same resolution of the ESPRESSO, UVES, and X-Shooter spectra. The code performs a χ2 minimization of the difference between the observed and template spectra parameters around selected spectral regions particularly suitable for the determination of the atmospheric stellar parameters. Veiling was therefore measured in five spectral regions (around 4500, 5400, 6200, 7100, and 9700 Å) for X-Shooter spectra and in four spectral regions (namely, ∼5000, 5500, 6000, and 6500 Å) for UVES and ESPRESSO spectra. A detailed explanation of the code is given in Frasca et al. (2015, 2017), and Manara et al. (2021).
These values were not available for two spectra observed with X-Shooter: RECX 11 and SO 1153 ep. 2. For these stars, we derived Teff through the line-depth ratio (LDR, Gray 1994), considering a typical surface gravity for this kind of stars (4.5 dex) and a rotational velocity 0.0 km/s. We used the relations from Biazzo et al. (2007) for nonrotating dwarf stars, analyzing the LDR of two pairs of lines in the visible range: λ6199 V I-λ6200 Fe I and λ6252 V I-λ6253 Fe I. These relations can be applied only for stars with a temperature between 4000 K and 6200 K; temperatures outside this range are more uncertain because of the influence of molecular bands in the coolest stars and the very small depths of the low-excitation lines in the hottest stars, respectively. The list of stars together with their Teff and veiling values are reported in Tables A.1, A.2, and A.3 (only available in electronic form).
3 Analysis of the Li line
3.1 Equivalent width determination
To determine the equivalent width (EW) of the Li line (EWLi) at λ = 6707.856 Å (Campbell-White et al. 2023), we developed an IDL code that estimates the local continuum through a linear fit obtained in two narrow ranges (∼5 Å) located near the wings of the 7Li absorbing line. This continuum was then used to normalize the spectrum, from which the EWLi was derived by performing a Gaussian fit. Errors in EWLi were evaluated from the fitting procedure, with typical values of 10–15 mÅ for ESPRESSO and UVES data and 30 mÅ for X-Shooter data. The results obtained from high-resolution (ESPRESSO, UVES) and medium-resolution (X-Shooter) data are consistent within the uncertainties. The mean difference in EWLi is ∼8 mÅ with a standard deviation of ∼43 mÅ.
The spectra are affected by accretion veiling, which is the (nonphotospheric) excess continuum emission due to the accretion process (see Hartmann et al. 2016 and references therein) that can hide or “veil” the photospheric lines. To correct the EWLi for this contribution, we applied the relationship  , where
  is the EW of the Li line measured according to the procedure explained above. Veiling estimates may be influenced by spectral resolution thus, we adopted the r value derived from the ROTFIT analysis closest to the 7Li line at 6707.8 Å measured from the spectra acquired with the three instruments as follows: r650 at 6500 Å for ESPRESSO and UVES spectra, and r710 at 7100 Å for X-Shooter spectra. Since the 7Li I line is blended with the FeI λ 6707.4 Å line, we subtracted the Fe contribution using the corrections by Franciosini et al. (2022), which are given as a function of effective temperature, gravity, and metallicity.
Determining Li abundances in stars cooler than 4000 K (M-type stars) is complicated because of the presence of molecular bands and additional spectral lines from other elements. These blends with the Li feature significantly decrease the apparent continuum level (e.g., Zapatero Osorio et al. 2002). This so-called pseudo-continuum obscures the actual intensity of the true continuum, making it impossible to measure the genuine EW. As a result, only a pseudo-equivalent width (pEW) can be estimated and no Fe corrections are available in the literature.
Individual measurements for  and
and  (corrected for both veiling and Fe blending for K-type stars) or
  (corrected only for veiling for M-type stars), along with the corresponding veiling coefficients are provided in the Tables A.1–A.3. The results for the eight star-forming regions are displayed in Fig. 1. Each panel compares the Li EWs corrected for both veiling and Fe blending (
 , black dots) with those corrected only for Fe blending (
 , red squares) as a function of Teff (left subpanels). The corresponding
  distributions are provided in the right subpanels. Filled and empty symbols denote the K-type and M-type stars, respectively. Dash-dotted lines represent a set of model isochrones in the 5–20 Myr range, as derived by Jeffries et al. (2023) through the fitting of the Gaia-ESO Survey training data. A higher r value leads to a larger difference between
  and
and  and, in some cases, the difference is ∼800 mÅ as for SO 1153 and VZ Cha. Differences between the EWLi values obtained from spectra of the same target at different epochs are discussed in Sect. 3.2. Since M-type stars cannot be corrected for the Fe blending, their EWs represent upper limits, as they also include the contribution of the Fe line. Most of the corrected EW values range between 400 and 800 mÅ and, in some cases, rising up to ∼1000 mÅ. Some targets in our sample are spectroscopic binaries (SBs). For the single-lined systems (SB1), the effect of binarity on EW of Li is negligible. For double-lined spectroscopic binaries (SB2), this effect is within the measurement uncertainties. Therefore, the presence of these binary stars does not impact our final results (Frasca et al. 2018). Below, we provide specific comments on the EWLi for each star-forming region:
Chamaelon I: we measured EWLi in 49 spectra from 15 targets. The corrected EWLi values range from approximately 300 to 1000 mÅ, in agreement, within the uncertainties, with Gutiérrez Albarrán et al. (2024). The peak of the distribution is around 650 mÅ. The highest values correspond to spectra of VZ Cha, taken with UVES across three different epochs. Conversely, the target with the lowest values is Sz 19 observed with ESPRESSO over three different epochs.
η Chamaeleon: we measured EWLi in 18 spectra from 7 targets. The raw values of EWLi are in agreement within the uncertainties with Mentuch et al. (2008). The trend of the EWLi with the temperature is similar to that observed in Cha I, though without the extreme low and high values. Specifically, the measurements range from approximately 445 to 780 mÅ. The distribution peaks at about 650 mÅ.
Lupus: the sample is composed of 108 spectra from 30 targets. The trend of the EWLi with the temperature is consistent with what we observed in Cha I and η Cha. However, the targets with the highest EWLi in Lupus are at lower temperature compared to those in Cha I. These targets include Sz 84, Sz 72, and Sz 104. Our values are slightly higher than those reported by Biazzo et al. (2017); our distribution peaks at ∼650 mÅ compared to their value of 560 mÅ. This discrepancy stems primarily from the different composition of the two samples. Specifically, the sample analyzed by Biazzo et al. 2017 is richer of stars in the Li-depletion region (Teff < 4000 K). An additional factor is the difference in the veiling values adopted in the two works. Despite these discrepancies, the overall trends remain consistent and the
 values for the targets in common agree within the uncertainties.
Taurus: we analyzed 31 spectra from 10 targets. The trend of the EWLi with the temperature is consistent with what observed in other clusters, with the distribution peaking at ∼650 mÅ. The corrected EWLi values range from 375 to 900 mÅ. The targets exhibiting the highest EWLi values are AAtau, DKTauB, and LkCa4.
σ-Orionis: the sample is composed of 13 spectra from 3 targets. The general trend observed in the other star-forming regions is maintained here, with
 values ranging from 490 to 1020 mÅ. The distribution’s peak is ∼650 mÅ. The highest values correspond to SO 1153, observed by ESPRESSO, mainly due to the very high veiling (∼5.0). The raw EWLi is only about 150–170 mÅ.
Orion OB1a: the sample is composed of 8 spectra from 2 targets. These are M-type stars of very similar Teff.
 values range from 400 and 700 mÅ, with a peak of distribution at ∼650 mÅ.
Orion OB1b: the sample comprises 25 spectra from 7 targets. This region shows the same general trend as the other clusters, but it lacks stars with temperatures higher than ~4500 K. The corrected EWLi values in the sample range between 310 and 820 mÅ, in agreement with Piscarreta et al. (2025). CVSO-90 observed with X-Shooter has the lowest EWLi value. Conversely, the three spectra of CVSO-176, acquired with UVES, show the highest value. The peak of the distribution is about 650 mÅ, similar to what is observed for Orion OB1a.
Corona Australis: we measured only only 6 spectra from 2 targets. The
 values range between about 490 mÅ and 679 mÅ, consistently with the other SFRs analyzed.
To quantify the impact of the veiling correction for an accurate measurement of the Li EW, Fig. 2 shows the normalized difference,  , as a function of Teff. To investigate a possible dependence on instrumental resolution, we sought to distinguish between high-resolution (ESPRESSO + UVES) and medium-resolution (X-Shooter) data, represented by solid black circles and filled red triangles, respectively. We found no significant trend between the normalized difference and the resolution. As expected, the influence of veiling decreases for Teff > 5000 K because, as the temperature of the accretion spots and the stellar temperatures become more similar, the line veiling becomes more negligible (Muzerolle et al. 2004). Overall, the normalized differences are almost uniformly distributed across the diagram. The average variation in EWLi due to the veiling is about 30– 40%, reaching up to 80% in specific cases (e.g., SO 1153 and VZ Cha). These results emphasize that neglecting the veiling correction in young, active stars leads to a substantial underestimation of Li abundances, which could result in an incorrect interpretation of stellar ages and Li depletion history.
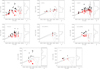 |
Fig. 1 Multipanel overview of the Li EWs for the eight SFRs (Cha I, η Cha, Lupus, Taurus, Orion OB1a, Orion OB1b, σ Ori, and CrA) in our sample. For each region, the left subpanel shows the Li EW versus Teff. The red squares represent the EW corrected for blending with the Fe line ( |


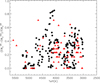 |
Fig. 2
|

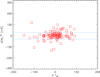 |
Fig. 3 Variation in |

3.2 Lithium variation
Chromospheric activity affects the EW of absorption lines in stellar spectra (Spina et al. 2020 and reference within). Magnetic fields impact spectral lines both directly through the Zeeman effect and indirectly by altering the atmospheric thermodynamic structure (e.g., Borrero 2008; Moore et al. 2015; Shchukina et al. 2016). During a star’s activity cycle, the intensity of the magnetic fields in the stellar atmosphere and the fraction of the stellar surface covered by cool spots vary (Babcock 1959; Schwabe 1844).
Similarly, the accretion process is intrinsically highly variable (Joy 1945; Hartigan et al. 1991) on timescales ranging from minutes to years (Costigan et al. 2014; Nguyen et al. 2009). Short-term variability may result from the deformation of magnetic field lines due to differential rotation (e.g., Goodson et al. 1997). Recent studies have also demonstrated veiling variability associated with changes in the accretion rate in low-mass PMS stars (e.g., Bouvier et al. 2003; Costigan et al. 2014; Manara et al. 2021). Consequently, both chromospheric activity and accretion variability might play a role in the observed variations of the EW of the absorption lines.
Our sample consists of multi-epoch observations, providing a unique opportunity to investigate a potential variation in Li abundance across the epochs. The time intervals between observations are generally a few days, except for the cases where observations were repeated after longer periods (see Tables A.1, A.2, and A.3).
In the first step, we analyzed the variations in the raw Li EW to investigate the variability associated with chromospheric activity. We found that 26 targets exhibited  changes of more than 3σ at least once in a given time interval; of these, 10 exhibited this change in both intervals (i.e., between the first and second and between the second and third epochs). The mean value of
  of these 26 targets is about 62 ± 28 mÅ. As shown in Fig. 3, these variations are not driven by changes in Teff. The observed temperature variations are small (less than 150 K) and remain within the uncertainties of the Teff determination. Subsequently, we examined the potential variations in EWLi linked to the accretion process. Figure 4 shows the variation of
  across the observing epochs as a function of the veiling difference ∆r650 for each target.
We identified 30 sources showing  greater than 3σ and 15 of them show this result in both temporal intervals. For these specific targets, the mean
  is significantly higher than the values derived from raw measurements (i.e., 92.2 ± 65.9 mÅ). Interestingly, only 9 of these 30 sources overlap with the “raw” sample; this occurs because veiling variations occasionally mask the intrinsic
  , while in others instances, they amplify it. Moreover, Fig. 4 shows a clear positive correlation between
  and ∆r650: as the variation in veiling increases, the variation in EW increases accordingly. This result is in agreement with recent works, such as that of Stout-Batalha et al. (2000), suggesting that higher accretion rates (and, thus, higher veiling) produce larger Li abundances because fresh material, with primordial levels of Li, is incorporated onto the star’s surface. In any case, this analysis reinforces the critical necessity of accounting for veiling to achieve accurate Li EW determinations.
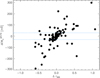 |
Fig. 4 Variation in |

3.3 Abundance of 7Li
We estimated the Li abundances, A(Li)2, from the measured EWs, using the atmospheric parameters (Teff, logg, and vsini) cited above, assuming a typical microturbulent velocity of 1.0 km/s. Since it was not possible to determine [Fe/H] individually for each region (see Sect. 4) with our data, we adopted a solar Fe abundance for all targets to ensure a consistent methodology across the entire dataset. This assumption is appropriate for nearby star-forming regions (Randich et al. 2022). Moreover, a variation in [Fe/H] of ±0.1 dex corresponds to an uncertainty of around ±0.01 dex in A(Li). This contribution is negligible compared to the total uncertainty in the A(Li) determination and, consequently, it does not affect the results. Under these assumptions, we applied the LTE curves of growth (COGs) developed by Franciosini et al. (2022), differentiated for K and M stars. The valid range for A(Li) is between [−1.0, 4.0] dex, values falling outside this range are determined through extrapolations. The nonlocal thermodynamic equilibrium (NLTE) effects to the A(Li) were considered, using the correction values from Lind et al. (2009) available for K stars in the range [–0.30, 4.20] dex. For stars whose final extrapolated A(Li) value exceeds 4.0 dex, the Li abundance was set to 4.0 dex, which represents a conservative lower limit for our dataset.
The uncertainties in the stellar parameters and to the measurement of EWLi represent the main sources of error in A(Li). The total uncertainty for A(Li) was estimated taking into account every source of uncertainty (Teff, log g, EW(Li), ξ, vsini, and [Fe/H]), combining them in quadrature. The overall uncertainties typically fall within the range of 0.1–0.2 dex, with the uncertainty in effective temperature being the main contributor. Additionally, an uncertainty of ∼0.1 in the veiling factor introduces an error of about 0.2 dex in A(Li).
The results or the eight SFRs are shown in Fig. 5. Each panel provides a comparison between the A(Li), corrected for NLTE effect, determined from with  (black dots) and
  (red squares) values as a function of Teff (left), and the A(Li) (corrected for veiling) distribution (right).
M-type stars (Teff ≲ 4000 K) were not corrected for NLTE effect, thus the A(Li) values shown in the plot represent upper limits, as NLTE corrections tend to decrease A(Li). K-type ( T ≥ 4000 K) and M-type (T < 4000 K) stars are denoted by filled and open symbols, respectively. Targets where the EWLi exceeded the valid range of the COGs (as a function of Teff and log g) are indicated with lower limits. Isochrones from Baraffe et al. (2015) in the 2–20 Myr range are overplotted as dot-dashed lines.
Similarly to its effect on EWLi, veiling can drastically alter the A(Li) of the targets and, consequently, the age estimate of the cluster. Indeed, as shown in Fig. 5, when veiling is neglected, most sources in each cluster would result to have A(Li) values less than 3 dex, placing the cluster ages between 5 and 20 Myr. However, the veiling corrected EWLi measurements yield A(Li) values between 3 and 4 dex. Consequently, the resulting cluster ages, estimated by comparing the data to the overlaid isochrones, were constrained to be less than 5 Myr. These younger age limits are well in line with previously published values (e.g., Spina et al. 2014 and reference within). The effect of veiling on age determination will be explored in depth in the next section. The peak of the A(Li) distribution is about 3.5–3.6 dex for Cha I, Lupus, and Taurus regions, whose targets span the wider range in temperature. This value is slightly higher than the standard expected initial abundance of ∼3.3 dex, but remains consistent with the expected value when considering our average uncertainty of ∼0.3 dex. Furthermore, our results align with recent studies that have identified a population of Li-rich stars with abundances exceeding the meteoritic limit, ranging from 3.5 to 4.5 dex (e.g., Deliyannis et al. 2002; Yan et al. 2022). Recently, Zhou et al. (2025), reported NLTE A(Li) values between 3.3 and 4.6 dex for a sample of 62 unevolved stars, further supporting the consistency of our findings with the current literature.
We see that η Cha and Orion Ob1a exhibit peaks at lower values, at 2.6 dex and 3.0 dex, respectively, and this might be because the sample is biased towards cool stars. Conversely, CrA and σ Ori show the highest peak at ∼3.8 dex, likely due to a sample bias toward warmer stars. The association Orion OB1b has the peak of the distribution at ∼3.3 dex.
A notable spread in A(Li) was observed in each cluster for stars cooler than 3500 K, which is particularly evident in the Cha I, Lupus, and Orion OB1b associations. This region in Teff is populated by fully convective low-mass stars, which are depleting 7Li at the base of the convective zone. Adopting an A(Li) threshold of 2.0 dex to define 7Li-depleted targets, our analysis identifies seven sources falling below this limit: Sz 10 (Cha I), Sz 104, Sz 69, SS61344.1-373646 (Lupus), CVSO-176, CVSO-90 (Orion OB1b), and ECHAJ0844.2-7833 (η Cha), all observed with X-Shooter. The A(Li) values measured for Sz104, Sz10, and CVSO-176 are only marginally below the 2.0 dex depletion threshold. Their abundance uncertainties are large enough to potentially place these three targets within the nondepleted regime of the plot. This ambiguity is further supported by a comparison with higher-resolution data: Sz 10, Sz 104, SS61344.1-373646, and CVSO-176 exhibit a 7Li abundance higher than 2.0 dex. While the A(Li) values for Sz 10 and SS61344.1-373646 remain relatively low (2.8 dex and 2.2 dex respectively), the other two sources show the mean A(Li) ∼ 3.5 dex. This discrepancy between datasets is due primarily to the veiling factor adopted in the analysis; as explained in Sect. 3.2, slight variations in the veiling correction significantly impact the measured EW of the 7Li line. ECHAJ0844.2-7833 has been observed only with X-Shooter and, therefore, its Li abundance cannot be independently cross-validated. For the sources Sz 69 and CVSO-90, the absence of 7Li line at in the spectra obtained by the other instruments provides strong independent evidence supporting their classification as 7Li-depleted targets (for the sake of brevity, nondetections are not reported in the Tables A.1–A.3 available in electronic form). It is worth noting that the depleted 7Li abundance derived for Sz 69 is consistent with previous finding in the literature (Biazzo et al. 2017).
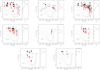 |
Fig. 5 Multipanel overview of the Li abundance for the eight SFRs (Cha I, η Cha, Lupus, Taurus, Orion OB1a, Orion OB1b, σ Ori, and CrA). For each region, the left subpanel shows NLTE-corrected Li abundance as a function of effective temperature. Red squares and black dots represent the A(Li) values derived from |


3.4 Influence of veiling on age estimate based on Li diagnostics
One of our main goals of this work is to investigate the effect on the age estimates, based on the Li line intensity, when the line EW is not corrected for veiling. For this purpose, we used the software EAGLES (Jeffries et al. 2023). This code allows us to obtain age estimates and age probability distributions from measurements of the 7Li I 6708 Å EW and Teff for individual PMS stars (or associated group of coeval stars) with 3000 < Teff < 6500 K, −0.3 < [Fe/H] < 0.2, and 200 ≲ EWLi ≲ 800 mÅ. The code produces estimates of the most probable age, uncertainty and the median age of the stellar cluster. For stars aged less than 10 Myr and more than 1 Gyr, the code provides only upper and lower limits on the age. For intermediate values, the age is estimated with a precision that will depend on the number of stars and their Teff-EWLi distribution (see Jeffries et al. (2023) for more details).
To determine the age of each association, we considered the ESPRESSO, UVES, and X-Shooter data together; in the case of multiple epoch observations, we took the average value of EWLi and Teff from the different epochs for one single star. To evaluate the impact of veiling on age determination, we ran the code twice: first using  as input and then using
  . The results for both cases are shown in Table 1.
For simplicity, only the Lupus case is shown here as a representative example; the results for the remaining regions are provided in Appendix C.1. Figure 6 displays the  (left panel) and
  (right panel) as a function of Teff. The error bars (blue dots) are also given for the best-fitting empirical isochrone (solid black line) and its associated dispersion (gray region).
When using the EAGLES code, the ages derived when accounting for veiling are significantly younger than those obtained without this correction. This is consistent with the results shown in Fig. 5. For the Lupus SFR, the age difference between the two cases is about 7 Myr. The age differences found for the remaining SFRs are from around few Myr up to around 25 Myr, with the latter value obtained for the σ Ori association. This means that the veiling correction is crucial for an appropriate estimation of the age of YOCs based on the Li diagnostics. The upper age limits obtained for each SFR considering the veiling contribution are ∼5–7 Myr, consistent with those reported in the literature (e.g., for Cha I, see Luhman 2007; Manara et al. 2016; Randich et al. 2022; Chen & Chen 2025; for Lupus, Biazzo et al. 2017; for Taurus, Simon et al. 1993 and Luhman 2023, for Orion OB1a and Orion OB1b Briceño et al. 2019, and for σ Ori, Caballero 2018). When considering only the hotter stars (Teff ≥ 4000 K), the estimated upper age limits increase by around 2 Myr.
An interesting aspect of the upper age limit for Orion OB1b is that an age below 5 Myr would be consistent with the high accretion rates reported by Pittman et al. (2022). These rates are typically incompatible with a 5 Myr-old PMS stars, pointing instead toward a significantly younger age. Our results are further supported by the recent work by Piscarreta et al. (2025), who highlighted the impact of accretion, including veiling, on age determination and photospheric properties. They also reported that properly accounting for veiling consistently leads to younger age estimates.
Ages estimated with the EAGLES code from  and
and  .
.
4 Iron and barium abundances
We focus the analysis on the Fe ([Fe/H]) and Ba ([Ba/H]) abundances on PMS stars with Teff greater than 4400 K. This threshold helps to avoid the strong contribution of molecular bands (Biazzo et al. 2017). Additionally, we selected stars with veiling lower than ∼0.2 to minimize uncertainties caused by the veiling contribution. Unfortunately, this initial selection criteria, prevented us from having targets in every analyzed cluster. Therefore, our sample was ultimately comprised of:
Six targets observed with X-Shooter: MY Lup, RECX 11, RX J0438.6+1546, RY Lup, SSTc2dJ160830.7-382827, and Sz 68;
Two targets observed with UVES: CS Cha and CV Cha;
Eight targets observed with ESPRESSO: CHX 18N, LkCa 15, MY Lup, RECX 11, RX J0438.6+1546, RY Lup, and SSTc2dJ160830.7-382827.
We derived [Fe/H] and [Ba/H] through the spectral synthesis method (Biazzo et al. 2017). The Fe abundances were derived using the open-source spectral analysis framework iSPEC (Blanco-Cuaresma et al. 2014; Blanco-Cuaresma 2019), in conjunction with the radiative transfer code MOOG (Sneden et al. 2012). Synthetic spectra were generated using the Kurucz (2005) set of model atmospheres. We adopted the Asplund et al. (2009) solar abundances and the GES line list with hyperfine structure and isotopes (Heiter et al. 2021). For this analysis, we chose the wavelength window between 5520 Å and 6800 Å.
For the Ba abundance, we employed spectral synthesis using the MOOG code (Sneden et al. 2012) and Asplund et al. (2009) model atmosphere. We considered the spectral synthesis of the Ba II line at λ = 5853.7 Å, which is known to be strong, isolated, and not affected by NLTE effects (e.g., Mashonkina et al. 2007). To achieve the best possible result, we included the hyperfine structure and isotopic shift provided by McWilliam (1998) in our analysis. We adopted the isotopic solar mixture by Anders & Grevesse (1989) and, as done for the Fe abundance, we considered the solar Ba abundance from Asplund et al. (2009).
The limb-darkening coefficients were taken from Claret et al. (2012). We estimated the microturbulence, ξ, and macroturbulence, vmac, using the relations of Dutra-Ferreira et al. (2016) and Brewer et al. (2016), respectively. The values of ξ and vmac for the selected targets are shown in Table B.1.
Table 2 presents the results of our [Fe/H] and [Ba/H] analysis. For the ESPRESSO and UVES data, the table reports the mean results across the multi-epoch values, obtained from the individual spectra. It also includes uncertainties related to the best-fit model (σ1) and to the errors in the stellar parameters (σ2). For more details (see Sect. 4.1). In Table 3, we show the mean [Fe/H] and [Ba/H] values along with their standard deviation for the respective clusters. For these calculations, we assigned one value per target. For objects with multi-instrument observations, we considered the average of the two independent measurements.
4.1 Error estimates
There are two sources of uncertainty in the abundances derived from spectral synthesis: (i) errors associated with the fitting procedure and (ii) uncertainties arising from the choice of the atmospheric parameters. In the case of Fe abundance, the first source of uncertainty, which also includes errors in the continuum placement, is about 0.05 dex for ESPRESSO, and 0.1–0.2 dex for UVES and X-Shooter. In the case of Ba, the uncertainties are ∼0.1 dex for ESPRESSO and UVES, ∼0.15 dex for X-Shooter. To quantify the impact of stellar parameters (Teff, logg, ξ, and v sin i) on the abundance measurement, we changed each quantity separately and evaluated the corresponding change in the derived abundance. Specifically, a change of ±60 K in Teff for ESPRESSO data, and ±100 K for UVES and X-Shooter spectra, resulted in Fe variations of 0.04, 0.03, and 0.05 dex across the three instruments. For Ba, the corresponding errors ranged from 0.05 to 0.06 dex. Varying logg by ±0.15 dex led to Fe abundance variations of 0.02–0.03 dex, and Ba variations of 0.02–0.08 dex. Finally, a ±2 km/s change in v sin i contributed as 0.01–0.04 dex in Fe uncertainties and 0.02–0.04 dex in Ba uncertainties. Considering ξ = 0 km/s instead 2 km/s, we obtained an error on [Fe/H] of 0.03–0.07 dex, and on [Ba/H] of about 0.04–0.13 dex. The cumulative uncertainties can be obtained by summing in quadrature the different contributions (see Table 2).
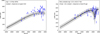 |
Fig. 6 Example of Li pattern fitting: the case of the Lupus SFR. The left panel shows the case in which the age was determined using the |


Fe and Ba abundances measured through spectral synthesis.
Mean Fe and Ba abundances with standard deviations for four SFRs.
4.2 Iron abundance in the context of nearby SFRs
Metallicity plays a crucial role in shaping stellar evolution and possible Galactic chemical enrichment within SFRs. Recent studies have shown that Fe abundance of nearby (<500 pc) YOCs ranges between approximately −0.2 to 0.3 dex. The youngest associations (≲100 Myr) are generally clustered to the lowest values (Biazzo et al. 2011b; Spina et al. 2014, 2017).
In this work, we find slightly subsolar Fe abundance for our SFRs (Table 3), with a value in line with the recent studies cited above, although our dispersion is somewhat high. In particular, for Cha I, we find [Fe/H]=−0.08 dex, which is consistent with the value reported by Spina et al. (2014, 2017). For the Taurus association, we find [Fe/H] = −0.07 dex, again in agreement within the uncertainties with D’Orazi et al. (2011). For Lupus we find [Fe/H]=−0.14 dex, which agrees within the errors with Biazzo et al. (2017) and Santos et al. (2008). Moreover, we present the first metallicity estimate for the η Cha SFR, finding a value of −0.08 dex, consistent with that of Cha I.
Figure 7 displays the [Fe/H] distribution of young open clusters and SFRs in the solar neighborhood within a distance of 500 pc and age smaller than 10 Myr. The black line represents the distribution based on the data from Spina et al. (2014), where our measurements have replaced those for the clusters in common (i.e., Cha I, Lupus, Taurus; see Table 3). For comparison, the original distribution from Spina et al. (2014) is overplotted as a dashed red line. Our results are consistent with their estimates, yielding a median [Fe/H] = –0.06 ± 0.03 dex for our combined sample (indicated by a vertical dashed black line and an error bar) compared to –0.057 ± 0.03 dex for the original Spina et al. (2014) dataset (vertical dotted red line). The histograms reveal that the majority of the observed young sources exhibit subsolar metallicities, with both distributions showing a prominent peak around [Fe/H]=−0.05 dex.
The common metal-poor composition of these young environments, which are not characteristic of the local ISM, might be the result of a complex interplay of chemical processes involving a wide area of the Galactic disk (Spina et al. 2017).
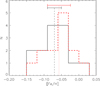 |
Fig. 7 [Fe/H] distribution of the open clusters and SFRs in the solar neighborhood within a distance of 500 pc and age lower than 10 Myr. The histogram bin size is 0.03. The dashed red line represents data from Spina et al. (2014), while the solid black line shows the same dataset after replacing the values for the clusters in common with our own measurements. The vertical lines and an error bars indicate the median values and the corresponding median absolute deviations. |
4.3 The barium abundance conundrum
Previous works have shown that the Ba abundance in star-forming regions and young associations increases with decreasing age, reaching values up ∼0.6–0.7 dex (e.g., D’Orazi et al. 2009; Biazzo et al. 2017; Baratella et al. 2021). This remarkably high enhancement cannot be explained by standard nucleosynthesis and galactic chemical evolution (GCE), nor by NLTE effects.
In this work, we have homogeneously measured the [Ba/H] abundance in four very young stellar associations (<10 Myr). As in the previous studies, we find an overabundance of Ba (Table 3). Specifically, for Lupus [Ba/H]=+0.69 dex, which is in perfect agreement, within the error, with the value of ∼0.7 dex reported by Biazzo et al. (2007). To our knowledge, no previous studies focusing on Ba abundance have been published to date for the SFRs Taurus, Cha I, and η Cha. Here, we determined the mean [Ba/H] in these regions finding 0.73 dex, 0.75 dex, and 0.64 dex, respectively. However, it should be noted that the value of 0.64 dex is based on observations of a single star (RECX 11) using two different instruments; therefore, it might not be representative of the entire region.
In Fig. 8, we plot our mean cluster [Ba/H] values as function of age (black dots), together with the results obtained by other authors: Biazzo et al. 2017 (blue asterisk), Spina et al. 2021 (red triangles), Baratella et al. 2021 (purple crosses), and Magrini et al. 2023 (cyan triangles). We selected SFRs and clusters located at Galactocentric distances between 7.5 and of 9 pc. Moreover, we displayed the [Ba/H] in SFRs and stellar clusters with an age from few Myr up to 10 Gyr. We also compare the observations with the prediction of the GCE of Magrini et al. (2021) at different RGC (8 and 10 kpc). The GCE models used in this plot incorporate s-process yields from the FRUITY models, which are based on an exponentially decreasing convective velocity profile at the inner border of the convective envelope (Cristallo et al. 2009), as well as from the updated MAGN models (Vescovi et al. 2020). The latter include the effects of magnetic-field-induced mixing. The GCE models can reproduce data of clusters older than ∼100 Myr quite well. However, for younger clusters and associations, the high [Ba/H] values observed, are systematically underpredicted by models.
A promising mechanism of production of heavy elements is the i-process, proposed by various authors (e.g., Mishenina et al. 2013; D’Orazi et al. 2017). This process is characterized by neutron density intermediate between those of s- and r-processes. Rich i-process nucleosynthesis can occurs during the early AGB phase of low-metallicy, low-mass stars (Choplin et al. 2021), although other types of stars (e.g., super AGB, rapidly-accreting white dwarf, massive stars) have also been proposed as possible i-process hosts (Baratella et al. 2021 and reference therein). However, further theoretical models are needed.
Baratella et al. (2021) investigated whether stellar activity, a strong magnetic field, or the first ionization potential effect could explain the high peculiar Ba abundance. They concluded that these factors play a role, but there is still no convincing evidence that any of them provide a definitive solution. Recently, Sheminova et al. (2024), analyzing 13 solar-type F, G, and K-type stars in the thin disk of the Galaxy, with ages from 2 Gyr to 14 Gyr, confirmed the increase in the Ba abundance with increasing chromospheric activity. This suggests that it is crucial to adopt a more complex atmosphere model that includes the magnetic structure to obtain more reliable Ba abundances. In any case, at present, the high [Ba/H] values in the SFRs still remains a conundrum.
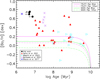 |
Fig. 8 [Ba/H] as a function of the age of Galactic open clusters and associations. The black dots represent the estimates derived in this work. Arrows indicate upper limits in age. The other symbols represent estimates from the literature, as highlighted in the figure. When the same cluster was analyzed by more than one author, we considered the values obtained by Magrini et al. (2023). The GCE models with yields from the FRUITY (Cristallo et al. 2009; magenta lines) and MAGN models (Vescovi et al. 2020; green lines) are also overplotted. |
5 Conclusions
We present the results of a study on elemental abundances in several nearby star-forming regions, namely Cha I, η Cha, Lupus, Taurus, Orion OB1a, Orion OB1b, σ Ori, and CrA. We used spectroscopic data gathered as part of the PENELLOPE program, obtained using the instruments ESPRESSO, UVES, and X-Shooter, all mounted on the VLT. Our main results can be summarized as follows:
We measured the EW of the Li line at λ= 6707.8 Å. For all 75 targets in our sample, we corrected the measurements for the contribution of veiling, obtaining an average
 value of 170 mÅ;
Analysis of ESPRESSO and UVES multi-epoch spectra reveals significant EWLi variability. We identified 26 targets with raw variations
 , which could be linked to chromospheric activity. Additionally, in a subsample of 30 sources, the veiling-corrected variations
  appear to be more pronounced. The correlation between
  and ∆r670 suggests that variations in the accretion process might play a significant role in driving the observed EWLi changes;
We estimated the abundance of 7Li from the corrected EWs, for the targets in the sample with Teff higher than 3000 K. For the stars with temperature ranging between 3000 K and 4000 K, we measured the upper limits on A(Li). We also emphasized the crucial role of the veiling contribution in the determination of A(Li), which leads to an average correction of ∼0.74 dex;
We identified seven possible Li-depleted sources: Sz 10 in Cha I, Sz 104, Sz 69, and SS61344.1-373646 in Lupus, CVSO-176, CVSO-90 in Orion OB1b, and ECHAJ0844.2-7833 in η Cha;
Using the EAGLES code, we attempted to estimate the ages of all SFRs, based on their Li EWs, both including and neglecting the contribution of veiling. For all the young regions, we found differences of several Myr, reaching up to 25 Myr, between the two cases. This result underscores the crucial importance of accounting for veiling in age determinations;
We determined the mean Fe and Ba abundance of the SFRs Lupus, Taurus, Cha I, and η Cha. We find slightly subsolar Fe abundance values. This result confirms recent studies that have reported the youngest (≲100 Myr) and nearby (<500 pc) stellar associations exhibit a general tendency to cluster around subsolar Fe values. We found overabundance of the mean Ba in these SFRs, up to ∼0.75 dex, which still remains a conundrum, as no recent theory has been able to predict such a high value at young ages.
The results presented of this work demonstrate that veiling significantly impacts both A(Li) and age determinations, while also inducing notable epoch-to-epoch variations in the Li EW. These findings emphasize the necessity for multi-epochs observations of PMS stars and more rigorous investigations into veiling-induced systematic effects. Furthermore, our discovery of Ba overabundances in three additional young regions, extending beyond previously documented cases, strengthens the empirical evidence for this enhancement. This highlights the need for expanded theoretical and observational studies of star-forming regions and young clusters (age < 100 Myr) to elucidate the physical origin of the so-called “Ba puzzle.” Finally, this work provides a high-resolution fundamental benchmark for future large-scale surveys. Our results will be essential for the interpretation of upcoming studies of young clusters conducted with the new 4MOST facility and the forthcoming MOONS spectrograph, both of which operate at lower spectral resolutions.
Data availability
Tables A.1, A.2, and A.3 are available at the CDS via https://cdsarc.cds.unistra.fr/viz-bin/cat/J/A+A/709/A144
Acknowledgements
This work has been financially supported by the grants INAF 2022 TRAME@JWST (TRacing the Accretion Metallicity rElationship with NIRSpec@JWST; PI: K. Biazzo), Can AGB stellar winds unveil the origin of the unidentified infrared emission bands? (PI: R. Carini), YSOs Outflows Disks and Accretion (YODA; PI: B. Nisini), by the European Union (ERC, WANDA, 101039452), and by and NextGenerationEU, M4C2 1.2 CUP C83C25000450006 within the project Tracing the staR and plAnet formation in different Circum-stellar Environments (TRACE; PI: K. Biazzo). Views and opinions expressed are however those of the author(s) only and do not necessarily reflect those of the European Union or the European Research Council Executive Agency. Neither the European Union nor the granting authority can be held responsible for them. his work was partly funded by the Deutsche Forschungsgemeinschaft (DFG, German Research Foundation) in the framework of the YTTHACA Project 469334657 under the project code MA 8447/1-1. This work was also supported by the NKFIH NKKP grant ADVANCED 149943 and the NKFIH excellence grant TKP2021-NKTA-64. Project no.149943 has been implemented with the support provided by the Ministry of Culture and Innovation of Hungary from the National Research, Development and Innovation Fund, financed under the NKKP ADVANCED funding scheme. This work has been also supported by Large Gran INAF-2024 “Spectral Key features of Young stellar objects: Wind-Accretion LinKs Explored in the infraRed (SKYWALKER)”. I.M. is funded by grant PID2022-138366NA-I00, by the Spanish Ministry of Science and Innovation/State Agency of Research MCIN/AEI/10.13039/501100011033 and by the European Union. JFG was supported by Fundação para a Ciência e Tecnologia (FCT) through the research grants UID/04434/2025 This work benefited from discussions with the ODYSSEUS team (HST AR-16129), https://sites.bu.edu/odysseus/
References
- Anders, E., & Grevesse, N. 1989, Geochim. Cosmochim. Acta, 53, 197 [Google Scholar]
- Asplund, M., Grevesse, N., Sauval, A. J., & Scott, P. 2009, ARA&A, 47, 481 [CrossRef] [Google Scholar]
- Babcock, H. D. 1959, ApJ, 130, 364 [Google Scholar]
- Baraffe, I., Homeier, D., Allard, F., & Chabrier, G. 2015, A&A, 577, A42 [NASA ADS] [CrossRef] [EDP Sciences] [Google Scholar]
- Baraffe, I., Pratt, J., Goffrey, T., et al. 2017, ApJ, 845, L6 [Google Scholar]
- Baratella, M., D’Orazi, V., Sheminova, V., et al. 2021, A&A, 653, A67 [NASA ADS] [CrossRef] [EDP Sciences] [Google Scholar]
- Biazzo, K., Frasca, A., Catalano, S., & Marilli, E. 2007, Astron. Nachr., 328, 938 [NASA ADS] [CrossRef] [Google Scholar]
- Biazzo, K., Randich, S., & Palla, F. 2011a, A&A, 525, A35 [NASA ADS] [CrossRef] [EDP Sciences] [Google Scholar]
- Biazzo, K., Randich, S., Palla, F., & Briceño, C. 2011b, A&A, 530, A19 [NASA ADS] [CrossRef] [EDP Sciences] [Google Scholar]
- Biazzo, K., Frasca, A., Alcalá, J. M., et al. 2017, A&A, 605, A66 [NASA ADS] [CrossRef] [EDP Sciences] [Google Scholar]
- Bildsten, L., Brown, E. F., Matzner, C. D., & Ushomirsky, G. 1997, ApJ, 482, 442 [NASA ADS] [CrossRef] [Google Scholar]
- Blanco-Cuaresma, S. 2019, MNRAS, 486, 2075 [Google Scholar]
- Blanco-Cuaresma, S., Soubiran, C., Heiter, U., & Jofré, P. 2014, A&A, 569, A111 [CrossRef] [EDP Sciences] [Google Scholar]
- Bodenheimer, P. 1965, ApJ, 142, 451 Borrero, J. M. 2008, ApJ, 673, 470 [Google Scholar]
- Bouvier, J., Grankin, K. N., Alencar, S. H. P., et al. 2003, A&A, 409, 169 [NASA ADS] [CrossRef] [EDP Sciences] [Google Scholar]
- Brewer, J. M., Fischer, D. A., Valenti, J. A., & Piskunov, N. 2016, ApJS, 225, 32 [Google Scholar]
- Briceño, C., Calvet, N., Hernández, J., et al. 2019, AJ, 157, 85 [CrossRef] [Google Scholar]
- Busso, M., Gallino, R., & Wasserburg, G. J. 1999, ARA&A, 37, 239 [Google Scholar]
- Caballero, J. A. 2018, RNAAS, 2, 25 [Google Scholar]
- Campbell-White, J., Manara, C. F., Sicilia-Aguilar, A., et al. 2023, A&A, 673, A80 [NASA ADS] [CrossRef] [EDP Sciences] [Google Scholar]
- Chen, H. Y., & Chen, W. P. 2025, New A, 120, 102421 [Google Scholar]
- Choplin, A., Siess, L., & Goriely, S. 2021, A&A, 648, A119 [NASA ADS] [CrossRef] [EDP Sciences] [Google Scholar]
- Claret, A., Hauschildt, P. H., & Witte, S. 2012, A&A, 546, A14 [NASA ADS] [CrossRef] [EDP Sciences] [Google Scholar]
- Costigan, G., Vink, J. S., Scholz, A., Ray, T., & Testi, L. 2014, MNRAS, 440, 3444 [NASA ADS] [CrossRef] [Google Scholar]
- Cristallo, S., Straniero, O., Gallino, R., et al. 2009, ApJ, 696, 797 [NASA ADS] [CrossRef] [Google Scholar]
- Dekker, H., D’Odorico, S., Kaufer, A., Delabre, B., & Kotzlowski, H. 2000, SPIE Conf. Ser., 4008, 534 [Google Scholar]
- Deliyannis, C. P., Steinhauer, A., & Jeffries, R. D. 2002, ApJ, 577, L39 [Google Scholar]
- D’Orazi, V., Biazzo, K., & Randich, S. 2011, A&A, 526, A103 [NASA ADS] [CrossRef] [EDP Sciences] [Google Scholar]
- D’Orazi, V., Biazzo, K., Desidera, S., et al. 2012, MNRAS, 423, 2789 [Google Scholar]
- D’Orazi, V., Magrini, L., Randich, S., et al. 2009, ApJ, 693, L31 [Google Scholar]
- D’Orazi, V., De Silva, G. M., & Melo, C. F. H. 2017, A&A, 598, A86 [Google Scholar]
- Dutra-Ferreira, L., Pasquini, L., Smiljanic, R., Porto de Mello, G. F., & Steffen, M. 2016, A&A, 585, A75 [NASA ADS] [CrossRef] [EDP Sciences] [Google Scholar]
- Franciosini, E., Randich, S., de Laverny, P., et al. 2022, A&A, 668, A49 [NASA ADS] [CrossRef] [EDP Sciences] [Google Scholar]
- Frasca, A., Biazzo, K., Lanzafame, A. C., et al. 2015, A&A, 575, A4 [NASA ADS] [CrossRef] [EDP Sciences] [Google Scholar]
- Frasca, A., Biazzo, K., Alcalá, J. M., et al. 2017, A&A, 602, A33 [NASA ADS] [CrossRef] [EDP Sciences] [Google Scholar]
- Frasca, A., Guillout, P., Klutsch, A., et al. 2018, A&A, 612, A96 [NASA ADS] [CrossRef] [EDP Sciences] [Google Scholar]
- Goodson, A. P., Winglee, R. M., & Böhm, K.-H. 1997, ApJ, 489, 199 [NASA ADS] [CrossRef] [Google Scholar]
- Gray, D. F. 1994, PASP, 106, 1248 [NASA ADS] [CrossRef] [Google Scholar]
- Gutiérrez Albarrán, M. L., Montes, D., Tabernero, H. M., et al. 2024, A&A, 685, A83 [NASA ADS] [CrossRef] [EDP Sciences] [Google Scholar]
- Hartigan, P., Kenyon, S. J., Hartmann, L., et al. 1991, ApJ, 382, 617 [Google Scholar]
- Hartmann, L., Herczeg, G., & Calvet, N. 2016, ARA&A, 54, 135 [Google Scholar]
- Heiter, U., Lind, K., Bergemann, M., et al. 2021, A&A, 645, A106 [EDP Sciences] [Google Scholar]
- Jacobson, H. R., & Friel, E. D. 2013, AJ, 145, 107 [Google Scholar]
- Jacobson, H. R., Friel, E. D., & Pilachowski, C. A. 2011, in American Astronomical Society Meeting Abstracts, 217, 152.39 [Google Scholar]
- Jeffries, R. D. 2006, in Chemical Abundances and Mixing in Stars in the Milky Way and its Satellites, eds. S. Randich, & L. Pasquini, 163 [Google Scholar]
- Jeffries, R. D., Jackson, R. J., Wright, N. J., et al. 2023, MNRAS, 523, 802 [NASA ADS] [CrossRef] [Google Scholar]
- Joy, A. H. 1945, Contrib. Mount Wilson Observ./Carnegie Inst. Washington, 709, 1 [Google Scholar]
- Karakas, A. I., Marino, A. F., & Nataf, D. M. 2014, ApJ, 784, 32 [Google Scholar]
- Kobayashi, C., Karakas, A. I., & Lugaro, M. 2020, ApJ, 900, 179 [Google Scholar]
- Kurucz, R. L. 2005, Mem. Soc. Astron. Ital. Suppl., 8, 14 [Google Scholar]
- Lim, B., Sung, H., Kim, J. S., et al. 2016, ApJ, 831, 116 [NASA ADS] [CrossRef] [Google Scholar]
- Lind, K., Asplund, M., & Barklem, P. S. 2009, A&A, 503, 541 [NASA ADS] [CrossRef] [EDP Sciences] [Google Scholar]
- Luhman, K. L. 2007, ApJS, 173, 104 [Google Scholar]
- Luhman, K. L. 2023, AJ, 165, 37 [NASA ADS] [CrossRef] [Google Scholar]
- Magrini, L., Vescovi, D., Casali, G., et al. 2021, A&A, 646, L2 [EDP Sciences] [Google Scholar]
- Magrini, L., Viscasillas Vázquez, C., Spina, L., et al. 2023, A&A, 669, A119 [NASA ADS] [CrossRef] [EDP Sciences] [Google Scholar]
- Maiorca, E., Randich, S., Busso, M., Magrini, L., & Palmerini, S. 2011, ApJ, 736, 120 [NASA ADS] [CrossRef] [Google Scholar]
- Manara, C. F., Fedele, D., Herczeg, G. J., & Teixeira, P. S. 2016, A&A, 585, A136 [NASA ADS] [CrossRef] [EDP Sciences] [Google Scholar]
- Manara, C. F., Frasca, A., Venuti, L., et al. 2021, A&A, 650, A196 [NASA ADS] [CrossRef] [EDP Sciences] [Google Scholar]
- Mashonkina, L. I., Vinogradova, A. B., Ptitsyn, D. A., Khokhlova, V. S., & Chernetsova, T. A. 2007, Astron. Rep., 51, 903 [NASA ADS] [CrossRef] [Google Scholar]
- McWilliam, A. 1998, AJ, 115, 1640 [NASA ADS] [CrossRef] [Google Scholar]
- Mentuch, E., Brandeker, A., van Kerkwijk, M. H., Jayawardhana, R., & Hauschildt, P. H. 2008, ApJ, 689, 1127 [NASA ADS] [CrossRef] [Google Scholar]
- Mishenina, T., Korotin, S., Carraro, G., Kovtyukh, V. V., & Yegorova, I. A. 2013, MNRAS, 433, 1436 [Google Scholar]
- Moore, C. S., Uitenbroek, H., Rempel, M., Criscuoli, S., & Rast, M. P. 2015, ApJ, 799, 150 [Google Scholar]
- Mulders, G. D., Pascucci, I., Apai, D., Frasca, A., & Molenda-Żakowicz, J. 2016, AJ, 152, 187 [NASA ADS] [CrossRef] [Google Scholar]
- Muzerolle, J., D’Alessio, P., Calvet, N., & Hartmann, L. 2004, ApJ, 617, 406 [CrossRef] [Google Scholar]
- Nguyen, D. C., Scholz, A., van Kerkwijk, M. H., Jayawardhana, R., & Brandeker, A. 2009, ApJ, 694, L153 [Google Scholar]
- Palla, F., Randich, S., Pavlenko, Y. V., Flaccomio, E., & Pallavicini, R. 2007, ApJ, 659, L41 [NASA ADS] [CrossRef] [Google Scholar]
- Pepe, F., Cristiani, S., Rebolo, R., et al. 2021, A&A, 645, A96 [NASA ADS] [CrossRef] [EDP Sciences] [Google Scholar]
- Pinsonneault, M. 1997, ARA&A, 35, 557 [Google Scholar]
- Piscarreta, L., Beccari, G., Claes, R. A. B., et al. 2025, A&A, 703, A133 [NASA ADS] [CrossRef] [EDP Sciences] [Google Scholar]
- Pittman, C. V., Espaillat, C. C., Robinson, C. E., et al. 2022, AJ, 164, 201 [NASA ADS] [CrossRef] [Google Scholar]
- Randich, S., & Magrini, L. 2021, Front. Astron. Space Sci., 8, 6 [NASA ADS] [CrossRef] [Google Scholar]
- Randich, S., Gilmore, G., Magrini, L., et al. 2022, A&A, 666, A121 [NASA ADS] [CrossRef] [EDP Sciences] [Google Scholar]
- Roman-Duval, J., Proffitt, C. R., Taylor, J. M., et al. 2020, RNAAS, 4, 205 [NASA ADS] [Google Scholar]
- Santos, N. C., Melo, C., James, D. J., et al. 2008, A&A, 480, 889 [CrossRef] [EDP Sciences] [Google Scholar]
- Schwabe, H. 1844, Astron. Nachr., 21, 233 [Google Scholar]
- Shchukina, N., Sukhorukov, A., & Trujillo Bueno, J. 2016, A&A, 586, A145 [NASA ADS] [CrossRef] [EDP Sciences] [Google Scholar]
- Sheminova, V., Baratella, M., & D’Orazi, V. 2024, A&A, 688, A227 [NASA ADS] [CrossRef] [EDP Sciences] [Google Scholar]
- Simon, M., Ghez, A. M., & Leinert, C. 1993, ApJ, 408, L33 [Google Scholar]
- Sneden, C., Bean, J., Ivans, I., Lucatello, S., & Sobeck, J. 2012, MOOG: LTE line analysis and spectrum synthesis, Astrophysics Source Code Library [record ascl:1202.009] [Google Scholar]
- Somers, G., & Pinsonneault, M. H. 2015, MNRAS, 449, 4131 [NASA ADS] [CrossRef] [Google Scholar]
- Song, I., Bessell, M. S., & Zuckerman, B. 2002, ApJ, 581, L43 [Google Scholar]
- Spina, L., Randich, S., Palla, F., et al. 2014, A&A, 568, A2 [NASA ADS] [CrossRef] [EDP Sciences] [Google Scholar]
- Spina, L., Randich, S., Magrini, L., et al. 2017, A&A, 601, A70 [NASA ADS] [CrossRef] [EDP Sciences] [Google Scholar]
- Spina, L., Nordlander, T., Casey, A. R., et al. 2020, ApJ, 895, 52 [Google Scholar]
- Spina, L., Ting, Y. S., De Silva, G. M., et al. 2021, MNRAS, 503, 3279 [CrossRef] [Google Scholar]
- Stout-Batalha, N. M., Batalha, C. C., & Basri, G. S. 2000, ApJ, 532, 474 [Google Scholar]
- Swastik, C., Banyal, R. K., Narang, M., et al. 2022, AJ, 164, 60 [CrossRef] [Google Scholar]
- Vernet, J., Dekker, H., D’Odorico, S., et al. 2011, A&A, 536, A105 [NASA ADS] [CrossRef] [EDP Sciences] [Google Scholar]
- Vescovi, D., Cristallo, S., Busso, M., & Liu, N. 2020, ApJ, 897, L25 [Google Scholar]
- Yan, T.-S., Shi, J.-R., Wang, L., et al. 2022, ApJ, 929, L14 [NASA ADS] [CrossRef] [Google Scholar]
- Zapatero Osorio, M. R., Béjar, V. J. S., Pavlenko, Y., et al. 2002, A&A, 384, 937 [NASA ADS] [CrossRef] [EDP Sciences] [Google Scholar]
- Zhou, Z.-M., Shi, J.-R., Bi, S.-L., et al. 2025, ApJ, 986, 44 [Google Scholar]
Throughout the paper, the abundance of the X element is given as ![Mathematical equation: ${\rm{[X/H] = log}}{{{\rm{A(X)}}} \over {{\rm{A(H)}}}}{\rm{ + 12}}$](/articles/aa/full_html/2026/05/aa59572-26/aa59572-26-eq53.png) , where log A(X) is the absolute abundance.
, where log A(X) is the absolute abundance.
In the usual notation A(Li) = log N(Li)/N(H) +12.
Appendix A Electronic Tables
This appendix provides a brief description of the tables associated with this work. The three tables correspond to the datasets obtained with UVES, ESPRESSO, and X-Shooter. Each table lists the target name, the observing epoch and date, the effective temperature, the veiling, the raw equivalent width of the Li line with its fitting uncertainty, the equivalent width corrected for iron blending and veiling, and the corresponding lithium abundance derived from the corrected values, accounting for NLTE effects. The tables are available at the CDS.
Appendix B Microturbulence (ξ) and macroturbulence (vmac) velocities
Microturbulence (ξ) and macroturbulence (vmac) velocities for the subsample of targets selected for [Fe/H] and [Ba/H] abundance measurements.
Appendix C Upper age limit estimates
The Li pattern fitting for the SFRs Cha I, η Cha, Taurus, Orion OB1a, Orion OB1b, σ Ori, and CrA. For each region, panel a of Fig. C.1 shows the case in which the age was determined using the  , while panel b shows the case in which the
  have been used. The solid black line represent the best-fit isochrone in the EWLi vs. Teff plane. The shaded region illustrates the model intrinsic dispersion at the best-fit age or its upper limit. The dashed black lines represent 95% upper and lower limits where no clear peak is observed. The blue dots show EWLi as a function of Teff with the uncertainties on EWLi measurements. The text in the top-left corner on the plot shows maximum likelihood age.
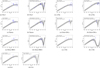 |
Fig. C.1 Li pattern fitting for the SFRs Cha I, η Cha and Taurus, Orion OB1a, Orion OB1b, σ Ori, and CrA. |
All Tables
Microturbulence (ξ) and macroturbulence (vmac) velocities for the subsample of targets selected for [Fe/H] and [Ba/H] abundance measurements.
All Figures
|
Fig. 1 Multipanel overview of the Li EWs for the eight SFRs (Cha I, η Cha, Lupus, Taurus, Orion OB1a, Orion OB1b, σ Ori, and CrA) in our sample. For each region, the left subpanel shows the Li EW versus Teff. The red squares represent the EW corrected for blending with the Fe line ( |
| In the text | |
|
Fig. 2
|
| In the text | |
|
Fig. 3 Variation in |
| In the text | |
|
Fig. 4 Variation in |
| In the text | |
|
Fig. 5 Multipanel overview of the Li abundance for the eight SFRs (Cha I, η Cha, Lupus, Taurus, Orion OB1a, Orion OB1b, σ Ori, and CrA). For each region, the left subpanel shows NLTE-corrected Li abundance as a function of effective temperature. Red squares and black dots represent the A(Li) values derived from |
| In the text | |
|
Fig. 6 Example of Li pattern fitting: the case of the Lupus SFR. The left panel shows the case in which the age was determined using the |
| In the text | |
|
Fig. 7 [Fe/H] distribution of the open clusters and SFRs in the solar neighborhood within a distance of 500 pc and age lower than 10 Myr. The histogram bin size is 0.03. The dashed red line represents data from Spina et al. (2014), while the solid black line shows the same dataset after replacing the values for the clusters in common with our own measurements. The vertical lines and an error bars indicate the median values and the corresponding median absolute deviations. |
| In the text | |
|
Fig. 8 [Ba/H] as a function of the age of Galactic open clusters and associations. The black dots represent the estimates derived in this work. Arrows indicate upper limits in age. The other symbols represent estimates from the literature, as highlighted in the figure. When the same cluster was analyzed by more than one author, we considered the values obtained by Magrini et al. (2023). The GCE models with yields from the FRUITY (Cristallo et al. 2009; magenta lines) and MAGN models (Vescovi et al. 2020; green lines) are also overplotted. |
| In the text | |
|
Fig. C.1 Li pattern fitting for the SFRs Cha I, η Cha and Taurus, Orion OB1a, Orion OB1b, σ Ori, and CrA. |
| In the text | |
Current usage metrics show cumulative count of Article Views (full-text article views including HTML views, PDF and ePub downloads, according to the available data) and Abstracts Views on Vision4Press platform.
Data correspond to usage on the plateform after 2015. The current usage metrics is available 48-96 hours after online publication and is updated daily on week days.
Initial download of the metrics may take a while.