Fig. 6
Download original image
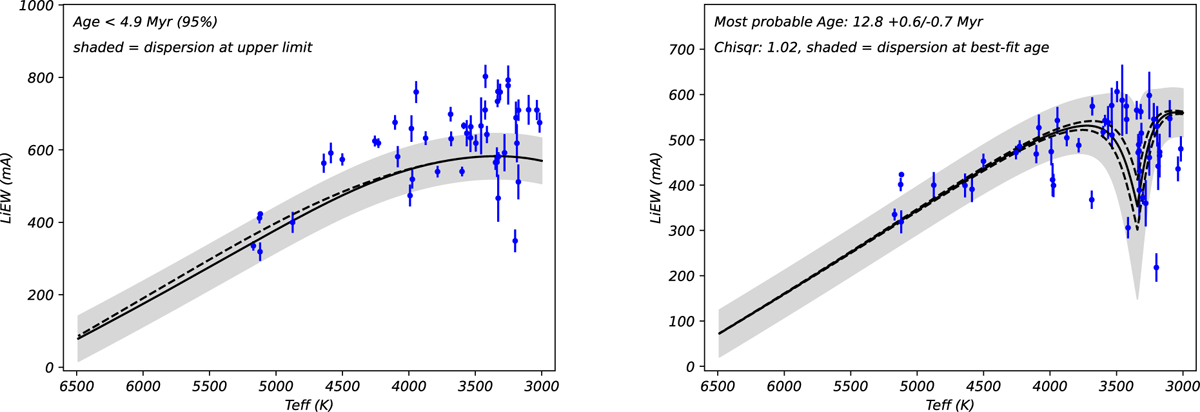
Example of Li pattern fitting: the case of the Lupus SFR. The left panel shows the case in which the age was determined using the ![]() , while the right panel shows the case in which the
, while the right panel shows the case in which the ![]() have been used. The solid black line represent the best-fit isochrone in the EWLi vs. Teff plane. The shaded region illustrates the model intrinsic dispersion at the best-fit age or its upper limit. The dashed black lines represent 95% upper and lower limits where no clear peak is observed. The blue dots show EW(Li) as a function of Teff with the uncertainties on EW(Li) measurements. The text in the top-left corner on the plot shows maximum likelihood age.
have been used. The solid black line represent the best-fit isochrone in the EWLi vs. Teff plane. The shaded region illustrates the model intrinsic dispersion at the best-fit age or its upper limit. The dashed black lines represent 95% upper and lower limits where no clear peak is observed. The blue dots show EW(Li) as a function of Teff with the uncertainties on EW(Li) measurements. The text in the top-left corner on the plot shows maximum likelihood age.
Current usage metrics show cumulative count of Article Views (full-text article views including HTML views, PDF and ePub downloads, according to the available data) and Abstracts Views on Vision4Press platform.
Data correspond to usage on the plateform after 2015. The current usage metrics is available 48-96 hours after online publication and is updated daily on week days.
Initial download of the metrics may take a while.