Open Access
Fig. 4
Download original image
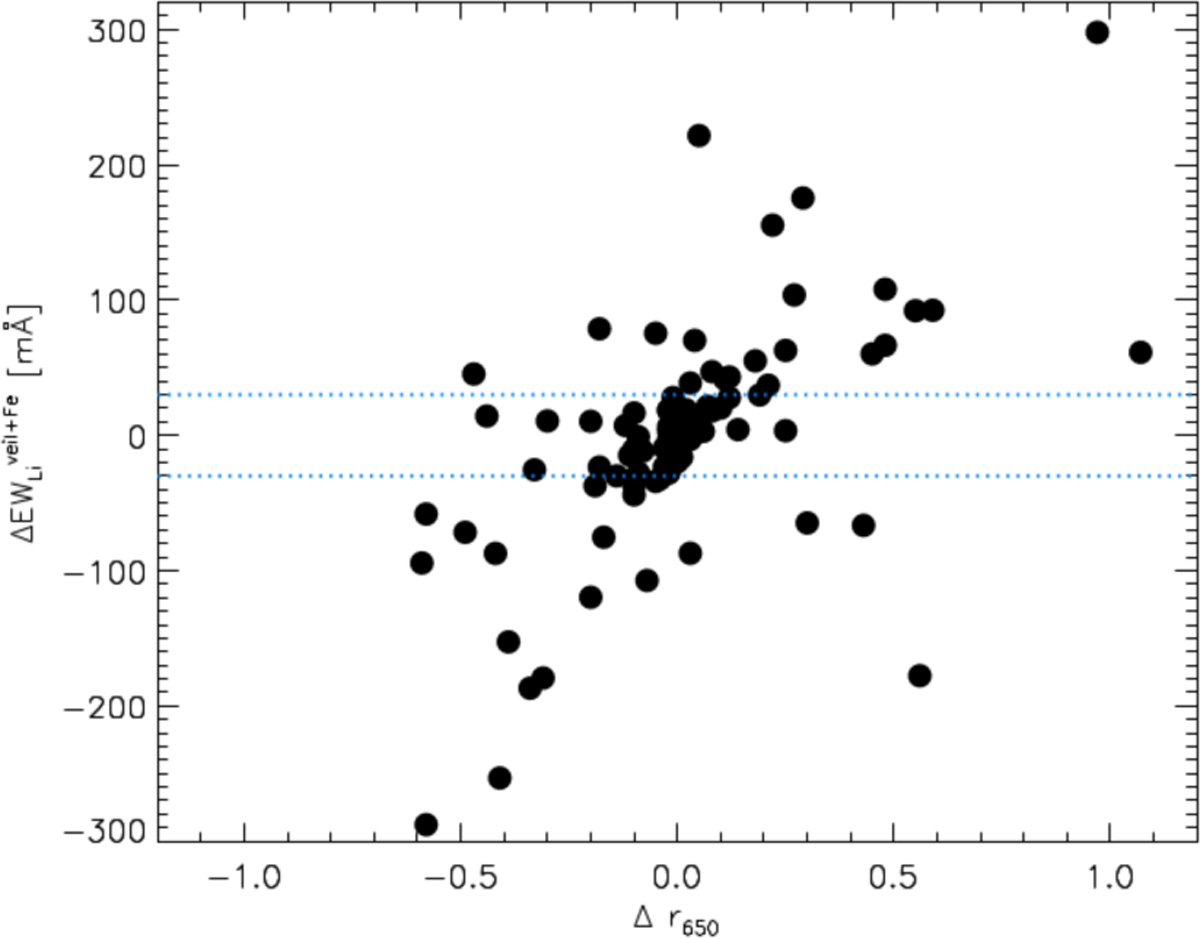
Variation in ![]() across the observing epochs as a function of veiling variations, for ESPRESSO and UVES data. The dotted blue lines represent the 3 σ values.
across the observing epochs as a function of veiling variations, for ESPRESSO and UVES data. The dotted blue lines represent the 3 σ values.
Current usage metrics show cumulative count of Article Views (full-text article views including HTML views, PDF and ePub downloads, according to the available data) and Abstracts Views on Vision4Press platform.
Data correspond to usage on the plateform after 2015. The current usage metrics is available 48-96 hours after online publication and is updated daily on week days.
Initial download of the metrics may take a while.