Fig. 7
Download original image
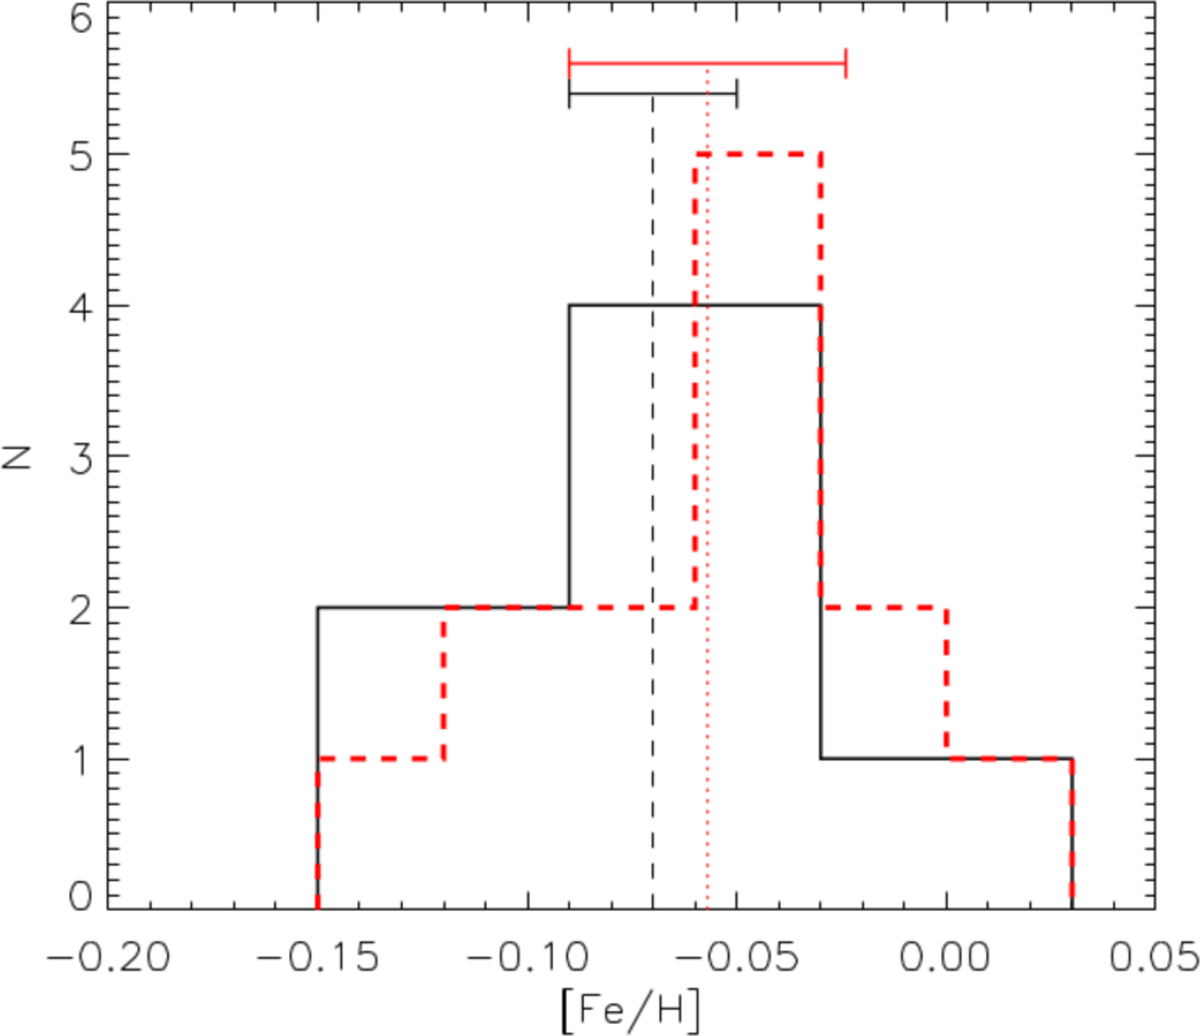
[Fe/H] distribution of the open clusters and SFRs in the solar neighborhood within a distance of 500 pc and age lower than 10 Myr. The histogram bin size is 0.03. The dashed red line represents data from Spina et al. (2014), while the solid black line shows the same dataset after replacing the values for the clusters in common with our own measurements. The vertical lines and an error bars indicate the median values and the corresponding median absolute deviations.
Current usage metrics show cumulative count of Article Views (full-text article views including HTML views, PDF and ePub downloads, according to the available data) and Abstracts Views on Vision4Press platform.
Data correspond to usage on the plateform after 2015. The current usage metrics is available 48-96 hours after online publication and is updated daily on week days.
Initial download of the metrics may take a while.