Fig. 5
Download original image
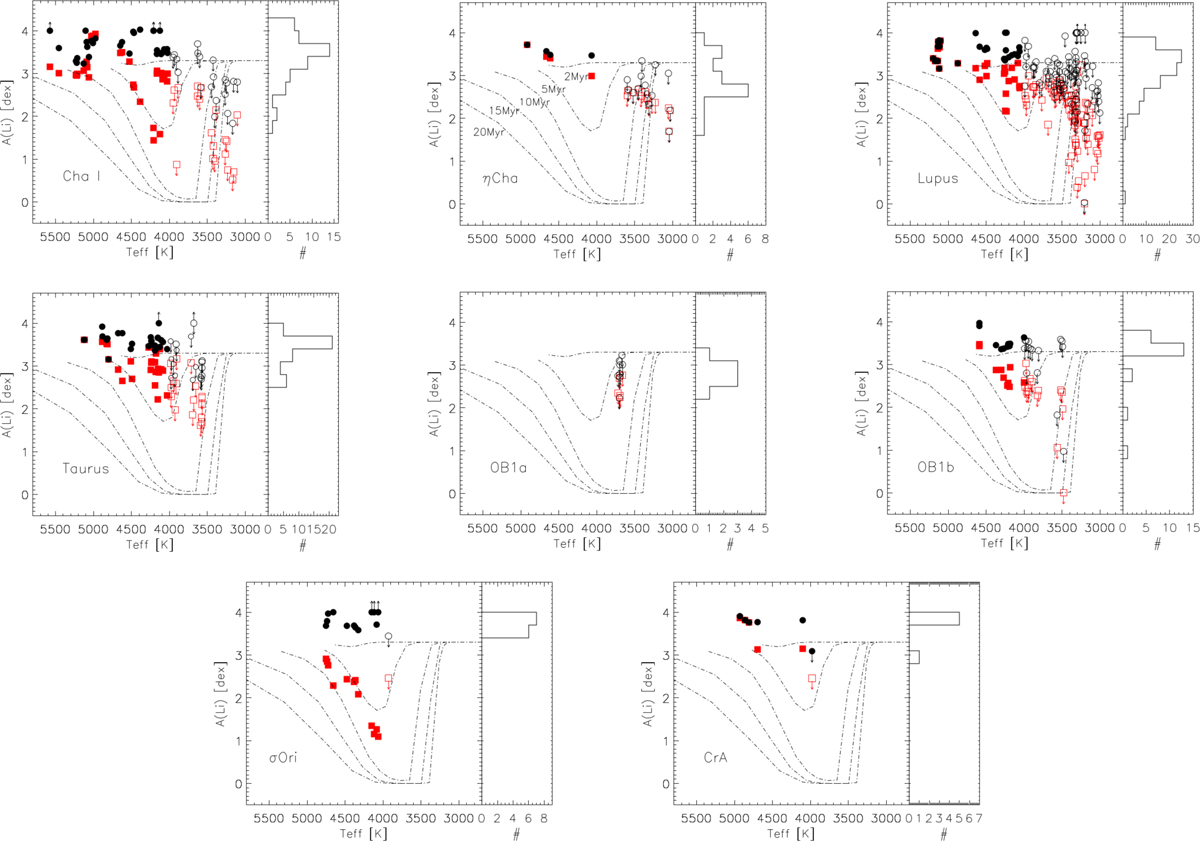
Multipanel overview of the Li abundance for the eight SFRs (Cha I, η Cha, Lupus, Taurus, Orion OB1a, Orion OB1b, σ Ori, and CrA). For each region, the left subpanel shows NLTE-corrected Li abundance as a function of effective temperature. Red squares and black dots represent the A(Li) values derived from ![]() and
and ![]() , respectively. K-type and M-type stars are plotted with filled and open symbols, respectively. The Li isochrones by Baraffe et al. (2015) in the 2–20 Myr range are overlaid with dot-dashed lines. Arrows refer to lower (stars whose final A(Li) value exceeds 4.0 dex, see text) or upper (due to the unresolved contribution of the FeI λ 6707.4 line) limits. Each right subpanel displays the histogram of the corresponding A(Li) distribution, corrected for veiling.
, respectively. K-type and M-type stars are plotted with filled and open symbols, respectively. The Li isochrones by Baraffe et al. (2015) in the 2–20 Myr range are overlaid with dot-dashed lines. Arrows refer to lower (stars whose final A(Li) value exceeds 4.0 dex, see text) or upper (due to the unresolved contribution of the FeI λ 6707.4 line) limits. Each right subpanel displays the histogram of the corresponding A(Li) distribution, corrected for veiling.
Current usage metrics show cumulative count of Article Views (full-text article views including HTML views, PDF and ePub downloads, according to the available data) and Abstracts Views on Vision4Press platform.
Data correspond to usage on the plateform after 2015. The current usage metrics is available 48-96 hours after online publication and is updated daily on week days.
Initial download of the metrics may take a while.