Fig. 1
Download original image
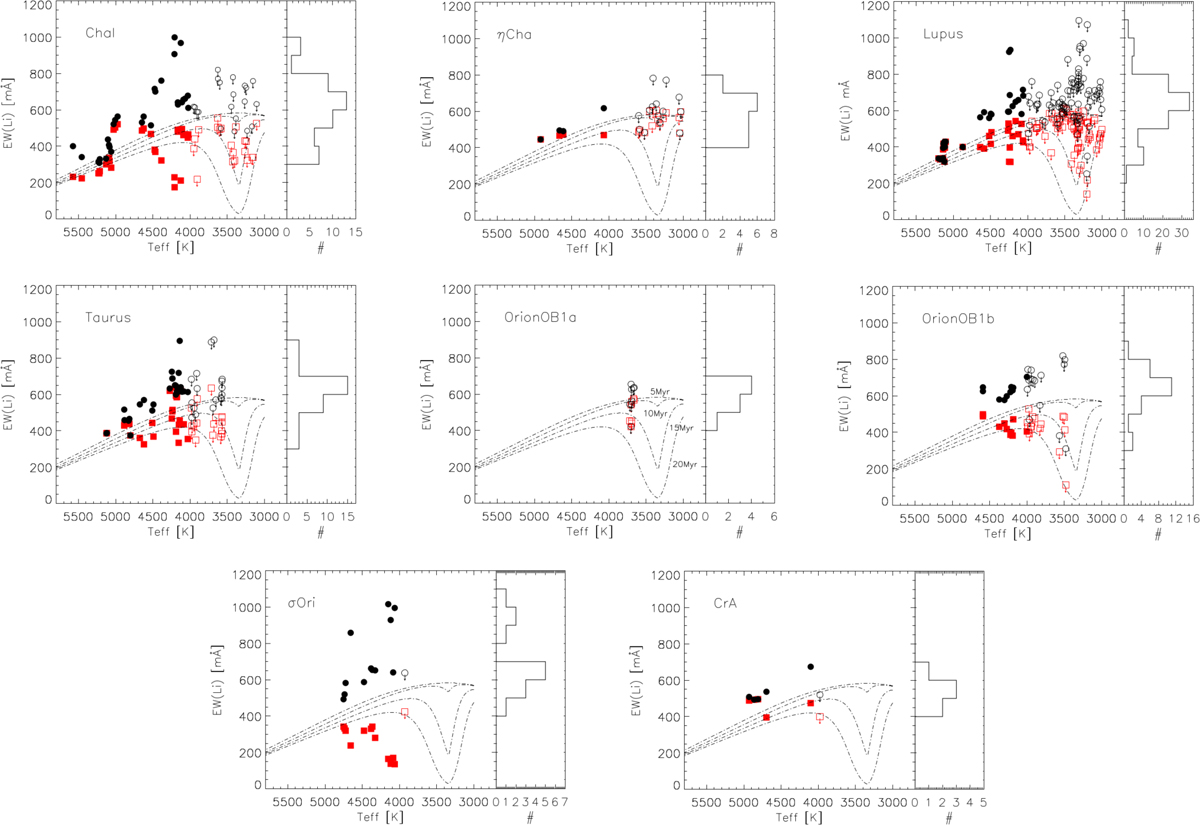
Multipanel overview of the Li EWs for the eight SFRs (Cha I, η Cha, Lupus, Taurus, Orion OB1a, Orion OB1b, σ Ori, and CrA) in our sample. For each region, the left subpanel shows the Li EW versus Teff. The red squares represent the EW corrected for blending with the Fe line (![]() ), the black dots represent the EW after further correction for spectral veiling
), the black dots represent the EW after further correction for spectral veiling ![]() . K-type (T ≥ 4000 K) and M-type (T < 4000 K) stars are denoted by filled and open symbols, respectively. Arrows indicate upper limits due to the unresolved contribution of the FeI λ6707.4 line. The empirical model isochrones by Jeffries et al. (2023) at 5, 10, 15, and 20 Myr are overplotted. The right subpanels display the corresponding
. K-type (T ≥ 4000 K) and M-type (T < 4000 K) stars are denoted by filled and open symbols, respectively. Arrows indicate upper limits due to the unresolved contribution of the FeI λ6707.4 line. The empirical model isochrones by Jeffries et al. (2023) at 5, 10, 15, and 20 Myr are overplotted. The right subpanels display the corresponding ![]() distribution.
distribution.
Current usage metrics show cumulative count of Article Views (full-text article views including HTML views, PDF and ePub downloads, according to the available data) and Abstracts Views on Vision4Press platform.
Data correspond to usage on the plateform after 2015. The current usage metrics is available 48-96 hours after online publication and is updated daily on week days.
Initial download of the metrics may take a while.