| Issue |
A&A
Volume 709, May 2026
|
|
|---|---|---|
| Article Number | A219 | |
| Number of page(s) | 15 | |
| Section | Galactic structure, stellar clusters and populations | |
| DOI | https://doi.org/10.1051/0004-6361/202659206 | |
| Published online | 22 May 2026 | |
The role of mass loss in constraining quenching time in dwarf galaxies from asymptotic-giant-branch and red-giant-branch star counts
1
INAF, Observatory of Rome,
Via Frascati 33,
00077
Monte Porzio Catone (RM),
Italy
2
Vatican Observatory,
00120
Vatican City State
3
Department of Astronomy, University of Michigan,
1085 S. University Ave,
Ann Arbor,
MI
48109-1107,
USA
4
Dipartimento di Matematica e Fisica, Università degli Studi Roma Tre,
via della Vasca Navale 84,
00100
Roma,
Italy
5
Dipartimento di Fisica e Astronomia Augusto Righi, Università degli Studi di Bologna,
Via Gobetti 93/2,
40129
Bologna,
Italy
★ Corresponding author: This email address is being protected from spambots. You need JavaScript enabled to view it.
Received:
29
January
2026
Accepted:
10
March
2026
Abstract
Context. The possibility of reconstructing the past star formation history of dwarf elliptical galaxies out of the Local Volume relies on modelling bright stellar populations currently evolving through the red-giant-branch (RGB) and asymptotic-giant-branch (AGB) phases. Recent studies proposed the use of the relative fractions of RGB and AGB stars populating specific boxes in the observational colour-magnitude plane to infer the epoch within which 90% of the stellar population of the galaxy formed (T90).
Aims. We aim to understand the physical processes of stellar evolution that are constrained by the relationship between the relative fraction of AGB and RGB stars of dwarf galaxies and the T90 epoch.
Methods. We used updated stellar models that include the description of dust formation in the wind to undertake a population synthesis approach that would allow us to monitor the variation of the NAGB/NRGB ratio with time. The effects of some specific ingredients, such as the mass loss experienced by low-mass stars during the RGB phase, and the details of the time variation of the star formation rate, were extensively explored and tested against data in this study.
Results. The mass lost by low-mass stars during the RGB evolution proves the most relevant ingredients affecting the time variation of NAGB/NRGB: at metallicities ~1/10 solar, a mass loss of ~0.25 M⊙ is required to reproduce the observations. This analysis allowed us to derive a relationship between NAGB/NRGB and T90, with a ~1 Gyr uncertainty on T90.
Key words: stars: AGB and post-AGB / stars: evolution / galaxies: star formation / galaxies: statistics
© The Authors 2026
 Open Access article, published by EDP Sciences, under the terms of the Creative Commons Attribution License (https://creativecommons.org/licenses/by/4.0), which permits unrestricted use, distribution, and reproduction in any medium, provided the original work is properly cited.
This article is published in open access under the Subscribe to Open model. This email address is being protected from spambots. You need JavaScript enabled to view it. to support open access publication.
1 Introduction
Our ability to reconstruct the star formation history (SFH) of nearby individual galaxies by resolving their stellar populations has helped build physical intuition into the processes that form and shape galaxies; these range from reconstructing how the stellar populations in the solar neighbourhood grew over time (Gallart et al. 2024) and were influenced by recurrent impacts of the Sagittarius dwarf galaxy (Ruiz-Lara et al. 2020), to reconstructing how the nearby Andromeda galaxy suffered a global burst of star formation 2 Gyr ago (Williams et al. 2015) due to a merger of a large progenitor (D’Souza & Bell 2018; Hammer et al. 2018), which led to the thickening of its stellar disc (Dorman et al. 2015; Dalcanton et al. 2023). Further out, constraints on the quenching of star formation of the stellar halos of nearby Milky Way (MW)-mass galaxies (e.g. M31, Cen A, and M81; Brown et al. 2006; Rejkuba et al. 2005; Durrell, Sarajedini, & Chandar 2010) have given us useful constraints about the time of merger of their most massive progenitors (Deason et al. 2015; D’Souza & Bell 2018; Monachesi et al. 2019; Wang et al. 2020). On smaller scales, constraints of the quenching of star formation in low-mass dwarf galaxies have been useful in constraining their infall time into the MW (e.g. Fillingham et al. 2015; Slater & Bell 2014), while similar information in ultra-faint MW and M31 dwarfs have given us useful constraints about the epoch and the progress of reionisation (Weisz et al. 2014). While some of these insights critically depend on the temporal resolution of the SFH obtained from faint, but more numerous, main-sequence turn-off stars, others have been gleaned from brighter red clump and/or horizontal branch stars, offering us the possibility to study a larger number of galactic systems out to 3.5 Mpc, albeit at lower temporal resolution (Weisz et al. 2011). If the community wishes to extend this intuition to the abundance of galactic systems found further out within the Local Volume (<10 Mpc), it needs to make a concerted effort to understand how to constrain the SFH from brighter red-giant-branch (RGB) and asymptotic-giant-branch (AGB) stars readily found in HST and JWST observations (e.g. Rejkuba et al. 2022).
Our ability to capitalise on the temporal information present in the longer lived RGB stars (108–109 yr, depending on the stellar mass) and the short-lived (~105 yr) intermediate-age AGB stars depends critically on our ability to model the latter. Due to their extremely short lifetime, AGB stars are difficult to find in open and globular clusters, and, hence, earlier single stellar population models have had a hard time constraining their behaviour. Recent efforts have focused on calibrating models against optical and NIR photometry and spectroscopy of AGB populations in nearby galaxies that show recent star formation including M31, the Magellanic Clouds, dwarf irregulars, and nearby spirals with great success (e.g. Girardi et al. 2010; Rosenfield et al. 2014; Choi et al. 2016; Pastorelli et al. 2020; Dell’Agli et al. 2016, 2018, 2019; Gavetti et al. 2025). However, the behaviour of low-mass, low-metallicity AGB stars in dwarf elliptical galaxies, whose star formation was quenched a long time ago, had not been sufficiently explored until now, partly due to the low number of AGB stars found in these galaxies. Recently, Harmsen et al. (2023, hereafter H23) demonstrated that the relative fraction of the number of AGB and RGB stars (NAGB/NRGB) in nearby dwarf elliptical and irregular galaxies is correlated with the quenching time of star formation. The results by H23 are shown in Fig. 1, in terms of the T90 versus NAGB/NRGB trend. In practice, H23 used HST-resolved observations of Local Group dwarfs in the F606W and F814W filters to derive a correlation between the time before which 90% of the stellar population of a given galaxy formed, T90, and the NAGB/NRGB ratio. The latter quantity is estimated by counting the sources populating specific regions in the (F606W – F814W, F814W) diagram, chosen to map the stellar population just below the tip of the RGB (TRGB), and those 0.15 mag brighter than the TRGB, which can be safely assumed to evolve through the AGB phase. A unique feature of the H23 sample is the inclusion of a number of M31’s dwarf elliptical galaxies whose star formation quenched more than 5–6 Gyr ago, suggesting that AGB O stars from low-mass stars may be present in galaxies quenched long ago. The recent publication of the SFH of all the dwarf galaxies of M31 by Savino et al. (2025) has only reinforced this relation (see Appendix A). Although H23 used this relation to determine the quenching time of the stellar haloes of nearby MW-mass galaxies in the GHOSTS sample, they did not comment on what particular physical processes of the evolution of AGB stars are constrained by this relation.
Against this background, we embarked on consolidating the methodology proposed by H23 and understanding the physical processes involved by applying results from detailed stellar evolution modelling and the description of dust formation in the wind in order to understand how the relative fraction of AGB and RGB stars in a given galaxy depends on the SFH. Although the timescale of the RGB evolution of stars can be determined with sufficient accuracy, the time variation of the post core-helium-burning phases – a key factor in determining the expected number of AGB sources in a given region of any colour–magnitude plane – is sensitive to various physical mechanisms that deeply affect the evolution through the AGB. The most relevant in this regard are (a) the mass loss experienced by the stars during the ascending of the RGB, which might lead to them skipping the AGB phase completely; (b) the efficiency of the mechanisms favouring the alteration of the surface chemistry, which might significantly change the strength of the AGB mass loss, thus affecting the evolutionary timescales; and (c) the formation of dust in the circumstellar envelope, which would trigger a shift of the spectral energy distribution (SED) towards the infrared region.
In this work, we focused on stellar populations with metallicities of [Fe/H] = −1, which reflects the chemistry of most of the dwarf galaxies investigated by H23. After a preliminary analysis of the various factors that affect the description of the AGB phase, we discuss a few selected galaxies in detail. These span a variety of SFHs, ranging from those characterised by very old stellar populations, such as Sculptor and NGC 185, to those believed to have experienced recent star formation, such as Fornax. The results of the analysis applied to the selected galaxies were then used in a more general approach to discuss the possibility of determining a relationship between the relative consistency of the RGB and AGB stellar populations and the SFH. In the final part of the paper, we propose moving from the optical filters employed by H23 to the near-infrared filters employed by the JWST, Euclid, and WFIRST.
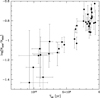 |
Fig. 1 Updated correlation between the relative fraction of the number of AGB and RGB stars (NAGB/NRGB) in nearby dwarf elliptical galaxies and the time before which 90% of the stellar population of a given galaxy formed, T90 (Harmsen et al. 2023, update in Appendix A). |
2 RGB and AGB evolution
The methodology introduced by H23 to reconstruct the time of shutdown in the star formation of galaxies is based on the relative fractions of star counts in the RGB and AGB boxes defined in the (F606W–F814W, F814W) diagram. The corners of the RGB selection box (relative to the apparent magnitude of the TRGB defined in VEGA magnitudes) are located at (0.8, 0), (1.9, 0), (0.68, 0.6), and (1.78, 0.6), while the choice for the AGB box was (1.0, −0.75), (2.2, −0.75), (0.88, −0.15), and (2.08, −0.15). To discuss the potentialities of the NAGB/NRGB ratio as an indicator of the quenching time of star formation of galaxies, it is important to understand how stars of different masses pass in F814W magnitude within the two boxes. Hence, we consider the evolutionary tracks of stars of different masses with chemical composition [Fe/H] = −1, which is the metallicity of galaxies addressed in this work. It is important to emphasize that the colour limits of the boxes serve to observationally separate various phases of stellar populations from each other as well as from contaminants and interlopers.
2.1 The evolution of stars in the RGB and AGB boxes
The evolutionary sequences used in the present analysis are based on stellar models calculated by means of the ATON code for stellar evolution (Mazzitelli 1979), interfaced with the description of the dust formation process in the wind, according to the schematization discussed in Ventura et al. (2012). We adopted the [Fe/H] = −1 models published in Ventura et al. (2014), recently extended to the post-AGB phase by Kamath et al. (2023). In the following, we refer to these models as the ATON models. All the evolutionary sequences adopted are available on Zenodo.
Figure 2 shows the evolutionary tracks of stars with initial masses of 0.8 M⊙ and 2 M⊙ in the diagram (F606W–F814W, F814W). The former experiences the helium flash, while the latter undergoes quiescent core helium burning. The evolution of the F814W flux of the two model stars considered is shown in the top panels of Fig. 3. In this sub-section, we consider the case of zero mass loss during the RGB evolution of low-mass stars. The effects of the RGB mass loss are addressed in Sect. 2.3.
The evolutionary track of the 0.8 M⊙ model star enters the RGB box, delimited by the grey lines in Fig. 2, which corresponds to the grey area in Fig. 3, twice. The first crossing occurs during the final RGB phases, before the TRGB is reached; the second overlapping takes place during the early AGB evolution and the first two inter-pulse phases. The determination of NRGB is more affected by the first crossing, which is ~ 4 times longer than the second. The AGB box, delimited by cyan lines in Fig. 2, and indicated with yellow shading in Fig. 3, is only crossed during the AGB evolution for the last four thermal pulse (TP) phases.
The 2 M⊙ model star evolves through the RGB box at the start of the AGB evolution – the so-called early-AGB phase – before the ignition of the TPs. The overlap of the evolutionary track and the AGB box takes place during all the inter-pulse phases of the TP–AGB evolution, until the envelope is lost. In the top panels of Fig. 3, we see that both the model stars considered eventually evolve into the RGB box towards the very final evolutionary phases; however, this late crossing of the RGB box is so short that is not relevant for the determination of NAGB/NRGB.
To have a more general view of the behaviour of stars of different masses, in the lower panels of Fig. 3 we show the time evolution of F814W for 1.5 M⊙ and 2.5 M⊙ stars. For the 1.5 M⊙ star, which underwent the helium flash, both the RGB phase preceding the ignition of core-helium-burning and the AGB phases are shown, whereas in the 2.5 M⊙ case the plot is limited to the early-AGB and the TP–AGB evolution. In the 0.8 M⊙ case, the F814W flux increases as a consequence of the gradual rise in the stellar luminosity, due to the growth of the core mass, until the final phases. Higher mass stars evolve differently, as the formation of dust in the circumstellar envelope favours the gradual shift of the SED to the infrared (IR); therefore, the F814W flux eventually decreases as the bolometric luminosity continues to increase. In Fig. 3, we note that the whole TP–AGB evolution of M ≤ 2 M⊙ stars takes place within the AGB box chosen by H23, whereas the stars descending from higher mass progenitors, which evolve on timescales of less than half a gigayear, reach brighter F814W fluxes. Therefore, a taller box (in magnitude) would give access to more massive AGB stars, giving information about more recent SFH.
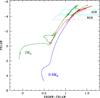 |
Fig. 2 Evolutionary tracks of model stars with a metallicity of [Fe/H] = −1 and initial masses of 0.8 M⊙ (blue line until the helium flash, and then red line from the start of the core-helium-burning phase) and 2 M⊙ (green) on the colour–magnitude (F606W–F814W, F814W) diagram. The regions inside the grey and cyan lines indicate the RGB and AGB boxes, respectively, introduced by H23. The evolutionary sequences are shown until the start of the post-AGB contraction, which is omitted for readability. |
2.2 Times in the RGB and AGB boxes: Trend with the stellar mass
To give an overall view of the duration of the different evolutionary phases, in Fig. 4 we show the times spent within the RGB (τRGB) and the AGB (τAGB) boxes given in H23, as a function of the initial mass (left panel) and the age (right) of the stars for the different model stars considered here. τRGB is of the order of 3 Myr for all stars with masses below 2 M⊙; this is a consequence of the onset of electron degeneracy, which makes the main features of the last part of the RGB evolution independent of the stellar mass. According to the earlier discussion regarding the evolution of the 0.8 M⊙ model star, the τRGB of low-mass stars is further increased by ~20% by the second crossing of the evolutionary track with the RGB box, taking place during the early-AGB evolution. A similar behaviour is seen in the 1.5 M⊙ model star depicted in the bottom left panel of Fig. 3. The time spent within the RGB box is about a factor 5–6 shorter for M ≥ 2 M⊙ stars, because the stars not undergoing the helium flash enter the RGB box during the early-AGB phase, which is significantly shorter than the RGB ascending.
τAGB is much shorter than τRGB, while its trend with mass is not monotonic. If we consider the case where no mass loss took place during the RGB phase (red points in Fig. 4), τAGB initially decreases with the mass of the star, because the lower M is, the slower the evolutionary timescales are. At masses of around 1 M⊙, this trend is reversed as the star experiences a higher number of TPs and spends its entire TP–AGB phase within the AGB box, as can be seen in the bottom left panel of Fig. 3. A further inversion of the τAGB-mass trend is found at ~1.5 M⊙, which is again a consequence of the shorter evolutionary timescales of higher mass stars. However, it is well established that stars lose mass during the RGB phase (Reimers 1977), and thus the hypothesis that the post-flash evolution starts with the same mass with which they formed is unreasonable, particularly in stars of masses below the solar mass. The occurrence of mass loss alters the scenario proposed above, as we describe below.
2.3 The role of mass loss during the RGB phase
To investigate how mass loss during the RGB phase alters the expected number counts within the RGB and AGB boxes, we studied how τRGB and τAGB change when the mass of the star decreases during the RGB phase. A preliminary idea regarding the effects of mass loss can be obtained by looking at the top left panel of Fig. 3, where the time evolution of the F814W magnitude of a 0.8 M⊙ model star calculated with no RGB mass loss is compared with the results obtained by assuming a total mass loss of δmRGB = 0.1 M⊙ and 0.2 M⊙. Mass loss does not affect τRGB, since the evolution of stars that develop a degenerate core is primarily driven by the core mass.
On the other hand, τAGB is affected by δmRGB; the RGB mass loss leads to a decrease in the mass with which the stars begin their AGB life cycle, resulting in fewer TPs and, hence, a shorter overall duration of the AGB phase. This is evident in the case of the 0.8 M⊙ model star, where the number of TPs experienced is 6, 4, and 3 for δmRGB = 0, 0.1 M⊙, and 0.2 M⊙, respectively. Hence, the occurrence of mass loss during the RGB phase of low-mass stars leads to lower values of NAGB/NRGB.
To better understand the effects of the RGB mass loss, in Fig. 4 we compare the results obtained by assuming δmRGB = 0 and δmRGB = 0.2 M⊙. The differences are particularly relevant in the M ≤ 0.8 M⊙ mass domain, owing to the notable decrease in the duration of the AGB phase of stars exposed to significant mass loss during the RGB phase, which either do not enter the TP-AGB phase, or experience only 1–2 TPs before the envelope is lost (compare the red and green lines in the top left panel of Fig. 3).
The differences among the values of NAGB/NRGB obtained with different choices of δmRGB are relevant both on quantitative and qualitative grounds. Still considering the two cases shown in Fig. 4, we expect that in the no-RGB mass-loss case, NAGB/NRGB would decrease with time starting from the most remote epochs, while when δmRGB = 0.2 M⊙ is considered NAGB/NRGB would increase until ~6 Gyr ago and then decrease. Higher δmRGBs would reflect into a later occurrence of the maximum in NAGB/NRGB.
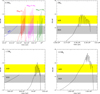 |
Fig. 3 Top panels: time variation of the F814W magnitude of the 0.8 M⊙ and 2 M⊙ model stars shown in Fig. 2. The grey and yellow regions refer to the F814W magnitudes of the RGB and AGB boxes introduced by H23. The evolution of the 0.8 M⊙ model star is divided into the RGB (blue line) and the post-flash (red) parts. The magenta and green lines refer to the evolution of the 0.8 M⊙ model star, under the hypothesis that 0.1 M⊙ and 0.2 M⊙ were lost during the RGB phase. Bottom panels: time variation of the F814W magnitude of 1.5 M⊙ and 2.5 M⊙ stars. |
3 AGB/RGB ratio in the Local Group satellites
In the following, we concentrate on some selected galaxies of metallicity [Fe/H] = −1, for which the SFH was derived in previous studies. We compare the NAGB/NRGB ratio obtained by means of a population-synthesis approach with the values estimated via number counts of the sources in the RGB and AGB boxes considered. For each epoch, we assumed that the mass distribution of the stars formed follows the initial mass function of Kroupa (2001). We considered three different groups, selected on the basis of the SFH experienced.
 |
Fig. 4 Duration of the phase during which the stars evolve into the RGB (black squares and lines) and the AGB (red dots and lines) boxes introduced by H23 as a function of the initial mass (left) and the formation epoch (right). Dotted lines and green triangles refer to the results obtained by assuming 0.2 M⊙ mass loss during the RGB evolution of M < 1.5 M⊙ stars. |
3.1 The ‘intermediate cases’ of Andromeda I and II
The SFH of Andromeda I and Andromeda II is characterised by a first, intense episode that concluded around 10 Gyr ago and further significant star formation in more recent times (Weisz et al. 2014). Andromeda II, as shown in the top left panel of Fig. 5, experienced three main episodes of star formation: (a) ~67% of the stellar mass formed earlier than 9 Gyr ago; (b) ~27% formed between 5 and 6.5 Gyr ago; (c) the remaining ~5% stars are younger than 2.5 Gyr. Considering the evolutionary timescales of model stars of different masses, we conclude that the stars formed during the periods (a), (b), and (c) now evolving through the RGB and AGB phases descended from progenitors with mass of ~0.8 M⊙, 1–1.1 M⊙, and 1.5-2 M⊙, respectively.
The bottom left panel of Fig. 5 shows the contribution of various epochs of the SFH to the present-day NAGB/NRGB. The solid lines indicate results based on the SFH by Weisz et al. (2014), and δmRGB = 0.1 M⊙, 0.2 M⊙, and 0.25 M⊙. We note the large differences in the contribution of the early epochs to the final NAGB/NRGB obtained for the different δmRGBs. This is because the majority of the stars of Andromeda II formed during this period, and the τAGB of low-mass stars is tightly connected to δmRGB (see Fig. 4); for the largest δmRGBs, the overall AGB phase is skipped.
In the first important phase of star formation of the galaxy, corresponding to point a) above, the contribution of increasingly more massive stars, which spend more and more time in the AGB boxes (see Fig. 4), serves to increase the final NAGB/NRGB as a function of formation time. A further rise in NAGB/NRGB took place during the second burst of star formation of Andromeda II around 6 Gyr ago. The individual relative fractions of the stars in the RGB and AGB boxes are reported in the bottom left panel of Fig. 5, for the δmRGB = 0.25 M⊙ case. On the other hand, in the δmRGB = 0.1 M⊙ case the cumulative NAGB/NRGB is not monotonic with formation time and even decreases, following the behaviour of τAGB/τRGB, as shown in Fig. 4.
Regarding the stars currently populating the RGB box, independently of the assumption regarding δmRGB, we find that half descended from ~0.8 M⊙ progenitors, ~35% descended from ~1 M⊙ stars, and ~15% are younger objects of initial mass above solar. These percentages approximately reflect the population of the AGB box in the δmRGB = 0.1 M⊙ case. On the other hand, when δmRGB = 0.2 M⊙ is assumed, the percentage of low-mass stars within the AGB box drops to ~35%, so the dominant population would be the progeny of 1–1.1 M⊙ stars, thus accounting for ~50% of them. In the δmRGB = 0.25 M⊙ case, the oldest objects account for only ~20% of the AGB box, which would be mainly populated by ~60% of the progeny of ~1 M⊙ stars, the remaining ~20% being younger stars.
The differences in the expected star counts within the AGB box reflect a strong sensitivity of the current NAGB/NRGB on δmRGB; we find that NAGB/NRGB = 0.11, 0.14, 0.16 when δmRGB = 0.25, 0.2, 0.1 M⊙, respectively. The result by H23, NAGB/NRGB = 0.071 ± 0.037, also shown on the right side of the bottom left panel of Fig. 5, is consistent with δmRGB = 0.2–0.25 M⊙.
We also discuss the cases where a) the SFR of Andromeda II has thus far been constant at all epochs; and b) the SFR decayed over a timescale of 7.5 Gyr. The corresponding results are shown with dashed and dotted lines, respectively, in Fig. 5. We applied these hypothesis to the δmRGB = 0.2–0.25 M⊙ cases only, as the results shown in Fig. 5 seem to rule out the δmRGB = 0.1 M⊙ assumption. The NAGB/NRGB ratios obtained with assumptions a) and b), above, are generally higher than those obtained with the SFH given in Weisz et al. (2014), because in the latter case the mass distribution is more peaked towards the lower mass domain.
The SFH of Andromeda I (see the top-right panel of Fig. 5) is characterised by a more continuous trend with respect to Andromeda II, with a gradual growth until ~6 Gyr ago, followed by a ~2.5 Gyr break, and then a final episode that continued until ~1.5 Gyr ago. Around 92% of the stars in the galaxy have ages above ~6 Gyr. The timing of the star formation reflects the evolved population presently evolving in the RGB box, ~80% of which is composed of stars descending from sub-solar mass progenitors, while the remaining ~20% is the progeny of 1.2–1.5 M⊙ stars.
The bottom right panel of Fig. 5 shows the contribution of various epochs of the SFH to the present-day NAGB/NRGB. As in the case of Andromeda II, the contribution of the early epochs to NAGB/NRGB is sensitive to the choice of δmRGB. In the δmRGB = 0.1 M⊙ case, the trend is approximately flat, since all low-mass stars evolve into the AGB box; thus, NAGB/NRGB remains at around 0.15, consistently with the results shown in Fig. 4. In the δmRGB ≥ 0.2 M⊙ cases, the lowest mass stars barely reach the AGB box: this is the reason for the severe drop in the contribution of the earlier epochs to NAGB/NRGB values, as seen in the bottom right panel of Fig. 5.
A further significant feature in the run of NAGB/NRGB is the change in the slope of the NAGB/NRGB versus time at ~6 Gyr, when the aforementioned break in the star formation occurred. No significant further increase in NAGB/NRGB took place during the final epochs; thus, the final ratio is mostly determined by the value attained before ~6 Gyr ago.
The comparison between the synthetic and the observed values of NAGB/NRGB outlines consistency only in the δmRGB = 0.25 M⊙ case. In this case, results from synthetic modelling indicate that 75% of the stars currently in the AGB box descended from progenitors of masses below solar and that most of this population is the progeny of 0.9–1 M⊙ stars. The RGB box has a wider mass distribution, with a significant presence (32%) of 0.8–0.9 M⊙ stars.
The analysis of Andromeda I and Andromeda II indicates that the observed NAGB/NRGB values can only be reproduced if we assume that low-mass stars lose at least 0.2 M⊙ while evolving through the RGB. Interestingly, given the particular evolution of the star formation rate of these galaxies, the results obtained are not substantially different from those based on the assumption of a star formation rate decaying on a 7.5 Gyr timescale.
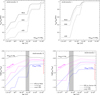 |
Fig. 5 Top panels: variation of the relative mass of the galaxy (solid line) and of the fraction of AGB (dashed) and RGB (dotted) stars formed for the δm(RGB) = 0.25 M⊙ case and the SFH by Weisz et al. (2014) and Savino et al. (2025) for the galaxies Andromeda II (top left) and Andromeda I (top right), respectively. Bottom panels: cumulative contribution of various star formation epochs to the present-day ratio of AGB-to-RGB stars of Andromeda II (bottom left) and Andromeda I (bottom right), based on different assumptions regarding the star formation history and the average mass lost by low-mass stars during the RGB phase. Solid lines indicate results found by adopting the SFH by Weisz et al. (2014) for Andromeda II and that of Savino et al. (2025) for Andromeda I; dashed tracks are based on the assumption of constant SFH; dotted lines refer to results obtained when assuming that the SFH decays with a timescale of 7.5 Gyr. Colour-coding indicates the mass lost by stars during the RGB evolution: the cases δm(RGB) = 0.1 M⊙ (black lines), 0.2 M⊙ (magenta), and 0.25 M⊙ (blue) are shown. The grey shaded region indicates the T90 epoch; the red line refers to the AGB-to-RGB ratio derived for Andromeda II and Andromeda I. |
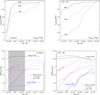 |
Fig. 6 Top panels: variation of the relative fractions of the mass of the galaxy and of the stars in the RGB and AGB boxes for the δmRGB = 0.25 M⊙ case, based on the SFH by Weisz et al. (2014) for Sculptor (top left) and NGC185 (top right). Bottom panels: cumulative contribution of various star formation epochs to the present-day ratio of AGB-to-RGB stars of Sculptor (bottom left) and NGC185 (bottom right), based on different assumptions regarding the star formation history and the average mass lost by low-mass stars during the RGB phase. Solid lines indicate results found by adopting the SFH by Weisz et al. (2014) for Sculptor and for NGC 185. The colour-coding and the dashed and dotted lines have the same meanings as in Fig. 5. |
3.2 The oldest populations: Sculptor and NGC 185 cases
In Sculptor and NGC 185, most of the star formation took place more than 10 Gyr ago. Therefore, the mass distribution is strongly peaked towards the lowest masses.
With regard to Sculptor, as shown in the top left panel of Fig. 6, 96% of the stellar mass formed earlier than 10 Gyr ago; thus, ~90% of the current evolved stellar population is composed of the progeny of ~0.8 M⊙ stars. Star formation stopped ~2.5 Gyr ago; thus, the present-day RGB and AGB populations descend from progenitors of mass below 1.5 M⊙.
The contribution of various epochs to the present-day NAGB/NRGB of Sculptor obtained on the basis of different assumptions is reported in the bottom left panel of Fig. 6. The evolution of the relative fractions of the stars in the RGB and AGB boxes, for the δmRGB = 0.25 M⊙ case only, are shown in the top left panel of Fig. 6.
In the δmRGB = 0.1 M⊙ case, the initial mass distribution of the stars contained in the RGB and AGB boxes is similar and peaked around 0.8 M⊙. As a consequence, NAGB/NRGB attains values of ~0.15, which reflect the ratio of the relative duration of the AGB and RGB phases typical of 0.8 M⊙ stars, as shown in Fig. 4. No meaningful changes in NAGB/NRGB are found during the more recent epochs, given the dominant contribution from ~0.8 M⊙ in the two boxes considered.
In the δmRGB = 0.2 M⊙ and 0.25 M⊙ cases, the stars with initial masses of ~0.8 M⊙ evolve within the AGB box for a shorter time than for δmRGB = 0.1 M⊙; therefore, the percentage of ~0.8 M⊙ stars in the AGB box decreases down to 72% and 63%, respectively. The final NAGB/NRGB ratios are consequently lower than for δmRGB = 0.1 M⊙, with NAGB/NRGB=0.09 for δmRGB = 0.2 M⊙, and NAGB/NRGB = 0.04 for δmRGB = 0.25 M⊙. The comparison with the NAGB/NRGB estimated from number counts rules out the δmRGB = 0.1 M⊙ possibility, while both the δmRGB = 0.2 M⊙ and 0.25 M⊙ cases are consistent with the observations.
Concerning NGC 185, the rise of the SFR with time during the early epochs is slower than for Sculptor; this can be deduced by comparing the evolution of the fractional mass of the galaxies in the top left and top right panels of Fig. 6. The first major episode of star formation, during which 95% of the stellar mass formed, ended around 8 Gyr ago. We see in the bottom right panel of Fig. 6 that NAGB/NRGB increases until that epoch, reaching values similar to those of Sculptor, before the final rise, related to a recent star formation episode (Geha et al. 2015). During this episode, a significant number of M > 1 M⊙ stars formed; indeed, the presence of these stars increases the number of stars evolving today within the AGB box and, consequently, NAGB/NRGB. We explored the sensitivity of the final NAGB/NRGB to the duration of the latter period of recent star formation, which reflects into the overall stellar mass formed recently. We found that when the fraction of the stars formed in the recent epochs decreases from 2% to 0.5%, NAGB/NRGB decreases by ~0.15 dex.
The errors associated with the estimate of NAGB/NRGB of NGC 185 are smaller than for Sculptor, which allows a tighter constraint on the RGB mass loss; δmRGB = 0.25 M⊙ is the only choice consistent with the observations, in agreement with the conclusions drawn during the analysis of Andromeda I. The corresponding evolution of the relative fractions of AGB and RGB stars can be seen in the top right panel of Fig. 6.
In the cases of Sculptor and NGC 185, unlike Andromeda I and II, the final NAGB/NRGB obtained by assuming either constant or exponentially decaying SFR are far in excess of those based on the detailed SFH available in the literature. This is due to the dominant presence of low-mass stars, which is poorly reproduced by the constant or the slowly decaying star formation rate hypothesis.
3.3 Galaxies with recent star formation
In galaxies such as Fornax and KK77, star formation continued until less than 1 Gyr ago. This can be deduced by the results reported in the top panels of Fig. 7, where the evolution of the total mass (solid line) and of the variation of the stars in the RGB and AGB boxes (dotted and dashed lines, respectively) are shown. The bottom panels show the cumulative contribution of various epochs to the final NAGB/NRGB.
We stress here the significant uncertainty associated with the SFH of KK77 (observed as part of the ANGST survey; Dalcanton et al. 2009), which was estimated from data that reach a little beyond the red clump and does not include the main-sequence turn-off stars. In the bottom right panel of Fig. 7, we refer to the results obtained by assuming the lower limit of the SFH derived by Weisz et al. (2014) for this galaxy.
The continuity with which star formation occurred in these galaxies is confirmed by the similarity between the results based on the SFH published by Weisz et al. (2014) and those obtained by assuming a constant SFH during the various epochs.
The study of Fornax and KK77 shows that for galaxies characterised by recent star formation the final NAGB/NRGB is scarcely dependent on the choice regarding the RGB mass loss. Indeed, we see in the bottom panels of Fig. 7 that the results based on the various choices for δmRGB are all consistent with the measured values of NAGB/NRGB. The reason for this behaviour is that the majority of the stars currently evolving in the RGB and AGB boxes descend from progenitors whose mass is in the 0.9–1.2 M⊙ range: for these stars, the time spent within the AGB box is not extremely sensitive to δmRGB, as it is for their lower mass counterparts.
In the case of Fornax, ~80% of the stars in the AGB box and 70% of those in the RGB box descend from 0.9–1.2 M⊙ progenitors. The final NAGB/NRGB, of the order of 0.15, is in good agreement with that derived from number counts, within the error bar.
4 Understanding the NAGB/NRGB ratios of metal-poor galaxies
The results presented in the previous section outline that the present-day NAGB/NRGB of the galaxies in which most of the star formation occurred during the early epochs is largely sensitive to the amount of mass lost by stars during their RGB evolution: consistency between the results from synthetic modelling and the measured number counts demands δmRGB > 0.2 M⊙. This value is consistent with the study by Tailo et al. (2020), who estimated an average mass loss slightly above 0.2 M⊙ for RGB stars belonging to Galactic globular clusters of metallicity [Fe/H] = −1. The role of δmRGB is less relevant for the galaxies characterised by recent star formation and T90 < 4 Gyr; in these cases, a 0.2 M⊙ change in δmRGB would reflect differences in the estimated NAGB/NRGB below 0.05 dex.
To reach a more general understanding of how the NAGB/NRGB ratio depends on the SFH, we simulated the evolution of galaxies characterised by different T90s, where we explored the role played by the following factors: a) the average mass loss experienced by stars of sub-solar masses during the RGB phase; b) the time variation of the star formation rate, from the formation of the galaxies until the T90 epoch; c) the duration of the time required to form the residual 10% of the stellar mass of the galaxy after the T90 epoch. For point (a), we considered the cases explored in the previous section, namely δmRGB = 0.1, 0.2, 0.25 M⊙. For point (b), we assumed that the time variation of the cumulative star formation was CSFR ∝ t3, ∝ t, ∝ t1/3. This is to describe a wide range of situations, ranging from a rapidly growing star formation, strongly peaked towards the lowest masses (CSFR ∝ t1/3), to a slower process favouring the formation of higher mass stars (CSFR ∝ t3). Concerning point (c), we compare the results obtained by changing the duration of the time interval after the T90 epoch: we considered a variety of cases, ranging from the situation that the residual 10% of stars formed within half a gigayear after the T90 epoch, to the case where star formation continued at low rates until now. The outcome of this exploration is summarised in Fig. 8, where the data of Fig. 1 are also shown.
For T90 ≥ 10 Gyr, the most relevant quantity affecting NAGB/NRGB is the RGB mass loss, as the stellar population is dominated by low-mass stars, whose duration of the phase during which they evolve into the AGB box is highly sensitive to δmRGB (see the top left panel of Fig. 3). A non-negligible role in the determination of NAGB/NRGB for the galaxies with the oldest populations is also played by the time at which the star formation process ends; that is, after the T90 epoch, the effects of which are of the order of ~0.2 dex. The latter finding, which is at first surprising, is due to the fact that in galaxies where the majority of the stars descend from old, low-mass progenitors that barely enter the AGB box, an extended period of star formation (though limited to 10% of the global stellar mass) is sufficient to significantly increase the number of stars in the AGB box; that is, NAGB/NRGB.
An inspection of Fig. 8 shows that the impact of the factors described in points (a)–(c), above, becomes progressively smaller towards the shorter T90 s, and that the overall uncertainty on NAGB/NRGB found in the T90 = 1 Gyr case is within 0.15 dex. This is again related to the less and less relevant role played by M < 0.9 M⊙ stars in the galaxies with T90 < 5 Gyr, and the larger presence of the higher mass counterparts: indeed for the latter stars the duration of the staying within the AGB box is not particularly sensitive to the input adopted.
Despite the results reported in Fig. 8 indicating a significant spread in the T90 versus NAGB/NRGB relation, particularly in the galaxies with the oldest populations, we may still consider NAGB/NRGB as a good indicator of T90 based on the following arguments: (a) according to the results discussed in the previous section, supported by the recent analysis by Tailo et al. (2020), we may safely consider that, on average, low-mass stars suffered an RGB mass loss in excess of 0.2 M⊙; (b) in the galaxies where no recent star formation occurred, such as the cases of Sculptor and NGC 185 discussed in the previous section, the star formation rate decreases rapidly after the formation epoch; thus, the time variation of cumulative star formation history (CSFH) is better reproduced by the CSFH ∝ t1/3 relation; and (c) in the galaxies characterised by recent star formation, such as KK 77 and Fornax, star formation proceeds with more continuity; thus, the CSFH ∝ t relation is more suitable to describe the behaviour of the cumulative SFH.
Taking all these factors into account, we expect that most galaxies follow the T90 versus NAGB/NRGB trend indicated with a red line in Fig. 8, which can be approximated by the following expression:
![Mathematical equation: $\[\begin{aligned}\mathrm{T}_{90} / \mathrm{Gyr}= & -11.75 \times \log ^2\left(\mathrm{N}_{\mathrm{AGB}} / \mathrm{N}_{\mathrm{RGB}}\right) \\& -41.75 \times \log \left(\mathrm{N}_{\mathrm{AGB}} / \mathrm{N}_{\mathrm{RGB}}\right)-25.\end{aligned}\]$](/articles/aa/full_html/2026/05/aa59206-26/aa59206-26-eq1.png)
The grey shaded area in the bottom right panel of Fig. 8 represents the uncertainty associated with the aforementioned trend, which we see to be of the order of 1 Gyr for the galaxies with old stellar populations; it progressively decreases to approximately half a gigayear for the galaxies with recent star formation. These conclusions hold for the [Fe/H] = −1 chemical composition, and they can be likely safely extended to metallicities a factor of ~2 different from [Fe/H] = −1.
A linear T90 versus NAGB/NRGB relation could potentially reproduce the position of the majority of the blue points in the middle and right panels of Fig. 8; however, such linear approximation would only be consistent with the CSFH ∝ t3 case, which, as discussed in point b) above, is definitively not the case for the galaxies with the oldest stellar populations.
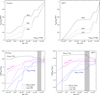 |
Fig. 7 Top panels: variation of the relative fractions of the mass of the galaxy and of the stars in the RGB and AGB boxes for the δmRGB = 0.25 M⊙ case, based on the SFH by Weisz et al. (2014) for Fornax (top left) and KK77 (top right). Bottom panels: cumulative contribution of various star formation epochs to the present-day ratio of AGB-to-RGB stars of Fornax (bottom left) and KK77 (bottom right). Solid lines refer to results based on the SFH from Weisz et al. (2014). The meaning of the dashed and dotted lines, the grey region, and the colour-coding are the same as in Figs. 5 and 6. |
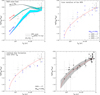 |
Fig. 8 NAGB/NRGB data of different galaxies compared with the predictions from population synthesis. Top left: comparison between the data and the results obtained by assuming different mass losses during the RGB evolution of low-mass stars, and considering the two cases of an SFH constant (dashed lines) decaying on a timescale of 7.5 Gyr (solid line). Top right: data points compared with the results based on the δmRGB = 0.25 M⊙ assumption, for different SFHs versus time relations (for which the CSFH ∝ t1/3, t, t3 cases were considered). Bottom left: δmRGB = 0.25 M⊙ and CSFH ∝ t1/3, where the two cases that the residual 10% of the stars are formed either within half a gigayear or over the time until 1 Gyr ago are indicated with open points filled with black dots and with open points, respectively. Bottom right: comparison between the data points and the most likely T90 vesus NAGB/NRGB relation (see text for details); the uncertainty associated with the latter trend is indicated by the grey shaded area. |
5 Discussion
To understand how the present findings are sensitive to the details of stellar modelling and to the choice of the filter considered for the number counts, we first compare the ATON results with those based on different stellar evolution codes. Then, we discuss the possibility of adopting near-IR filters instead of F814W.
5.1 Comparison with other models
In Fig. 9, we compare the ATON T90 versus NAGB/NRGB relation with (a) the PARSEC-COLIBRI models by Rosenfield et al. (2014); (b) the PARSEC-COLIBRI models by Pastorelli et al. (2020); and (c) the MIST models by Choi et al. (2016). The PARSEC–COLIBRI models attain NAGB/NRGB values systematically lower than the ATON results and the data, especially in the most ancient epochs. The ATON and MIST results show more similarities, the differences being limited to the T90 > 8 Gyr epochs, when the NAGB/NRGB found when using the MIST results are 0.2–0.4 dex larger than those obtained in the ATON case; while the difference between the MIST and ATON models at younger ages ~1–2 Gyr can be explained due to the difference in the treatment of dust in carbon-rich AGB stars. At the oldest epochs the relevant factor distinguishing the various computations is the expected number counts of stars in the AGB box; according to the computations presented in Pastorelli et al. (2020), the AGB box is not populated by stars older than ~6 Gyr, while the data suggest that this situation is found only for ages above 10 Gyr. On the other hand, use of the MIST models leads to a more numerous population of stars in the AGB box in comparison to the ATON ones.
These differences are due to the treatment of mass loss adopted in the various cases. We demonstrate this in Fig. 10, where we show the evolution of the mass-loss rate during the RGB and AGB phases of a model star of initial mass 0.9 M⊙, which evolves on timescales of 7 Gyr. We used the stellar luminosity as indicator of the evolutionary phases, so the sequences must be followed rightwards until the TRGB and then resumed from the core helium burning. The PARSEC AGB sequence (for clarity reasons, we restricted our study to the Pastorelli et al. 2020 models, but similar results are found when the Rosenfield et al. 2014 case is considered) is interrupted when the whole envelope is lost, whereas for the MIST and ATON cases the sequences are extended to the start of the post-AGB evolution.
An inspection of Fig. 10 shows that little mass loss occurs during the RGB phase in the PARSEC case, with ![Mathematical equation: $\[\mathrm{\dot{M}}<2 \times 10^{-8} ~\mathrm{M}_{\odot} / \mathrm{yr}\]$](/articles/aa/full_html/2026/05/aa59206-26/aa59206-26-eq2.png) , so only ~0.05 M⊙ are lost during the RGB phase. A similar result is found with the MIST models. In contrast, in the ATON case 0.25 M⊙ are lost during the RGB phase, so the post-flash evolution starts with a lower mass than in MIST and PARSEC. At the ignition of the helium flash, the 0.9 M⊙ model star has a mass of 0.84 M⊙, 0.865 M⊙, and 0.65 M⊙ in the PARSEC, MIST, and ATON models, respectively.
, so only ~0.05 M⊙ are lost during the RGB phase. A similar result is found with the MIST models. In contrast, in the ATON case 0.25 M⊙ are lost during the RGB phase, so the post-flash evolution starts with a lower mass than in MIST and PARSEC. At the ignition of the helium flash, the 0.9 M⊙ model star has a mass of 0.84 M⊙, 0.865 M⊙, and 0.65 M⊙ in the PARSEC, MIST, and ATON models, respectively.
During the post-horizontal-branch phase’s evolution, the mass-loss rates of the ATON model preserve the consistency between the RGB and the E-AGB phases. The net result is that the evolutionary tracks of the 0.9 M⊙ model star enter the AGB box, where it ultimately undergoes TPs with mass-loss rates much higher than those in the RGB phase. However, the PARSEC mass-loss rates in the E-AGB phases, represented by the upper series of triangles in Fig. 10, are much higher than those experienced during the RGB phase, attaining values close to 10−6 M⊙/yr at luminosities of the order of 1500 L⊙. Consequently, the evolutionary tracks of the stars do not enter the AGB box, because the whole envelope is lost before the luminosities reach the values attained at the TRGB. This is the reason for the extremely low NAGB/NRGBs found in the T90 > 4 Gyr epoch in the PARSEC cases. If the same ![Mathematical equation: $\[\mathrm{\dot{M}}\]$](/articles/aa/full_html/2026/05/aa59206-26/aa59206-26-eq3.png) versus L trend used in Pastorelli et al. (2020) to model the post-HB phases is applied to the RGB evolution, we find that low-mass stars never reach the tip of the RGB; thus, even the RGB box would be barely populated. Since the surface gravities of RGB and post-HB stars of the same luminosities are similar, we believe that it is more appropriate that the mass-loss rates adopted to model the two phases be similar, rather than invoking that a sudden rise of
versus L trend used in Pastorelli et al. (2020) to model the post-HB phases is applied to the RGB evolution, we find that low-mass stars never reach the tip of the RGB; thus, even the RGB box would be barely populated. Since the surface gravities of RGB and post-HB stars of the same luminosities are similar, we believe that it is more appropriate that the mass-loss rates adopted to model the two phases be similar, rather than invoking that a sudden rise of ![Mathematical equation: $\[\mathrm{\dot{M}}\]$](/articles/aa/full_html/2026/05/aa59206-26/aa59206-26-eq4.png) takes place during the post-HB evolution.
takes place during the post-HB evolution.
The treatment of mass loss in the ATON and MIST cases shows interesting similarities. First, the mass-loss rates experienced during the E-AGB phase are similar to those experienced during the RGB phase. Also, the mass-loss rates experienced by the ATON and MIST models during the AGB phase are similar (see Fig. 10). As discussed previously, the main difference between the two models is the mass loss during the RGB phase, which reflects the mass with which the stars start the core-helium-burning phase, which is higher in the MIST case; consequently, the evolutionary tracks of the MIST models populate the AGB box for a longer time than in the ATON ones, thus favouring a slightly higher NAGB/NRGB for ages > 7 Gyr.
It is not possible to distinguish between the ATON and MIST descriptions on the basis of the observational RGB and AGB number counts for galaxies with a metallicity of [Fe/H] = −1; the differences are only found for systems in which star formation is limited to the ancient epochs for which, unfortunately, the Poisson uncertainties in the observed NAGB/NRGB are so large that both models are consistent with the data (see Fig. 9).
To constrain mass loss, we need to turn to other phases of stellar evolution where the differences in mass loss by low-mass stars have a more dramatic effect. It has long been known that mass loss by low-mass stars during RGB evolution has a strong impact on the morphology of the HB stars in globular clusters, which is known to extend to the blue when a significant fraction of the envelope is lost before the TRGB is reached, while it is clustered on the red side of the colour-magnitude diagrams when the RGB mass loss is negligible. Several dedicated studies on the HB of globular clusters showed that low-mass, metal-poor stars must undergo an RGB mass loss of at least 0.2 M⊙ in order to reproduce the observations of HB stars (Gratton et al. 2010; Denissenkov et al. 2017; VandenBerg & Denissenkov 2018; Tailo et al. 2020, 2022; Li 2025). This is at odds with the MIST description, whereby the RGB mass loss is below 0.05 M⊙, while being consistent with the ATON δmRGB values derived in Sect. 3. This suggests that it is important that stellar models simultaneously model all these connected phases of stellar evolution; i.e. the RGB phase, the horizontal-branch phase and the E-AGB/AGB phases, in order to have a definitive handle on constraining mass loss in late-type stars.
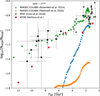 |
Fig. 9 We compare our models with three others using a CSFH ∝ t1/3 relation: (a) the PARSEC-COLIBRI model of Rosenfield et al. (2014); (b) the PARSEC-COLIBRI model of Pastorelli et al. (2020); (c) the MIST models of (Choi et al. 2016). |
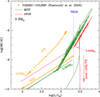 |
Fig. 10 Evolution of the mass-loss rate of a 0.9 M⊙ model star of metallicity [Fe/H] = −1 as a function of the stellar luminosity, across the RGB and the AGB phases. Orange triangles indicate the evolution taken from Pastorelli et al. (2020), while the green and red lines refer to the MIST and ATON models, respectively. The masses reported along the evolutionary tracks indicate the mass of the star at the ignition of the helium flash. The vertical blue line indicates the location of the TRGB. |
5.2 Extension to near-IR bands
Since AGB and RGB stars are intrinsically cool and red, they can be clearly identified in the near-IR bands. AGB stars are also less affected by dust in the near-IR bands. In light of ongoing and upcoming near-IR space missions such as JWST, Euclid, and the Roman Space Telescope, this becomes especially relevant. For this reason, we consider it worthwhile to investigate how the T90 versus NAGB/NRGB relation behaves in the J filter and its analogues, where AGB and RGB observations will soon be available for hundreds of galaxies. Furthermore, IR colours involving the J filter can help separate M giants from dwarfs (e.g. Majewski et al. 2003). In addition to the J filter (2MASS), in this sub-section we also concentrate on the JWST F115W filter (which will be used to observe the faint stellar halos of 28 galaxies out to 20 Mpc; Smercina et al. (2024); JWST proposal 8277), the Js filter of Euclid, and the F129 filter of the Nancy Grace Roman Space telescope.
We began by evaluating the possible choices of the RGB and AGB boxes in the 2MASS J filter. Figure 11 shows the time evolution of the J magnitude of the same model stars reported in Fig. 3. The yellow shaded region in the panels of Fig. 11 indicates a box extending over a J-magnitude range equal to the one chosen by H23 to select the AGB box in the F814W band, i.e. from 0.15 mag to 0.75 mag above the TRGB.
The comparison between the results shown in Fig. 3 and those of Fig. 11 outlines that while the range of F814W values reached during the AGB phase is roughly constant for the stars of mass in the 0.8–2 M⊙ interval, the J fluxes attained during this phase show a higher sensitivity to the stellar mass; as an example, the 2 M⊙ model star, shown in the top right panel of Fig. 11, evolves to one J magnitude above the TRGB, whereas in the 0.8 M⊙ case, shown in the top left panel of Fig. 11, this excursion is limited to 0.5 mag. This behaviour is motivated by the change in the SED of the stars when dust formation in the wind begins. The F814W is more affected by the presence of dust in the circumstellar envelope: despite the gradual increase in the luminosity, the progressive shift of the SED of the stars to the IR spectral region makes F814W decrease, after reaching a maximum during the evolutionary phases preceding dust production (see Fig. 3). On the other hand, the J flux is less sensitive to the presence of dust, particularly during the phases immediately following the start of dust production, when the reprocessing of the radiation released by the star is not very efficient; as shown in Fig. 11, in the stars with masses of M ≤ 2 M⊙, the J flux continues to increase until the final AGB phases, thus reflecting the variation of the luminosity of the star more, which is in turn related to the stellar mass.
These arguments indicate the possibility of applying the same technique proposed by H23 to the (J − K, J) diagram, as the latter, particularly if an AGB box covering a magnitude interval higher than that proposed by H23 is used, offers a better opportunity to trace the star formation that occurred during the last ~1.5 Gyr, when M > 1.5 M⊙ stars evolve through the AGB phase.
Figure 12 shows the trend between T90 versus NAGB/NRGB for various filters and AGB boxes. For this exercise, we assumed that δmRGB = 0.25 M⊙ and a time variation of the CSFH ~t1/3 – consistent with the best agreement with the data points shown in Fig. 1. We first considered a standard AGB box with the same extension in the 2MASS J filter as that proposed by H23, namely 0.6 mag. We also considered a larger AGB box extending over 1 mag. We find that the height of the AGB box has no effect on the estimated NAGB/NRGB for galaxies with T90 below 2 Gyr, whereas differences of ~0.2 dex are found for galaxies with more recent star formation.
The same arguments hold when the F115W filter of JWST, the Js filter of Euclid, and the F129 filter of the Roman telescope are considered. Indeed, in Fig. 12, we see that the NAGB/NRGB versus T90 trends derived when AGB boxes extending over 1 mag in J, F115W, Js, and F129 are similar.
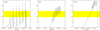 |
Fig. 11 Time variation of the J magnitude of model stars with initial masses of 0.8 M⊙ (left), 2 M⊙ (middle), and 2.5 M⊙ (right). For the 0.8 M⊙ model star, only the case with no RGB mass loss is shown. The yellow shaded region brackets the J-magnitude range extended from 0.15 mag to 0.75 mag above the TRGB. |
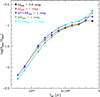 |
Fig. 12 The expected NAGB/NRGB as a function of T90, where the RGB and AGB boxes are selected in the J, F115W, Js, and F129 filters. The results refer to the case of RGB mass loss as δmRGB = 0.25 M⊙ and the time variation of the CSFR as t1/3. |
5.3 Towards a full SFH of a stellar population
For galactic systems with a metallicity of [Fe/H] = −1, the limited number of AGB and RGB stars only allowed us to constrain a single parameter (T90) of the SFH instead of its full parametric form. On the other hand, galactic systems at higher metallicities (e.g. [Fe/H]] = 0.0) have much larger stellar masses. With an abundance of AGB and RGB stars, it is possible to attempt to constrain the parametric form of the SFH (e.g. Rejkuba et al. 2022; Lee et al. 2025) of a stellar population. However, the principal uncertainty of the AGB models used to constrain the SFH is the mass loss at these higher metallicities. Although RGB mass loss has long been thought to be an increasing function of metallicity (Gratton et al. 2010; Denissenkov et al. 2017; VandenBerg & Denissenkov 2018; Tailo et al. 2020, 2022), there is recent evidence that at solar metallicity the trend may reverse (Brogaard et al. 2024; Lee et al. 2025). Hence, instead of blindly extrapolating mass loss to higher metallicities, it is essential to empirically verify the mass loss before moving onto using AGB stars to constrain the full SFH.
6 Conclusions
Results from stellar evolution modelling combined with the description of the dust formation process in the wind of evolved stars were used to investigate the relationship between the duration of the star formation process in galaxies (specifically T90) – the time within which 90% of the stars formed – and the relative fractions of stars populating two selected regions of the (F606W – F814W, F814W) diagram suggested by H23. These are an RGB box in the region just below the TRGB and an AGB box located in the brighter part of the diagram.
The estimated NAGB/NRGB is critically sensitive to the mass lost by low-mass stars during the ascent of the RGB, which affects the duration of the AGB phase, and the possibility that the stars evolve into the AGB box. The time variation of the SFH is also relevant for the determination of NAGB/NRGB. The comparison with the data of the galaxies in the Local Group with known T 90 and NAGB/NRGB indicates that an average RGB mass loss of 0.2–0.25 M⊙ occurred, which is consistent with independent measures of mass loss along the RGB from the colors of HB stars. Regarding the star formation process, the best agreement with the data points is obtained with the assumption that the SFH either strongly peaked towards the ancient epochs, which is the case for the galaxies in which star formation was halted within a few gigayears, or it kept approximately constant, as in the galaxies with more recent star formation. Overall, from this analysis it is possible to deduce a T90 versus NAGB/NRGB trend, which can be used to infer the epoch when star formation stopped.
The present methodology was shown to work even better in the (J − K, J) and (F115W–F277W, F115W) diagrams, and also in the diagrams constructed with the near-IR filters mounted on board Euclid and the Roman Space Telescopes. Indeed, the AGB variation of the J, F115W, Js, and F129 magnitudes are more sensitive to the initial mass of the star than F814W, opening up the possibility to gain a deeper understanding of the star formation process in the recent epochs, provided that a taller AGB box than that proposed by H23 for F814W is adopted.
Data availability
The evolutionary tracks adopted in the present investigation are openly available in Zenodo, at https://zenodo.org/records/19064901.
Acknowledgements
P.V. acknowledges support by the INAF-Theory-GRANT 2022 “Understanding mass loss and dust production from evolved stars”
References
- Boyer, M. L., Srinivasan, S., van Loon, J. T., et al. 2011, AJ, 142, 103 [Google Scholar]
- Brogaard, K., Miglio, A., van Rossem, W. E., Willett, E., & Thomsen, J. S. 2024, A&A, 691, A288 [NASA ADS] [CrossRef] [EDP Sciences] [Google Scholar]
- Brown, T. M., Smith, E., Ferguson, H. C., et al. 2006, ApJ, 652, 323 [NASA ADS] [CrossRef] [Google Scholar]
- Choi, J., Dotter, A., Conroy, C., et al. 2016, ApJ, 823, 102 [Google Scholar]
- Chown, R., Li, C., Athanassoula, E., et al. 2019, MNRAS, 484, 5192 [NASA ADS] [CrossRef] [Google Scholar]
- Correnti, M., Bortolini, G., Dell’Agli, F., et al. 2025, ApJ, 990, 72 [Google Scholar]
- Dalcanton, J. J., Williams, B. F., Seth, A. C., et al. 2009, ApJS, 183, 67 [Google Scholar]
- Dalcanton, J. J., Bell, E. F., Choi, Y., et al. 2023, AJ, 166, 80 [Google Scholar]
- de Boer, T. J. L., Tolstoy, E., Saha, A., et al. 2011, A&A, 528, A119 [NASA ADS] [CrossRef] [EDP Sciences] [Google Scholar]
- de Boer, T. J. L., Tolstoy, E., Hill, V., et al. 2012, A&A, 544, A73 [NASA ADS] [CrossRef] [EDP Sciences] [Google Scholar]
- D’Souza, R., & Bell, E. F. 2018, MNRAS, 474, 5300 [CrossRef] [Google Scholar]
- D’Souza, R., & Bell, E. F. 2018, NatAs, 2, 737 [Google Scholar]
- D’Souza, R., & Bell, E. F. 2021, MNRAS, 504, 5270 [Google Scholar]
- Deason, A. J., Wetzel, A. R., Garrison-Kimmel, S., et al. 2015, MNRAS, 453, 3568 [Google Scholar]
- Denissenkov, P. A., VandenBerg, D. A., Kopacki, G., et al. 2017, ApJ, 849, 2, 159 [Google Scholar]
- Dell’Agli, F., Ventura, P., Schneider, R., et al. 2015, MNRAS, 447, 2992 [Google Scholar]
- Dell’Agli, F., Di Criscienzo, M., Boyer, M. L., & García-Hernández, D. A., 2016, MNRAS, 460, 4230 [Google Scholar]
- Dell’Agli, F., Di Criscienzo, M., Ventura, P., et al. 2018, MNRAS, 479, 5035 [Google Scholar]
- Dell’Agli, F., Di Criscienzo, M., García-Hernández, D. A., et al. 2019, MNRAS, 482, 4733 [Google Scholar]
- Dell’Agli, F., Marini, E., D’Antona, F., et al. 2021, MNRAS, 502, L35 [CrossRef] [Google Scholar]
- Dorman, C. E., Guhathakurta, P., Seth, A. C., et al. 2015, ApJ, 803, 24 [Google Scholar]
- Durrell, P. R., Sarajedini, A., & Chandar, R. 2010, ApJ, 718, 1118 [Google Scholar]
- Fillingham, S. P., Cooper, M. C., Wheeler, C., et al. 2015, MNRAS, 454, 2039 [NASA ADS] [CrossRef] [Google Scholar]
- Gallart, C., Surot, F., Cassisi, S., et al. 2024, A&A, 687, A168 [NASA ADS] [CrossRef] [EDP Sciences] [Google Scholar]
- Gavetti, C., Ventura, P., Dell’Agli, F., et al. 2025, A&A, 699, A23 [Google Scholar]
- Geha, M., Weisz, D., Grocholski, A., et al. 2015, ApJ, 811, 114 [NASA ADS] [CrossRef] [Google Scholar]
- Girardi, L., Williams, B. F., Gilbert, K. M., et al. 2010, ApJ, 724, 1030 [NASA ADS] [CrossRef] [Google Scholar]
- Gratton, R. G., Carretta, E., Bragaglia, A., et al. 2010, A&A, 517, A81 [CrossRef] [EDP Sciences] [Google Scholar]
- Grevesse, N., & Sauval, A. J. 1998, Space Sci. Rev., 85, 161 [Google Scholar]
- Hammer, F., Yang, Y. B., Wang, J. L., et al. 2018, MNRAS, 475, 2754 [NASA ADS] [Google Scholar]
- Harmsen, B., Bell, E. F., D’Souza, R., et al. 2023, MNRAS, 525, 449 [Google Scholar]
- Kamath, D., Dell’Agli, F., Ventura, P., et al. 2023, MNRAS, 519, 2169 [Google Scholar]
- Kroupa, P., 2001, MNRAS, 322, 231 [NASA ADS] [CrossRef] [Google Scholar]
- Lee, A. J., Weisz, D. R., Ren, Y., Savino, A., & Dolphin, A. E. 2025, ApJ, 995, 135 [Google Scholar]
- Li, Y. 2025, ApJ, 988, 179 [Google Scholar]
- Majewski, S. R., Skrutskie, M. F., Weinberg, M. D., & Ostheimer, J. C. 2003, ApJ, 599, 1082 [NASA ADS] [CrossRef] [Google Scholar]
- Mazzitelli, I. 1979, A&A, 79, 251 [Google Scholar]
- Monachesi, A., Gómez, F. A., Grand, R. J. J., et al. 2019, MNRAS, 485, 2589 [NASA ADS] [CrossRef] [Google Scholar]
- Moreno, J., Torrey, P., Ellison, S. L., et al. 2021, MNRAS, 503, 3113 [NASA ADS] [CrossRef] [Google Scholar]
- Patel, E., Kallivayalil, N., Garavito-Camargo, N., et al. 2020, ApJ, 893, 121 [Google Scholar]
- Pastorelli, G., Marigo, P., Girardi, L., et al. 2020, MNRAS, 498, 3283 [Google Scholar]
- Reimers, D. 1977, A&A, 57, 395 [NASA ADS] [Google Scholar]
- Rejkuba, M., Greggio, L., Harris, W. E., Harris, G. L. H., & Peng, E. W. 2005, ApJ, 631, 262 [NASA ADS] [CrossRef] [Google Scholar]
- Rejkuba, M., Harris, W. E., Greggio, L., Crnojević, D., & Harris, G. L. H. 2022, A&A, 657, A41 [NASA ADS] [CrossRef] [EDP Sciences] [Google Scholar]
- Rosenfield, P., Marigo, P., Girardi, L., et al. 2014, ApJ, 790, 22 [CrossRef] [Google Scholar]
- Ruiz-Lara, T., Gallart, C., Bernard, E. J., & Cassisi, S. 2020, NatAs, 4, 965 [Google Scholar]
- Savino, A., Weisz, D. R., Dolphin, A. E., et al. 2025, ApJ, 979, 205 [Google Scholar]
- Skillman, E. D., Monelli, M., Weisz, D. R., et al. 2017, ApJ, 837, 102 [NASA ADS] [CrossRef] [Google Scholar]
- Slater, C. T., & Bell, E. F. 2014, ApJ, 792, 141 [Google Scholar]
- Stewart, K. R., Bullock, J. S., Wechsler, R. H., et al. 2008, ApJ, 683, 597 [NASA ADS] [CrossRef] [Google Scholar]
- Tailo, M., Milone, A. P., Lagioia, E. P., et al. 2020, MNRAS, 498, 5745 [CrossRef] [Google Scholar]
- Tailo, M., Corsaro, E., Miglio, A., et al. 2022, A&A, 662, L7 [NASA ADS] [CrossRef] [EDP Sciences] [Google Scholar]
- Toth, G., & Ostriker, J. P. 1992, ApJ, 389, 5 [NASA ADS] [CrossRef] [Google Scholar]
- VandenBerg, D. A., & Denissenkov, P. A. 2018, ApJ, 862, 72 [NASA ADS] [CrossRef] [Google Scholar]
- Ventura, P., & D’Antona, F. 2009, A&A, 499, 835 [NASA ADS] [CrossRef] [EDP Sciences] [Google Scholar]
- Ventura, P., Zeppieri, A., Mazzitelli, I., et al. 1998, A&A, 334, 953 [NASA ADS] [Google Scholar]
- Ventura, P., di Criscienzo, M., Schneider, R., et al. 2012, MNRAS, 424, 2345 [NASA ADS] [CrossRef] [Google Scholar]
- Ventura, P., Dell’Agli, F., Schneider, R., et al. 2014, MNRAS, 439, 977 [NASA ADS] [CrossRef] [Google Scholar]
- Ventura, P., Karakas, A., Dell’Agli, F., et al. 2018, MNRAS, 475, 2282 [NASA ADS] [Google Scholar]
- Ventura, P., Dell’Agli, F., Tailo, M., et al. 2022, Universe, 8, 45 [NASA ADS] [CrossRef] [Google Scholar]
- Wang, J., Hammer, F., Rejkuba, M., et al. 2020, MNRAS, 498, 2766 [Google Scholar]
- Weisz, D. R., Skillman, E. D., Cannon, J. M., et al. 2008, ApJ, 689, 160 [NASA ADS] [CrossRef] [Google Scholar]
- Weisz, D. R., Dalcanton, J. J., Williams, B. F., et al. 2011, ApJ, 739, 5 [CrossRef] [Google Scholar]
- Weisz, D. R., Dolphin, A. E., Skillman, E. D., et al. 2014, ApJ, 789, 147 [Google Scholar]
- Weisz, D. R., Dolphin, A. E., Skillman, E. D., et al. 2015, ApJ, 804, 136 [NASA ADS] [CrossRef] [Google Scholar]
- Weisz, D. R., Martin, N. F., Dolphin, A. E., et al. 2019, ApJ, 885, L8 [Google Scholar]
- Williams, B. F., Dalcanton, J. J., Dolphin, A. E., et al. 2015, ApJ, 806, 48 [Google Scholar]
Appendix A Observational data
Here, we updated the list of galaxies that were used to calibrate the relationship between AGB/RGB ratio and t90 in Table A.1 which was initially presented in H23. In particular, we recalculated the AGB/RGB ratio of NGC 147 and NGC 185 from the data of Geha et al. (2015), while we updated and expanded the list of dwarf galaxies of Andromeda from the sample of Savino et al. (2025). Furthermore, from the galaxies from the ANGST survey (Dalcanton et al. 2009) presented in H23, we removed the galaxy NGC 4163 due to large uncertainties in its SFH.
AGB/RGB ratios and t90 values for the observational sample of calibrating galaxies.
All Tables
AGB/RGB ratios and t90 values for the observational sample of calibrating galaxies.
All Figures
|
Fig. 1 Updated correlation between the relative fraction of the number of AGB and RGB stars (NAGB/NRGB) in nearby dwarf elliptical galaxies and the time before which 90% of the stellar population of a given galaxy formed, T90 (Harmsen et al. 2023, update in Appendix A). |
| In the text | |
|
Fig. 2 Evolutionary tracks of model stars with a metallicity of [Fe/H] = −1 and initial masses of 0.8 M⊙ (blue line until the helium flash, and then red line from the start of the core-helium-burning phase) and 2 M⊙ (green) on the colour–magnitude (F606W–F814W, F814W) diagram. The regions inside the grey and cyan lines indicate the RGB and AGB boxes, respectively, introduced by H23. The evolutionary sequences are shown until the start of the post-AGB contraction, which is omitted for readability. |
| In the text | |
|
Fig. 3 Top panels: time variation of the F814W magnitude of the 0.8 M⊙ and 2 M⊙ model stars shown in Fig. 2. The grey and yellow regions refer to the F814W magnitudes of the RGB and AGB boxes introduced by H23. The evolution of the 0.8 M⊙ model star is divided into the RGB (blue line) and the post-flash (red) parts. The magenta and green lines refer to the evolution of the 0.8 M⊙ model star, under the hypothesis that 0.1 M⊙ and 0.2 M⊙ were lost during the RGB phase. Bottom panels: time variation of the F814W magnitude of 1.5 M⊙ and 2.5 M⊙ stars. |
| In the text | |
|
Fig. 4 Duration of the phase during which the stars evolve into the RGB (black squares and lines) and the AGB (red dots and lines) boxes introduced by H23 as a function of the initial mass (left) and the formation epoch (right). Dotted lines and green triangles refer to the results obtained by assuming 0.2 M⊙ mass loss during the RGB evolution of M < 1.5 M⊙ stars. |
| In the text | |
|
Fig. 5 Top panels: variation of the relative mass of the galaxy (solid line) and of the fraction of AGB (dashed) and RGB (dotted) stars formed for the δm(RGB) = 0.25 M⊙ case and the SFH by Weisz et al. (2014) and Savino et al. (2025) for the galaxies Andromeda II (top left) and Andromeda I (top right), respectively. Bottom panels: cumulative contribution of various star formation epochs to the present-day ratio of AGB-to-RGB stars of Andromeda II (bottom left) and Andromeda I (bottom right), based on different assumptions regarding the star formation history and the average mass lost by low-mass stars during the RGB phase. Solid lines indicate results found by adopting the SFH by Weisz et al. (2014) for Andromeda II and that of Savino et al. (2025) for Andromeda I; dashed tracks are based on the assumption of constant SFH; dotted lines refer to results obtained when assuming that the SFH decays with a timescale of 7.5 Gyr. Colour-coding indicates the mass lost by stars during the RGB evolution: the cases δm(RGB) = 0.1 M⊙ (black lines), 0.2 M⊙ (magenta), and 0.25 M⊙ (blue) are shown. The grey shaded region indicates the T90 epoch; the red line refers to the AGB-to-RGB ratio derived for Andromeda II and Andromeda I. |
| In the text | |
|
Fig. 6 Top panels: variation of the relative fractions of the mass of the galaxy and of the stars in the RGB and AGB boxes for the δmRGB = 0.25 M⊙ case, based on the SFH by Weisz et al. (2014) for Sculptor (top left) and NGC185 (top right). Bottom panels: cumulative contribution of various star formation epochs to the present-day ratio of AGB-to-RGB stars of Sculptor (bottom left) and NGC185 (bottom right), based on different assumptions regarding the star formation history and the average mass lost by low-mass stars during the RGB phase. Solid lines indicate results found by adopting the SFH by Weisz et al. (2014) for Sculptor and for NGC 185. The colour-coding and the dashed and dotted lines have the same meanings as in Fig. 5. |
| In the text | |
|
Fig. 7 Top panels: variation of the relative fractions of the mass of the galaxy and of the stars in the RGB and AGB boxes for the δmRGB = 0.25 M⊙ case, based on the SFH by Weisz et al. (2014) for Fornax (top left) and KK77 (top right). Bottom panels: cumulative contribution of various star formation epochs to the present-day ratio of AGB-to-RGB stars of Fornax (bottom left) and KK77 (bottom right). Solid lines refer to results based on the SFH from Weisz et al. (2014). The meaning of the dashed and dotted lines, the grey region, and the colour-coding are the same as in Figs. 5 and 6. |
| In the text | |
|
Fig. 8 NAGB/NRGB data of different galaxies compared with the predictions from population synthesis. Top left: comparison between the data and the results obtained by assuming different mass losses during the RGB evolution of low-mass stars, and considering the two cases of an SFH constant (dashed lines) decaying on a timescale of 7.5 Gyr (solid line). Top right: data points compared with the results based on the δmRGB = 0.25 M⊙ assumption, for different SFHs versus time relations (for which the CSFH ∝ t1/3, t, t3 cases were considered). Bottom left: δmRGB = 0.25 M⊙ and CSFH ∝ t1/3, where the two cases that the residual 10% of the stars are formed either within half a gigayear or over the time until 1 Gyr ago are indicated with open points filled with black dots and with open points, respectively. Bottom right: comparison between the data points and the most likely T90 vesus NAGB/NRGB relation (see text for details); the uncertainty associated with the latter trend is indicated by the grey shaded area. |
| In the text | |
|
Fig. 9 We compare our models with three others using a CSFH ∝ t1/3 relation: (a) the PARSEC-COLIBRI model of Rosenfield et al. (2014); (b) the PARSEC-COLIBRI model of Pastorelli et al. (2020); (c) the MIST models of (Choi et al. 2016). |
| In the text | |
|
Fig. 10 Evolution of the mass-loss rate of a 0.9 M⊙ model star of metallicity [Fe/H] = −1 as a function of the stellar luminosity, across the RGB and the AGB phases. Orange triangles indicate the evolution taken from Pastorelli et al. (2020), while the green and red lines refer to the MIST and ATON models, respectively. The masses reported along the evolutionary tracks indicate the mass of the star at the ignition of the helium flash. The vertical blue line indicates the location of the TRGB. |
| In the text | |
|
Fig. 11 Time variation of the J magnitude of model stars with initial masses of 0.8 M⊙ (left), 2 M⊙ (middle), and 2.5 M⊙ (right). For the 0.8 M⊙ model star, only the case with no RGB mass loss is shown. The yellow shaded region brackets the J-magnitude range extended from 0.15 mag to 0.75 mag above the TRGB. |
| In the text | |
|
Fig. 12 The expected NAGB/NRGB as a function of T90, where the RGB and AGB boxes are selected in the J, F115W, Js, and F129 filters. The results refer to the case of RGB mass loss as δmRGB = 0.25 M⊙ and the time variation of the CSFR as t1/3. |
| In the text | |
Current usage metrics show cumulative count of Article Views (full-text article views including HTML views, PDF and ePub downloads, according to the available data) and Abstracts Views on Vision4Press platform.
Data correspond to usage on the plateform after 2015. The current usage metrics is available 48-96 hours after online publication and is updated daily on week days.
Initial download of the metrics may take a while.