Fig. 8
Download original image
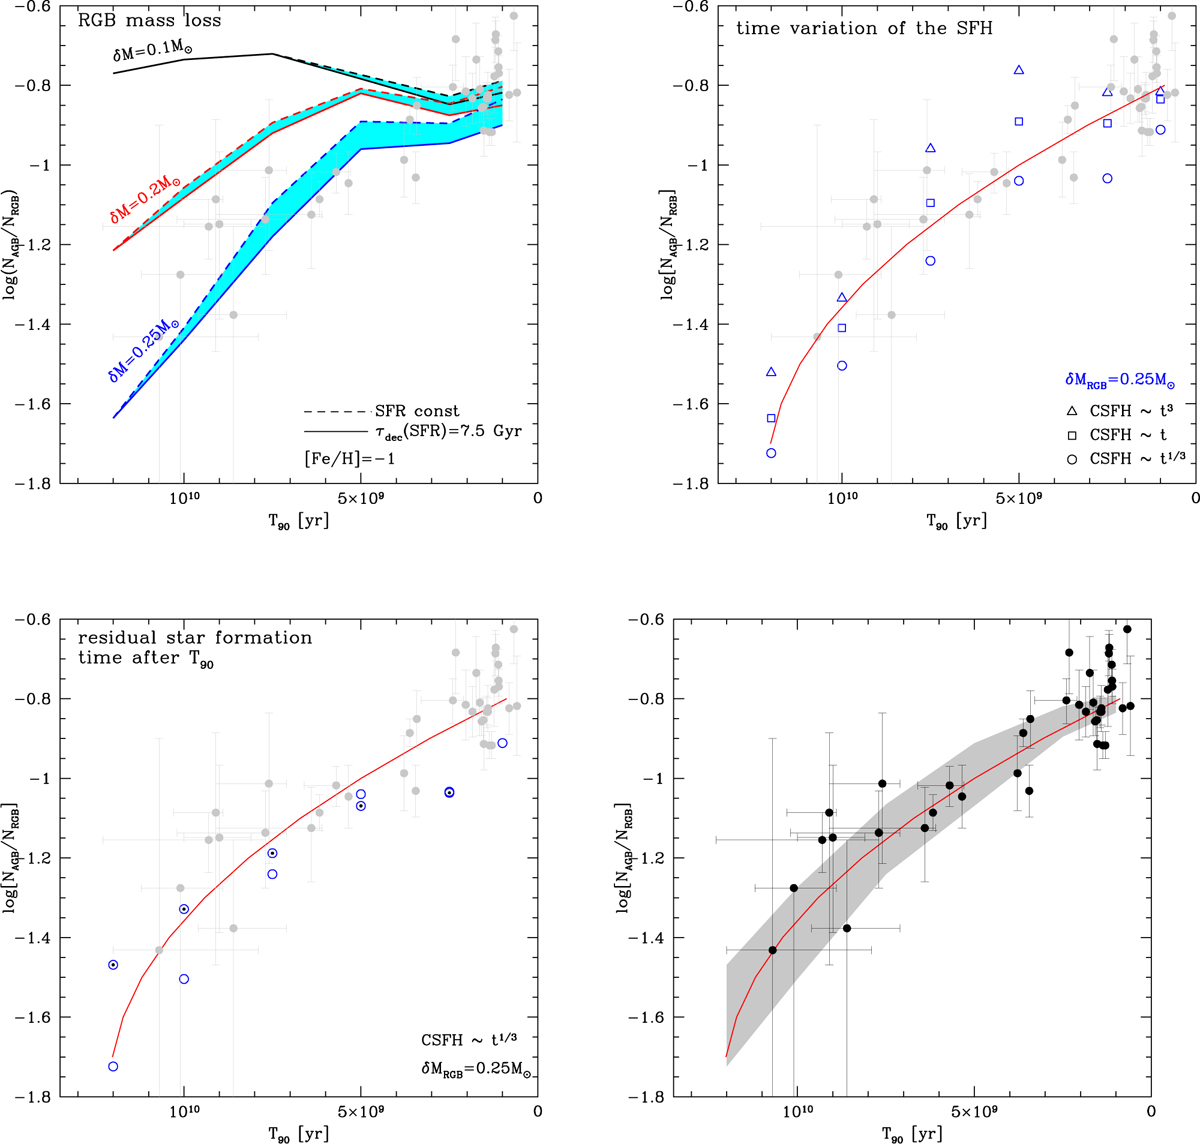
NAGB/NRGB data of different galaxies compared with the predictions from population synthesis. Top left: comparison between the data and the results obtained by assuming different mass losses during the RGB evolution of low-mass stars, and considering the two cases of an SFH constant (dashed lines) decaying on a timescale of 7.5 Gyr (solid line). Top right: data points compared with the results based on the δmRGB = 0.25 M⊙ assumption, for different SFHs versus time relations (for which the CSFH ∝ t1/3, t, t3 cases were considered). Bottom left: δmRGB = 0.25 M⊙ and CSFH ∝ t1/3, where the two cases that the residual 10% of the stars are formed either within half a gigayear or over the time until 1 Gyr ago are indicated with open points filled with black dots and with open points, respectively. Bottom right: comparison between the data points and the most likely T90 vesus NAGB/NRGB relation (see text for details); the uncertainty associated with the latter trend is indicated by the grey shaded area.
Current usage metrics show cumulative count of Article Views (full-text article views including HTML views, PDF and ePub downloads, according to the available data) and Abstracts Views on Vision4Press platform.
Data correspond to usage on the plateform after 2015. The current usage metrics is available 48-96 hours after online publication and is updated daily on week days.
Initial download of the metrics may take a while.