| Issue |
A&A
Volume 699, July 2025
|
|
|---|---|---|
| Article Number | A23 | |
| Number of page(s) | 19 | |
| Section | Stellar structure and evolution | |
| DOI | https://doi.org/10.1051/0004-6361/202451724 | |
| Published online | 25 June 2025 | |
A study of Andromeda to improve our knowledge of the evolution and dust production by AGB stars
1
Dipartimento di Matematica e Fisica, Università degli Studi Roma Tre, Via della Vasca Navale 84, 00100 Roma, Italy
2
INAF, Observatory of Rome, Via Frascati 33, 00077 Monte Porzio Catone (RM), Italy
3
ASI-Space Science Data Center, Via del Politecnico, I-00133 Rome, Italy
4
Istituto Nazionale di Astrofisica– Osservatorio Astronomico di Padova, Vicolo dell’Osservatorio 5, I-35122 Padova, Italy
⋆ Corresponding author.
Received:
30
July
2024
Accepted:
16
April
2025
Aims. We study the asymptotic giant branch (AGB) population of the galaxy M31, based on available HST and Spitzer data, to characterize the individual sources in terms of mass, metallicity and formation epoch of the progenitors. We dedicated particular attention to the derivation of the dust production rate of the stars, in an attempt to determine the global current dust production rate of the galaxy, divided between the silicate- and the carbonaceous-dust contributions.
Methods. The study of the galaxy was addressed by a population synthesis approach, which used results from stellar evolution modelling complemented by the description of the dust formation process in the wind. This step required the knowledge of the star formation history and of the age-metallicity relationship of M31, obtained in previous investigations. We compared the results from synthetic modelling and the data available to characterize AGB stars in M31.
Results. We find that the majority of the AGB population of M31 is composed of low-mass stars of different metallicities formed between 6 Gyr and 14 Gyr ago, with an additional, significant contribution from the progeny of 1.7−2.5 M⊙ stars formed during the secondary peak in the star formation history, which occurred between 1 and 2 Gyr ago. The dust production rate of the galaxy is mostly provided by carbon stars, whose contribution is of the order of 4 × 10⁻⁴ M⊙/yr; the rest of the dust production rate is accounted for by silicate production from massive AGB stars, which occurs at a rate of ∼ 6 × 10⁻⁵ M⊙/yr. We also comment on the implications of the present results for the reliability of AGB modelling.
Key words: stars: abundances / stars: AGB and post-AGB / stars: evolution / Hertzsprung-Russell and C-M diagrams / stars: luminosity function / mass function / galaxies: individual: Andromeda
© The Authors 2025
 Open Access article, published by EDP Sciences, under the terms of the Creative Commons Attribution License (https://creativecommons.org/licenses/by/4.0), which permits unrestricted use, distribution, and reproduction in any medium, provided the original work is properly cited.
This article is published in open access under the Subscribe to Open model. Subscribe to A&A to support open access publication.
1. Introduction
Stars that have an initial mass below ∼ 8 M⊙, after the exhaustion of their central helium, evolve through the so-called asymptotic giant branch (AGB) phase. The energy release from AGB stars is primarily provided by a H-burning shell, where CNO nucleosynthesis takes place. Periodically, ignition of a helium-rich layer just above the degenerate core occurs, in a series of events generally known as thermal pulses (TPs) (Schwarzschild & Härm 1965). The AGB phase, during which the stars lose their external mantle under the action of intense stellar winds (Habing 1996), is followed by the general contraction of the stellar structure, which starts the evolution towards the post-AGB and PNe phases that precede the white dwarf cooling phase.
Growing interest in this class of star is related to their role as pollutants of the interstellar medium and thus to the important feedback they cause within the host environment, in relation to the gas lost via intense stellar winds (Groenewegen & Sloan 2018) and the dust formed in great quantities in their expanded circumstellar envelope. AGB stars provide a relevant contribution to the enrichment of the interstellar medium in some chemical species, such as carbon and nitrogen (Kobayashi et al. 2020), and are believed to play a crucial role in the determination of the chemical patterns in star forming regions of Local Group galaxies (Vincenzo et al. 2016) and in the formation of multiple populations in globular clusters (Ventura et al. 2001).
Furthermore, AGB stars are efficient dust manufacturers owing to the thermodynamic conditions of their winds, which prove extremely favourable to the condensation of gas molecules into solid grains (Gail & Sedlmayr 1985). For this reason, they are believed to contribute significantly to dust production in nearby galaxies (Matsuura et al. 2009, 2013; Matsuura 2011; Schneider et al. 2014; Srinivasan et al. 2016; Boyer et al. 2017).
Some research groups have recently implemented the description of dust formation in the wind of AGBs, coupled to the modelling of the evolution of the central stars (Ventura et al. 2012, 2014; Nanni et al. 2013, 2014). The results from these studies were successfully used to characterize the evolved stellar populations of the Magellanic Clouds (Dell’Agli et al. 2015a; Dell’Agli et al. 2015b; Nanni et al. 2016, 2019; Riebel et al. 2012; Boyer et al. 2012) and other Local Group galaxies (Dell’Agli et al. 2016; Dell’Agli et al. 2018; Dell’Agli et al. 2019).
Despite the steps forward accomplished in the aforementioned studies, several uncertainties still affect the predictive power of the results obtained in regard to the efficiency of dust production by AGB stars. These uncertainties are due to poor knowledge of some physical phenomena that play an important role in the evolution of AGB stars (Ventura & D’Antona 2005a,b; Karakas & Lattanzio 2014) and to uncertainties related to the dust formation process (Ventura et al. 2014).
To shed new light on the evolutionary and dust production properties of AGB stars, a comparison with results from IR surveys of galaxies with resolved stellar populations is the most efficient tool, particularly if a variety of environments are investigated that differ in their star formation history and age-metallicity relation. Advancement in this field is required not only to improve our understanding of the AGB properties, but also to develop a new approach in the study of galaxies with resolved stellar populations, so that the IR properties of the evolved stellar component can be used to reconstruct the star formation history (SFH). This is particularly important in the recently begun James Webb Space Telescope (JWST) epoch if we consider the increasing number of galaxies outside the Local Group that have already been observed or will be targeted in the near future. For a significant fraction of these galaxies, AGB stars will provide the only opportunity to reconstruct their SFH when we consider that the main sequence will be hardly sampled by JWST observations.
In this work we focus on one of the most interesting and well-investigated galaxies: Andromeda (M31). At a distance of 776 Kpc (Dalcanton et al. 2012), M31 is the spiral galaxy closest to the Milky Way. Thanks to its proximity, M31 is easily observed with Hubble Space Telescope (HST) and Spitzer, which enable a thorough investigation of the resolved stellar population. For these reasons, M31 represents a unique occasion to achieve a detailed stellar population study at solar metallicity. A significant boost to this aim came from the Panchromatic Hubble Andromeda Treasury (PHAT; Dalcanton et al. 2012) survey, which imaged about 30% of the star forming disc of the galaxy in different bands, ranging from the IR to the ultraviolet. These investigations facilitated a variety of studies, such as the derivation of the ancient (Williams et al. 2017) and recent (Lewis et al. 2015) SFH, and the metallicity distribution (Gregersen et al. 2015). The latter analysis revealed that the stellar population of M31 that formed in the last 10 Gyr is dominated by a solar metallicity component, which is rather uncommon, if not unique, with respect to other galaxies in the Local Group. In a recent work, Goldman et al. (2022, hereafter G22) used available HST and Spitzer data to construct a large sample of the AGB star candidates (∼346 000) in M31, part of which were classified as O-rich or C-rich (Boyer et al. 2019) according to the molecular features detected in their spectral energy distribution (SED). An important result obtained by G22 is that the fraction of stars classified as ‘extreme’ AGBs1, which are those believed to provide the dominant contribution to the dust production rate of the entire galaxy, is slightly above 1%, thus significantly smaller than the 4.5% and 6% found in the Large and Small Magellanic Clouds, respectively (Boyer et al. 2011; Riebel et al. 2012).
The scope of the present work is to analyze the AGB population of M31 in order to obtain a full characterization of the sources observed, in terms of the mass, metallicity, formation epoch of the progenitors, and the current evolutionary stage and dust production rate (DPR). The primary objectives of this study are: a) to determine the overall DPR of M31, separated into the carbon dust and silicate contribution; b) to assess whether the efficiency of carbon dust production at solar metallicities is comparable with lower metallicities, as derived from previous studies on the Magellanic Clouds and other Local Group galaxies; c) to understand whether the small percentage of extreme AGBs detected in M31 is related to metallicity and/or SFH effects, or if it is an observational bias connected to the completeness of the data.
This analysis is based on results from stellar evolution modelling and on the description of the dust formation in the wind, which is used to predict how the SED of stars of different mass (thus formed in different epochs) and metallicity evolves during the AGB phase. This step is crucial to undertake a stellar population synthesis approach, in which we compare the expected distribution of the stars in the various observational planes based on different combinations of filters with the results from the observations published by G22.
The structure of the paper is as follows. We describe the methodology and the input adopted in Section 2. Section 3 presents the catalogue of AGB stars in M31 constructed by G22. Section 4 discusses the main uncertainties that affect the predictive power of the results. A comparison between the observations is addressed in Section 5 and a discussion of the results obtained is given in Section 6.
2. Methodology
The analysis presented in this work is based on the comparison between the observed distribution of the stars belonging to the evolved stellar population of M31 with the results obtained by a population synthesis approach: in the latter, the synthetic distribution of the stars is derived on the basis of the time evolution of the SED of model stars of different mass and chemical composition.
This method requires the modelling of the AGB phase of the stars, which must be coupled to the description of the dust formation process in the wind, considering the important effects that the presence of dust in the circumstellar envelope of stars has on the shape of the SED, thus on the expected colours and magnitudes in the different bands.
In the following, we provide the description of the various steps followed in the present analysis: a) the modelling of the evolution of the stars, from their birth, through the AGB phase, until the start of the white dwarf cooling; b) the schematization followed to describe the dust formation process and to calculate the DPR during the AGB lifetime; c) the code used to derive the AGB evolution of the SED; d) the population synthesis approach followed to build the synthetic distribution of the stars on the different colour-magnitude planes.
2.1. Stellar evolution modelling
The evolutionary sequences used in this work were calculated by means of the ATON code for stellar evolution (Ventura et al. 1998). The physical input most relevant for the present investigation are the following:
-
Convection. The temperature gradient within regions of the star unstable to convective currents was determined by means of the Full Spectrum of Turbulence (FST) convective model (Canuto & Mazzitelli 1991). We also considered the Mixing Lenght Theory (MLT) modelling (Vitense 1953) with variable mixing length parameter α, to explore the effect of adopting convective models corresponding to different efficiencies of the convective transport of energy. An exhaustive discussion on how the choice of the convective model affects the description of the AGB phase can be found in Ventura & D’Antona (2005a).
-
Molecular opacities. The surface molecular opacities were calculated via the AESOPUS tool (Marigo & Aringer 2009), which allows us to consider the effects of the variation of the surface abundances of the CNO species. This is particularly important to model the advanced evolutionary AGB phases of low-mass stars, when the surface chemistry is significantly enriched in carbon (Ventura & Marigo 2009, 2010).
-
Mass loss. With regard to the red giant branch (RGB) phase, mass loss was modelled according to the classic Reimers (1975) prescription, with free parameter ηR = 0.4. This regards M > 2 M⊙ stars only, because, as discussed below, the evolution of lower mass stars is started from the core helium burning phase. For what concerns the AGB evolution, the determination of the mass loss rate during the oxygen-rich phases is based on the treatment by Blöcker (1995). To explore the effect of the mass loss treatment on the description of the AGB phase of M ≥ 4 M⊙ stars, we run additional simulations with the mass loss description by Vassiliadis & Wood (1993, VW93). During the C-rich phases we adopted the formulae given by the Berlin group in Wachter et al. (2002) and Wachter et al. (2008).
As already highlighted in the Introduction, M31 is characterized by a variety of stars differing in mass, chemical composition and formation epoch of the progenitors. To describe stars of different chemistry, we considered extant evolutionary sequences previously published by our group, of metallicity Z = 0.001 (Ventura et al. 2014), Z = 0.004 and Z = 0.008 (Marini et al. 2021), and Z = 0.014 (Ventura et al. 2018). In the low-mass domain all the above computations, started from the pre-main sequence, were recently extended until the start of the white dwarf cooling, as described in Kamath et al. (2023).
For the stars undergoing the helium flash the computations are re-started from the quiescent core helium burning phase, based on the core masses reached at the tip of the red giant branch (TRGB). These stars experience a long RGB evolution, during which the surface gravities become so small that a significant fraction of the mass of their envelope is lost before they reach the TRGB. In the following sections, particularly in Sections 4 and 5 and in the Figs. 1 and 8, we will refer to the evolution of a given model star by mentioning the mass at the start of core helium burning, keeping in mind that it must be considered as a lower limit of the mass of the progenitor. As the mass lost by a given star during the ascending of the RGB is uncertain, the corresponding computations from the HB were started by assuming several values of the total mass, to simulate the spread in the RGB mass loss. Therefore, the models presented in the aforementioned investigations were completed with additional sequences, calculated on purpose for the present work. Further computations were added to explore the effects of convection modelling, as described in the following sections.
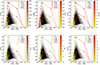 |
Fig. 1. Data points in the catalogue of M31 AGB stars by G22 are shown with grey points on the colour-magnitude (F110W−F160W, F160W) plane. Solid lines represent the AGB evolutionary tracks of model stars of different mass and metallicity, with connecting points that correspond to evolutionary stages taken in the middle of each inter-pulse phase. The different lines refer to the evolution of the M = 0.65 M⊙ star of metallicity Z = 10−3 (triangles), and to the solar metallicity model stars of mass M = 0.8 M⊙ (pentagons), M = 1.05 M⊙ (stars), M = 2.5 M⊙ (squares), M = 3.5 M⊙ (diamonds), and M = 5 M⊙ (circles). The different panels provide information on the luminosity of the model stars (top, left), effective temperature (top, middle), (gas) mass loss rate (top, right), surface C/O ratio (bottom, left), DPR (bottom, middle), and optical depth at 10 μm (bottom, right). |
2.2. Dust formation in the wind of AGB stars
To model dust formation in the wind of AGB stars, we followed the approach proposed by the Heidelberg team (Ferrarotti & Gail 2001, 2002, 2006), which was used in previous works by our team (Ventura et al. 2012, 2014) and by other research groups (Nanni et al. 2013, 2014). Dust formation during a given evolutionary phase is modelled on the basis of the following ingredients: mass, effective temperature, luminosity, mass loss rate and surface chemistry of the star. All these information are obtained by stellar evolution modelling and the ATON code, described earlier in this section. All the detailed equations governing the dynamic and thermodynamic stratification of stellar winds and the growth of dust grains are listed and discussed in Ventura et al. (2012).
Dust particles are assumed to form and grow in the wind, which expands isotropically from the photosphere of the star. In carbon-rich environments we consider the formation of solid carbon and silicon carbide (SiC), whereas in the winds of oxygen-rich stars we assume that the dust species that form are silicates and alumina dust (Al2O3); solid iron is formed in either cases. These are the most stable species, formed in greatest quantities (Ferrarotti & Gail 2006).
The dynamics of the wind is described by the momentum equation, where the acceleration is determined by the competition between gravity and radiation pressure acting on the newly formed dust grains. The coupling between grain growth and wind dynamics is given by the extinction coefficients, describing the effects of absorption and scattering of the radiation by dust particles. For the species considered here, the extinction coefficients were found by using the optical constants from Zubko et al. (1996) (amorphous carbon), Pegourie (1988) (SiC), Begemann et al. (1994) (alumina dust), Ossenkopf et al. (1992) (silicates) and Ordal et al. (1988) (solid iron).
The modelling of dust formation, as described above, enables the determination of: a) the size reached by the grains of the various dust species listed above; b) the fraction of gaseous silicon, carbon, aluminium and iron condensed into dust in the circumstellar envelope of the stars (see Eqs. (20)–(23) and (34)–(35) in Ferrarotti & Gail 2006); c) the DPR for each dust species. The latter depends on the gas mass loss rate, the surface chemical composition and the fraction of gas condensed into dust (see Sect. 5.2 in Ferrarotti & Gail 2006).
2.3. Evolution of the spectral energy distribution
On the observational side, the most relevant effect of the presence of dust in the surroundings of the stars is the reprocessing of the radiation released from the photosphere, which is intercepted and reprocessed by dust grains, so that the whole SED is shifted to the IR part of the spectrum. The larger the amount of dust formed, the longer the wavelength at which the SED peaks. The SED will be also characterized by the presence of specific emission or absorption features associated to the formation of some dust species, such as the 11.3 μm feature, due to the formation of SiC, or the 9.7 μm and 18 μm features, favoured by the presence of silicates.
To model the evolution of the SED, we use the DUSTY code (Nenkova et al. 1999), which produces the SED of the star based on the dust mineralogy, the optical depth at a specific wavelength, the effective temperature and the luminosity: all these information are obtained by the results from stellar evolution + dust formation modelling, described in Sections 2.1 and 2.2, applied to different evolutionary phases of the model stars considered. The input radiation from the photosphere of carbon stars is found by interpolation in effective temperature, surface gravity and C/O ratios among the COMARCS model atmospheres (Aringer et al. 2009) of the appropriate metallicity. For what concerns oxygen-rich stars, we interpolated among the NEXTGEN tables (Hauschildt et al. 1999).
2.4. Population synthesis
The stellar evolution and dust formation modelling described earlier in this section are used in a population synthesis approach, aimed at deriving the expected population of AGB stars nowadays evolving in M31, according to the SFH given below. The results obtained will be tested by comparing the distributions of the sources by G22 and of the stars in the synthetic sample in the (F110W−F160W,F160W) and ([3.6]−[4.5],[4.5]) colour-magnitude planes. The analysis in the HST plane will allow a statistical analysis to characterize the individual sources in terms of the mass, chemical composition and formation epoch of the progenitor stars; on the other hand, the Spitzer plane will be used to investigate dust production by AGB stars evolving nowadays in M31.
We consider star formation starting from 14 Gyr ago until now, and extract for each epoch considered a number of stars, based on the SFH given in Williams et al. (2017) and, for ages below 400 Myr, Lewis et al. (2015). We weight the number of stars extracted assuming the Kroupa’s initial mass function (Kroupa 2001). The metallicity adopted at each time is chosen according to the age-metallicity relationship published in Williams et al. (2017). The number of AGB stars considered is derived on the basis of the evolutionary timescales of the model stars of different mass and on the duration of the AGB phase. The corresponding colours and magnitudes are given by the results from the computations of the synthetic SEDs, as described in Section 2.3. The foreground extinction of E(B–V) = 0.062 mag (Schlegel et al. 1998) is taken into account in the model.
We note that the present investigation is applied to the disc of M31 as a whole, for which we use the SFH and the age-metallicity relation given above. This choice prevents a detailed discussion of the effects of any spatial metallicity gradient across the galaxy, such as that investigated in detail by Gregersen et al. (2015), and of the role of metallicity on the formation of carbon stars, addressed in Boyer et al. (2019), where 21 sub-fields of M31 were considered. On the other hand, this is the only possibility consistent not only with the applicability of the description of the past history of the galaxy given by Williams et al. (2017), but also of the synthetic approach itself, which demands the use of a large statistics, thus high number samples.
3. AGB star sample in M31
The analysis developed in the present investigation is based on the interpretation of the dataset of M31 evolved stars published in G22. The catalogue by G22 is based on archival HST data, matched with the sources in the Spitzer catalogue, to obtain a collection of near-IR photometry for the evolved stellar population of the galaxy.
To identify AGB candidates, G22 adopted the same criteria extensively used by Boyer et al. (2019), with the scope of excluding blue supergiants and main sequence stars from the list of sources considered. The selection relies on specific colour and magnitude cuts in the near-IR HST bands, according to the following choices:
-
F110W < 19.28 mag or F160W < 18.28 mag
-
F110W−F160W > 0.88 mag
-
F814W−F160W > 2.4 mag
To prevent the exclusion of dusty AGB stars from the sample, G22 added stars to the catalogue that would be ruled out on the basis of the criteria given above, in case that their Spitzer [3.6]−[4.5] colours are consistent with those expected for dusty AGB stars. More specifically, the stars with ([3.6]−[4.5]) > 0.5 mag and [4.5]< 16.4 mag are included in the catalogue, independently of their near-IR properties. This made 78 sources, excluded on the basis of the near-IR criteria, to be added to the catalogue.
The overall catalogue of the part of the M31 disc analyzed by G22 consists in 346 623 sources with available near-IR HST photometry. For 56843 of these objects the Spitzer photometry is also available. The HST data are complete down to 4 magnitudes below the TRGB (located at F160W ∼ 18.2 mag, [3.6] ∼ 18.4 mag by G22), thus can be used for statistical analysis. Regarding the Spitzer photometry, G22 estimate ∼90% completeness down to [3.6] = 15.6 mag and that significant incompleteness affects the data with [3.6] fainter than ∼18.5 mag.
The distribution of the stars in the catalogue by G22 in the colour-magnitude (F110W−F160W, F160W) plane is reported in Fig. 1. Overlapped to the data points, shown with grey points, we show the evolutionary tracks of some selected model stars of various mass and chemical composition. We restrict the attention on the F160W < 18.8 mag region, to better appreciate the morphology of the evolutionary tracks of model stars of different mass, particularly in the low-mass domain. This choice rules out the faintest sources, which, however, account for ∼0.4% only of the overall sample. As discussed in Section 2.4, these stars, surrounded by significant amounts of dust, characterized by extremely low fluxes in the 1 − 1.5 μm spectral region, will be investigated in detail on the basis of their position on the ([3.6]−[4.5], [3.6]) plane. The six panels of the figure give information on different physical and chemical properties of the model stars, and on the dust production efficiency.
4. The role of convection and mass loss
Before entering the characterization of the evolved stellar population of M31, we discuss the three most relevant uncertainties affecting the predictive power of the results obtained from AGB modelling: the treatment of convection, the mass lost by low-mass stars during the RGB phase and the mass loss rates experienced by massive AGB stars descending from M ≥ 4 M⊙ progenitors. Convection modelling affects the thermodynamic stratification of the outer regions of the star, the RGB mass loss determines the mass with which the stars evolve through the core helium burning and the early-AGB phases, the mass loss treatment reflects into the AGB lifetimes of massive AGBs.
4.1. Convective modelling
The thermodynamic stratification of the outermost regions of giant stars is characterized by the presence of convective currents and of an overadiabaticity peak in the sub-photospheric regions (Salaris 2012), whose height, which turns extremely sensitive to the convective model adopted (Salaris et al. 2018), has a deep impact on the effective temperature of the star and, as far as dust-free objects are considered, on the colours. This does not hold when the stars are surrounded by large amounts of dust, since in that case the radiation released from the photosphere is reprocessed by dust particles, thus the shape of the SED is practically independent of the effective temperature.
To investigate the impact of convection modelling on the results obtained in the present work, we run simulations of model stars of various mass and metallicity, based on different convection modelling. We mainly focus on low-mass stars, because we will see that their progeny is the dominant AGB population of M31, thus the modelling of their evolution has a significant effect on the statistical analysis of the observations. Furthermore, the values of the effective temperature of these objects will affect the IR colours for the whole AGB lifetime: indeed these stars produce little or no dust (see the results regarding the 0.65 M⊙ and 0.8 M⊙ in the bottom, middle and right, panels of Fig. 1), therefore the shape of the SED is not altered by dust reprocessing.
The top-left panel of Fig. 2 shows the time evolution of the effective temperature Teff of the metal-poor model star of 0.65 M⊙ (this is the mass of the star at the beginning of the core helium burning phase), whose evolutionary track is represented by the line connecting the triangles in Fig. 1. The results obtained with the FST description of convection are compared with those based on the MLT treatment, where different values of the free parameter α were used.
The Teff of the different models is approximately constant during the inter-pulse phases for the whole AGB lifetime, with the exception of the very final evolutionary phases, when the contraction of the stellar structure favours the heating of the external regions. We note a ∼1000 K difference between the two extreme cases based on the FST description (Teff∼ 4000 K) and on the MLT, α = 1 model (Teff∼ 3000 K); the MLT, α = 1.4, 1.9 model stars follow an intermediate behaviour. The treatment of the convective instability also affects the overall duration of the AGB phase, because the cooler the effective temperature, the lower the surface gravity, the higher the rate at which mass loss takes place: the time differences among the different models are within 20%.
The bottom panels of Fig. 2 show the evolutionary tracks of the different 0.65 M⊙, Z = 10−3 models reported in the top, left panel on the colour-magnitude (F814W−F160W, F160W) (left) and (F110W−F160W, F160W) (right) planes. We consider these two planes because the criteria adopted by G22 to select AGB stars in M31, described in Section 3, are based on cuts on the (F814W−F160W) and (F110W−F160W) colours, indicated with magenta, vertical lines in the bottom panels of Fig. 2.
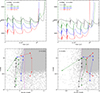 |
Fig. 2. Time variation of the effective temperatures of 0.65 M⊙ model stars of metallicity Z = 0.001 (top, left panel) and Z = 0.004 (top, right), calculated with different convective models. The corresponding evolutionary tracks of the Z = 0.001 model star on the (F814W−F160W, F160W) and (F110W−F160W, F160W) planes are shown in the bottom, left and bottom, right panels, respectively. The points along the tracks indicate the middle of the different inter-pulse phases. Data points in the catalogue of M31 AGB stars by G22 are shown with grey points and G22 cuts are marked with dashed, magenta lines. |
The evolutionary tracks on these planes are nearly vertical, because the effective temperatures are approximately constant during the AGB phase and the DPRs are extremely small (see bottom, middle panel of Fig. 1). From the results shown in the top, left panel of Fig. 1 we deduce that the increase in the F160W flux is due to the rise in the luminosity, determined by the gradual increase in the core mass, in turn related to the nuclear activity in the CNO burning shell. The turn to the blue of the final part of the evolutionary tracks indicates the start of the post-AGB phase. The uncertainty in the determination of (F814W−F160W) associated to convection modelling is ∼1.2 mag, while for (F110W−F160W) it is ∼0.2 mag. The treatment of convection also affects the largest F160W fluxes reached during the AGB phase. This is again due to the differences in the effective temperatures, with cooler models reaching higher near-IR fluxes for a given luminosity.
The effects of convection modelling on the determination of the effective temperature of AGB stars change with metallicity. As shown in the top, right panel of Fig. 2, in the Z = 4 × 10⁻³ case the Teff difference between the FST and the MLT (α = 1) models is ∼1400 K, which reflects into colour differences of ∼2.4 mag and ∼0.3 mag for (F814W−F160W) and (F110W−F160W), respectively. The results obtained here will be discussed in Section 5.1.1 to derive the correct convection model to use as function of metallicity.
4.2. Mass loss during RGB evolution
Despite several recipes have been proposed to model mass loss during the RGB evolution (Reimers 1975; Catelan 2000; Schröder & Cuntz 2005), no firm conclusion has been reached yet on this argument, so that the fraction of the stellar mass lost during the RGB phase is unknown. This issue is particularly relevant for M < 1.5 M⊙ stars, which lose a significant fraction of their mass during this phase. As stated in Section 2.1, it is necessary to make an assumption for the RGB mass loss, which determines the total mass of the star at the beginning of the core helium burning phase.
To understand how the assumptions regarding the RGB mass loss affect the results of the AGB evolution, we show in Fig. 3 the time variation of the luminosity (left) and of the F160W flux (right) of model stars that start the core helium burning phase with mass in the 0.6−0.75 M⊙ range. These can be considered as the progeny of e.g. 0.8 M⊙ progenitors, whose mass loss during the RGB phase was in the 0.05−0.2 M⊙ range.
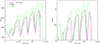 |
Fig. 3. Time variation of the luminosity (left panel) and of the F160W flux (right) of Z = 0.001 model stars of initial mass (taken at the beginning of the core helium burning phase) 0.6 M⊙ (magenta line), 0.65 M⊙ (black), 0.75 M⊙ (green). |
The rise in the luminosity is a common feature of the AGB evolution of the model stars considered, but the largest luminosities reached depend on the initial mass: the 0.6 M⊙ model star reaches ∼ 3000 L⊙, whereas in the 0.75 M⊙ case we find ∼ 4000 L⊙. The differences in the luminosity reflect into the expected F160W flux, which is about half magnitude brighter in the 0.75 M⊙ model star in comparison with the 0.6 M⊙ case (see right panel of Fig. 3). We will see that these information are crucial to interpret the observed near-IR luminosity function of the sample described in Section 3, which will offer the opportunity to discriminate among the various possibilities regarding the RGB mass loss.
4.3. Mass loss rate of massive AGBs
The stars of initial mass above ∼ 3.5 M⊙ are characterized by the ignition of proton-capture nuclear activity at the base of the convective envelope (Blöcker & Schönberner 1991), a phenomenon known as hot bottom burning (HBB). Since the high luminosities associated to the ignition of HBB (Blöcker & Schönberner 1991) are inevitably accompanied by a considerable increase in mass loss rates, the treatment of mass loss has a deep influence on the physical evolution of these stars. This is due in particular to the strong impact of mass loss, which eventually turns HBB off, thus triggering the decrease in the luminosity of the star after the phase during which HBB is strongest.
The two most popular recipes adopted are those from Blöcker (1995) and VW93. The former, based on the hydrodynamical studies by Bowen (1988), predicts a tight relationship between mass loss rate and luminosity, with Ṁ ∝ L3.7. According to VW93, the luminosity scales with the pulsation period according to Eq. (5) in VW93, until reaching the super-wind phase, during which the wind is radiation-driven, so that Ṁ = β L(cvexp), where β represents the average number of scattering processes by dust particles experienced by each photon.
To understand the impact of the mass loss description on the evolution of massive AGBs, we show in Fig. 4 the differences between the results obtained in the modelling of a 5 M⊙ model star, when the Blöcker (1995) and the VW93 treatments are adopted. The comparison between the time variations of the luminosities (left panel of the figure) shows a clear similarity during the first half of the AGB lifetime, as the evolution is mainly driven by the growth of the core mass, which affects the strength of HBB. The luminosity of the VW93 model grows bigger than in the Blöcker (1995) case, because the VW93 mass loss rates are generally smaller, thus the envelope consumption is slower. This situation changes during the very final AGB phases, when the super-wind phase begins and the mass loss rates of the VW93 model star, of the order of 2 × 10⁻⁴ M⊙/yr, are significantly higher than in the Blöcker (1995) model (∼ 7 × 10⁻⁵ M⊙/yr).
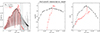 |
Fig. 4. AGB time variation of the luminosity (left panel), DPR (middle), [3.6] fluxes (right) of two model stars of initial mass 5 M⊙, where mass loss was described by means of the Blöcker (1995) (black squares) and the VW93 treatments (red triangles). |
The differences in the mass loss treatment also affect the DPR, as can be seen in the middle panel of Fig. 4. In the Blöcker (1995) case the DPR is found to be above 5 × 10⁻⁸ M⊙/yr for almost the totality of the AGB lifetime, whereas in the VW93 model dust production is negligible during the largest fraction of the AGB phase, with the exception of the latest 3 inter-pulses, when the DPR is around 10−6 M⊙/yr.
The evolution of the shape of the SED is also found different in the two cases: the average higher DPR found in the Blöcker (1995) model star makes the SED to be more shifted to the mid-IR, whereas in the VW93 case higher near-IR fluxes are expected. This trend can be seen in the right panel of Fig. 4: the Blöcker (1995) model star exhibits [3.6] fluxes higher than those achieved by the VW93 model.
The evolutionary tracks of the two model stars, presented in Fig. 4, in the (F110W−F160W, F160W) and ([3.6]−[4.5],[3.6]) planes are shown in Fig. 5. In the (F110W−F160W, F160W) diagram (left panel) we note that in the Blöcker (1995) model star the track moves to the red when F160W ∼ 16.3 mag is reached, as dust production favours the shift of the SED to the near-IR spectral region. On the other hand, in the VW93 case dust production is delayed (see middle panel of Fig. 4), thus the star evolves to higher luminosities (left panel of Fig. 4) and F160W fluxes, so that the track develops vertically until F160W ∼ 15 mag, before turning to the red. Moving to the ([3.6]−[4.5],[3.6]) plane, we note that the track of the Blöcker (1995) model star is generally redder than in the VW93 case, but for the last 3 inter-pulse phases, during which the dust production by the VW93 model star is highest (see the last 4 triangles in the middle panel of Fig. 4). The distributions of massive AGB stars on this plane obtained via population synthesis in the two cases are very different: when mass loss is modelled according to Blöcker (1995), we expect a consistent group of stars in the 0.2 mag < ([3.6]−[4.5]) < 0.6 mag, 13 mag < [3.6] < 15 mag region of the plane, whereas in the VW93 case the number of stars characterized by the afore-mentioned [3.6] and [4.5] magnitudes would be much smaller.
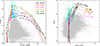 |
Fig. 5. Evolutionary tracks of the same 5 M⊙ model stars reported in Fig. 4, based on the Blöcker (1995) and VW93 treatments of mass loss, are shown on the (F110W−F160W, F160W) (left panel) and ([3.6]−[4.5],[3.6]) (right panel) planes, with, respectively, black squares and red triangles. Magenta diamonds, orange circles and green pentagons refer to the evolution, respectively, of 4 M⊙, 6 M⊙ and 7 M⊙ stars, where mass loss was described following VW93. Black crosses refer to the evolution of a 7 M⊙ star, obtained with the Blöcker (1995) description of mass loss. Data points in the catalogue of M31 AGB stars by G22 are shown with grey points. Bright sources with F160W < 16 mag are shown with cyan points. |
5. The characterization of the evolved stars of M31
According to Williams et al. (2017), the SFH of M31 is characterized by an early phase of intense activity, started ∼14 Gyr ago and extending over ∼6 Gyr, with rates of star formation of the order of 8 M⊙/yr. It is during this phase that most of the stars of M31 formed, with metallicities ranging from [Fe/H]∼ −1 to solar2. Based on the evolutionary timescales of the model stars introduced in Section 2.1, we conclude that the stars formed during this period that are nowadays evolving through the AGB descend from ∼ 0.8 M⊙ stars with [Fe/H]∼ −1, 0.85−0.9 M⊙ stars with sub-solar chemical composition, and 1−1.2 M⊙ stars of solar metallicity.
A later intense episode of star formation, characterized by star formation rates of the order of 5 M⊙/yr, took place in M31 between 1 and 2 Gyr ago, in an environment characterized by solar or nearly solar chemical composition. The stars formed during this second episode of star formation that are nowadays undergoing the AGB evolution are the progeny of 1.7−2 M⊙ stars. Some star formation in M31 occurred also in more recent epochs (Lewis et al. 2015), which reflects into the presence of massive AGBs (initial masses 4−5 M⊙) in the current evolved stellar population.
To characterize the evolved stars in M31, we use the population synthesis method described in Section 2.4, based on the afore-discussed SFH of M31 and the results from stellar evolution + dust formation modelling (Sections 2.1 and 2.2). We compare the theoretical distribution of the stars on the (F110W−F160W,F160W) and ([3.6]−[4.5],[3.6]) planes, as derived from population synthesis, with the dataset by G22. In building the synthetic sample of stars we took into account the colour and magnitude cuts described in Section 3. From this analysis we aim at characterizing the individual sources of M31, in terms of mass, formation epoch and chemical composition of the progenitor stars.
We will first consider the (F110W−F160W, F160W) diagram, to undertake a detailed statistical analysis, which is made possible by the arguments presented in Section 3 regarding the completeness of the data down to the cuts on the F110W and F160W magnitudes imposed by G22. This step is important to check for consistency between the results from stellar evolution + dust formation modelling and the observations, to draw information regarding the still poorly known phenomena affecting the modelling of the AGB phase, with particular attention to those described in Section 4, and finally to reach a thorough description of the evolved stellar population of M31, according to how stars of different mass and metallicity distribute across the (F110W−F160W, F160W) plane. The requirement from this part of the analysis is that, once the constrains adopted by G22 described in Section 3 are considered, the numerical consistency of the overall sample, as also the distribution of the stars across the (F110W−F160W, F160W), is the same as in G22.
The second part of the analysis will be focused on the interpretation of the distribution of M31 stars on the ([3.6]−[4.5],[3.6]) plane obtained with the Spitzer data. The stars in the G22 sample for which the Spitzer data are available are only a small fraction ( ∼ 16.5%) of the global sample, which prevents any statistical approach. On the other hand, this is the plane to be considered for the study of dust production in M31, because the SED of dusty stars peaks at wavelengths λ > 3 μm, whereas the F110W and F160W fluxes are low or even negligible. This can be deduced by inspection of Fig. 1, where by looking at the tracks of the 2.5 M⊙ and 3.5 M⊙ model stars we understand that only during the first inter-pulses following the achievement of the C-star stage the stars can be detected in F110W and F160W. Therefore, part of the stars with very low fluxes in the 1 − 1.6 μm region, populating the bottom side of the (F110W−F160W, F160W) diagram, are indeed the most relevant sources to study dust production, to be investigated in the ([3.6]−[4.5],[3.6]) plane.
5.1. Understanding the HST data
The luminosity function (LF) of the sources in the G22 catalogue is reported in Fig. 6: the black line indicates the number counts in the different F160W bins. Approximately half of the stars are located into the 18 mag < F160W < 18.28 mag strip. The remaining sources are distributed in the F160W < 18 mag region: considering magnitude bins 0.5 mag wide, we find ∼37% of stars with 17.5 mag < F160W < 18 mag, ∼12% with 17 mag < F160W < 17.5 mag, ∼2% with 16.5 mag < F160W < 17 mag, plus a small fraction below 1% at brighter magnitudes.
 |
Fig. 6. Left: The F160W LF of the stars included in the G22 sample, indicated with a black line, is compared with the results obtained from population synthesis, shown with a red, dashed line. The contribution from stars of different mass in the various F160W bins is also given. In the legend the initial masses of the progenitor stars are indicated. Right: the same F160W LF reported on the left panel, in a logarithmic scale. For readability we show the total LF only, omitting the contributions from the stars of different mass. The large discrepancy between the dashed and the solid lines in the F160W > 18.5 domain is due to the cut adopted by G22 in that F160W range, where only the (few) sources identified as extreme AGBs were included. |
The large fraction of evolved stars of M31 in the faintest F160W bins is related to the dominant presence of low-mass stars among the AGB population, particularly those of metal-poor or sub-solar metallicity discussed at the beginning of this section. The fractions of stars in the three fainter F160W bins, found via the population synthesis approach, are extremely sensitive to the assumptions regarding convection and mass loss used to model the evolution of low-mass stars of different metallicity. In the following, we illustrate the choices on the input macro-physics that allow us to reproduce the distribution of the stars shown in Fig. 6.
5.1.1. The choice of the convective model
In the low-metallicity domain the FST and the solar-calibrated MLT (α = 1.9) modelling of convection are not consistent with the observations, as the model stars evolve at bluer (F814W−F160W) colours than the cut described in Section 3: this is shown in the bottom, left panel of Fig. 2, where we see that in the Z = 10−3 case the MLT description with α = 1 is required. The Z = 4 × 10⁻³, low-mass model stars are cooler at the surface than the lower metallicity counterparts (see top panels of Fig. 2), thus the α = 1.4 choice also leads to values of (F814W−F160W) consistent with the cut imposed by G22. Turning to the solar metallicity, the G22 colour criteria are satisfied independently of convection modelling, as far as low-mass stars is concerned. Some differences are found in regard of the modelling of the initial part of the AGB evolution of M ≥ 1.5 M⊙ stars, which do not meet the G22 colours cuts when the FST description is used. This is clear in Fig. 1, where we see that during the initial AGB phases the FST evolutionary tracks are bluer than the colour cut assumed by G22 (see Section 3), thus they would be ruled out by the G22 selection.
The star counts in the F160W > 18 mag domain are of little help to select the convection model most appropriate to describe solar metallicity stars, as the statistics is dominated by low-mass stars, with little (if any) contribution from M ≥ 1.5 M⊙ stars. On the other hand, the star counts at brighter F160W are extremely sensitive to the possible presence of M ≥ 1.5 M⊙ stars, particularly of the progeny of the 1.7−2 M⊙ stars that formed during the secondary peak in the SFH of the galaxy.
If we rely on the MLT modelling, we find that the progeny of 1.7−2 M⊙ stars would populate the 17.5 mag < F160W < 18 mag sample by G22, so that the sources in this region of the plane would outnumber the fainter counterparts, which in fact account for half of the total sample. There is no combination of the physical ingredients adopted to build the evolutionary sequences able to repair this inconsistency, unless the stars formed during the secondary peak in the SFH of M31 are ruled out by the cuts adopted by G22 during the initial part of the AGB evolution: this is what we find when the FST modelling is used, thus we will rely on the FST model stars as far as the solar metallicity is concerned.
5.1.2. Selecting the mass loss during the RGB evolution
The choice of the amount of mass lost by the stars during the ascending of the RGB, δMRGB, is a key point to set the fractions of the stars in the different bins. This can be understood based on the arguments presented in Section 4.2 and the results shown in Fig. 3, where we see that the capability of low-mass stars to attain specific luminosities or near-IR fluxes is tightly connected to the mass at the beginning of the core helium burning activity, which in turn is sensitive to δMRGB.
The LF reported in Fig. 6, with ∼87% of the sources observed at F160W > 17.5 mag and half of the sample at F160W > 18 mag, is reproduced if we assume that δMRGB = 0.2, 0.25, 0.3 M⊙ for low-mass stars of metallicity Z = 10−3, Z = 4 × 10⁻³ and solar, respectively. This is the only combination that enables us to reproduce the observed percentages. Indeed numerical experiments where the mass loss experienced during the RGB phase was artificially altered with respect to the values given above showed the following: a) if the mass loss suffered either by low-mass, Z = 10−3 stars or by their Z = 4 × 10⁻³ counterparts was 0.05 M⊙ higher than the values given above, these stars would barely evolve at F160W < 18.28 mag, so that the percentage of stars in the faintest F160W bin would drop to below 30%; b) if for the same stars we assumed a RGB mass loss 0.05 M⊙ lower than the values previously mentioned, these stars would exceed the F160W = 18 mag threshold and populate the 17.5 mag < F160W < 18 mag bin, which would then become the most populated one, accounting for ∼60% of the entire population; c) for what regards the low-mass, solar metallicity stars of initial mass ∼ 1.1−1.2 M⊙, the assumption of a δMRGB value 0.05 M⊙ smaller than the 0.3 M⊙ given above would make these stars to evolve into the 17 mag < F160W < 17.5 mag bin, whose numerical consistency would increase from ∼12% to ∼22%.
AGB star distribution in M31.
5.2. The characterization of the different AGB populations of M31
Based on the assumptions described in Sections 5.1.1 and 5.1.2, we interpreted the near-IR observations of M31 and identified the stars found in the different regions of the (F110W−F160W, F160W) plane. An overview of the interpretation reached can be seen in Fig. 7: in the top, middle, and bottom panels the stars are divided according to the chemical composition, the formation epoch and the C/O ratio, respectively.
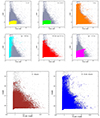 |
Fig. 7. AGB candidates from the G22 sample in M31 are shown with grey points in the colour-magnitude (F110W−F160W, F160W) diagram. The expected distribution of metal-poor, sub-solar, and solar metallicity stars from the synthetic modelling is indicated with different colour-coding in the top, left, middle and right panels, respectively. The central panels indicate an age classification, in which the different sources are divided among young stars formed earlier than 200 Myr ago (left panel), old objects formed in ancient epochs (right), and intermediate age stars, which eventually reach the C-star stage (middle). The bottom panels show the distribution of C- and O-rich stars. |
In the following description we will move across the diagram, starting from the faintest sources populating the F160W > 18 mag region. The results of the analysis done are summarized in Figs. 6, 7 and in Table 1, where we report the comparison between the fraction of stars (with respect to the total sample) by G22 with that expected from synthetic modelling, and general information on the mass and formation epoch of the progenitors of the stars in each bin.
We are not focusing on the dust, as this issue will be discussed more extensively later in this section, on the basis of the Spitzer data, as commented in the initial part of this section.
5.2.1. The oldest stars
The faintest stars in the G22 sample formed earlier than 10 Gyr ago. In the initial part of Section 5 we concluded that these objects are mostly the progeny of ∼ 0.85 M⊙ stars of sub-solar metallicity (∼42%) and of stars descending from low-metallicity, ∼ 0.8 M⊙ progenitors (∼27%). The location of these sources in the (F110W−F160W, F160W) plane is shown in the top, left and middle, panels of Fig. 7, respectively. In Section 5.1.2 we argued that these sources suffered mass loss during the RGB phase, then started core helium burning with masses of the order of 0.6 M⊙.
The AGB evolution of this class of stars is described in Section 4.1 by Ventura et al. (2022). They experience a small number of TPs (of the order of 3 − 4) and a very few third dredge-up (TDU) events. Therefore, the surface chemical composition is almost unchanged during the AGB lifetime, because the only modification takes place during the first dredge-up. As shown in the top, right and bottom, middle panels of Fig. 1, the mass loss rate never exceeds 10−10 M⊙/yr and little dust is formed in the wind. The evolutionary tracks of these objects move nearly vertically, thus they are concentrated on the bluest, lower side of the region covered by the sample stars. In Fig. 1 they populate the lowest part of the plane, evolving at F160W > 18 mag for the entire AGB life.
A significant fraction (∼20%) of the sources populating the lower part of the plane descends from ∼ 1.1−1.2 M⊙ stars of solar metallicity, which formed around 6–9 Gyr ago. Still following the discussion presented in Sections 4.2 and 5.1.2, we assume that they started the post-flash evolution with masses of the order of 0.8 M⊙. They experience ∼10 TPs before the envelope is lost, and reach luminosities above 4000 L⊙ during the final AGB phases. We see in the bottom, middle panel of Fig. 1 that even for these stars dust production is negligible.
The track of a ∼ 0.8 M⊙ model star is indicated with pentagons in Fig. 1. Unlike the lower mass counterparts discussed earlier, these stars evolve at brighter magnitudes during the second part of their AGB life, until reaching F160W ∼ 17.6 mag; this is due in part to the higher luminosities reached and also to the cooler effective temperatures (up to 3200 K), which further rise the flux emission in the near-IR spectral region.
Overall, the distribution of the old AGB stellar population of M31 is the one shown in the middle, right panel of Fig. 7. ∼5% of the stars in the F160W > 18 mag region of the (F110W−F160W, F160W) plane descend from 1.5−3 M⊙ progenitors, formed between 0.5 Gyr and 2.5 Gyr ago. These stars, whose evolution is described in Section 4.2 by Ventura et al. (2022), became carbon stars after the accumulation of carbon in the surface regions (see bottom, left panel of Fig. 1) under the action of repeated TDU events. As visible in Fig. 1, indeed the evolutionary tracks of these stars cross the F160W > 18 mag region of the plane during the first inter-pulses following the achievement of the C-star stage, when the quantity of dust in the circumstellar envelope is still sufficiently low that they can still be observed in the near-IR. Therefore, the sources considered here have just reached the C-star stage and are characterized by surface C/O ratios in the 1 − 1.5 range. This is further confirmed by the distribution of C-stars in the bottom, left panel of Fig. 7.
During these evolutionary phases, these carbon stars are generally brighter than the previously discussed lower-mass counterparts populating the same region of the plane, as their luminosities are in the 4000 L⊙< L < 13000 L⊙ range, the brightest descending from ∼ 3 M⊙ progenitors. Nevertheless, they also populate the lower side of the plane for the following reasons: a) soon after the occurrence of the TP, C-stars experience a minimum in their luminosity evolution for a non-negligible time while the CNO shell is not fully reignited; b) the near-IR flux is lowered by the dust reprocessing of the radiation emitted by the photosphere, which favours the shift of the SED towards the mid-IR. Still related to reprocessing by dust particles are the red colours of these stars, which populate the (F110W−F160W) > 1.2 mag region.
We find a tight connection between the optical depth at 10 μm and the colour: τ10 ∼ 0.12+0.1 × [(F110W−F160W)-2]. The DPRs associated with the formation of carbon dust are below 2 × 10⁻⁸ M⊙/yr, as shown in the bottom, middle panel of Fig. 1.
5.2.2. The solar metallicity population
We discussed in Section 5.2.1 that among the stars present in the largest quantities in the F160W > 18 mag region of the (F110W−F160W, F160W) plane, only those descending from solar metallicity progenitors of mass slightly higher than solar (identified with the model star starting core helium burning with 0.8 M⊙ in Fig. 1) evolve to magnitudes brighter than F160W = 18 mag: in the 17.5 mag < F160W < 18 mag range they constitute the dominant population, accounting for almost 70% of the stars. They reach these F160W values during the second part of the AGB evolution, when the luminosity is in the 3000 L⊙< L < 4500 L⊙ range (top, left panel of Fig. 1). In this magnitude bin we also find stars of sub-solar mass, still with solar chemistry, accounting for ∼10% of the total population.
These stars evolve as oxygen-rich for the whole AGB phase. The dust production, limited to silicates and traces of alumina dust (Dell’Agli et al. 2014), is extremely small, with rates Ṁdust < 5 × 10⁻¹⁰ M⊙/yr (see bottom, middle panel of Fig. 1). They are concentrated on the blue side of the plane, in the region (F110W−F160W) < 1.2 mag, as the radiation released from the photosphere is not reprocessed by dust particles.
The residual ∼20% of the sources in the 17.5 mag < F160W < 18 mag magnitude range descend from 1.5−3 M⊙ progenitors, half of which formed during the peak in the SFH of M31 discussed in the previous sections. These stars are known to become C-stars during the second part of the AGB evolution, thus we expect that about 10% of the stars in this region of the plane are C-rich and evolve on the red side of the diagram, at (F110W−F160W) > 1.2 mag. The current luminosities span the interval 6000 L⊙< L < 13000 L⊙.
Similarly to the lower luminosity C-rich counterparts discussed in the previous point, we find that the detected C-stars are evolving during the early phases following the achievement of the C-star stage, before the near-IR flux becomes negligible owing to the formation of great quantities of carbonaceous dust. It is therefore not surprising that the DPR is limited to Ṁdust < 2 × 10⁻⁸ M⊙/yr. The trend of the optical depth τ10 with (F110W−F160W) is the same as discussed above.
5.2.3. The progeny of the burst in the SFH of M31 (1 − 2 Gyr ago)
The F160W < 17.5 mag region of the (F110W−F160W,F160W) plane is populated only by the progeny of M > 1.2 M⊙ stars, which formed not earlier than ∼4 Gyr ago. More specifically, as shown in Fig. 6, we find that half of the population falling in the 17 mag < F160W < 17.5 mag strip is populated by stars of initial mass 1.7 M⊙< M < 2 M⊙ of nearly solar metallicity, formed during the secondary peak in the SFH of M31 discussed at the beginning of this section, which occurred 1 − 2 Gyr ago. Other sources populating this region of the plane descend from progenitors of mass ∼ 1.5 M⊙ (∼14%) and ∼ 2.5 M⊙ stars (∼23%), which formed around 2.5 Gyr and 600 Myr ago, respectively. The position of these stars on the observational plane is shown in the middle panel of the central line in Fig. 7.
As mentioned in Section 5.2.1, the stars of initial mass in the 1.5−2.5 M⊙ range become carbon stars, owing to the effects of a series of TDU episodes that rise the surface carbon. The transition from the oxygen-rich to the C-star phase is accompanied by the significant increase in the mass loss rates, which favours the rapid loss of the external mantle, which ends the AGB evolution (Ventura & Marigo 2010; Ventura et al. 2022). Indeed for the majority of the AGB lifetime they evolve as M-type objects, while the C-star phase is restricted to the last few TPs. This holds in particular for M ≤ 2 M⊙ stars, which evolve as C-star only for a couple of TPs; conversely, the carbon-rich phase of 2.5−3 M⊙ stars is longer, as a longer time is required before the external mantle is lost.
On the observational side, shortly after the start of the C-star phase, the evolutionary tracks move to the red: indeed all the stars in the 17 mag < F160W < 17.5 mag region of the plane with (F110W−F160W) > 1.5 mag are carbon stars. Despite most of the stars populating this F160W bin become carbon stars, we find that the fraction of C-stars barely reaches 20%, owing to the relatively short duration of the C-star phase. Furthermore, as discussed earlier in this section, after the first couple of inter-pulse phases following the achievement of the C-star stage, the flux in the 1−1.6 μm spectral region decreases dramatically; this can be seen once more by looking at the evolutionary track of the 2.5 M⊙ model star in Fig. 1, where it is clear that the formation of carbon dust is accompanied by a significant decrease in the near-IR flux.
Therefore, the carbon stars considered here are caught in an evolutionary phase when the carbon excess with respect to oxygen is so small that the DPRs barely exceed 10−8 M⊙/yr (see bottom, middle panel of Fig. 1). The trend of the optical depth with colour is similar to those seen in the cases discussed before, the largest τ10 of carbon stars being of the order of 0.1 (see bottom, right panel of Fig. 1).
The F160W magnitude range explored here is completed by a small fraction ( ∼ 5%) of stars, descending from 1.2−1.3 M⊙ progenitors, formed around 4 Gyr ago, which does not reach the C-star stage. During the final part of their AGB evolution they evolve at colours 1.2 mag < (F110W−F160W) < 1.5 mag, with DPRs Ṁdust < 10−9 M⊙/yr and optical depths τ10 ∼ 0.1. These sources are the counterparts of the reddest, low-mass oxygen-rich stars, discussed in Marini et al. (2020).
5.2.4. The young population of M31
The F160W = 17 mag threshold is reached only by stars of initial mass above 3 M⊙, once their luminosity exceeds 10^4 L⊙: this poses an upper limit of ∼400 Myr to their age. In particular, the 16.5 mag < F160W < 17 mag region (see middle, central panel of Fig. 7) is mostly populated by 3−3.5 M⊙ stars, formed between 200 and 400 Myr ago, with luminosities in the 10^4−1.6 × 10^4 L⊙ range, as seen in the top, left panel of Fig. 1.
This is the region of the plane harbouring the largest fraction (∼30%) of carbon stars. The reason is that the stars in this mass domain reach the C-star stage when their luminosity and near-IR fluxes are within the magnitude bin considered, while they populate the fainter F160W bins during the previous oxygen-rich phases. This can be seen by looking at the evolutionary track of the 3.5 M⊙ model star in Fig. 1. An additional reason for the relatively large percentage of carbon stars in this part of the plane, also clear based on the inspection of the evolutionary track in Fig. 1, is that during the oxygen-rich phase these stars evolve at colours too blue to pass the criteria described in Section 3, thus they are not included in the G22 sample.
Even in this case, as discussed for the other carbon stars with fainter F160W fluxes, the carbon accumulated in the surface regions is still sufficiently small to allow these sources to be detectable in the near-IR spectral region. Therefore the DPR is not expected to exceed 10−8 M⊙/yr, while the optical depth τ10 is below 0.05. All these information can be verified by looking at the bottom panels of Fig. 1.
The fraction of C-stars found in this F160W bin is in tension with the results by G22, according to which C-stars account for ∼5% of the stars. It is likely that this is at least partly due to the criterion adopted by G22 to distinguish C-stars from M-type sources, in turn based on the classification proposed by Boyer et al. (2013, 2017), which relies on the C and M spectral models from Aringer et al. (2009, 2016). The application of this criterion to the present case is not obvious, because 3−3.5 M⊙ stars, that populate this region of the plane, attain surface C/O ratios just above unity during the first inter-pulse phases after the C-star stage is reached, while the model atmospheres by Aringer et al. (2009) are available for C/O > 1.05 only. It is possible that the SED of part of the C-stars populating this region of the plane do not exhibit the molecular features associated to the presence of C2 and CN molecules at the base of the Boyer et al. (2017) classification. Furthermore, C-stars with a 1.05≤ C/O < 1.08 were probably excluded by the Boyer et al. (2017) criterion since they fall in the K-type stars region.
A further reason for the higher fraction of C-stars found in the present analysis with respect to the results obtained by G22, mentioned earlier in this section, could be related to the fact that the colours of M-type stars evolving to this F160W bin are too blue to satisfy the cuts imposed by G22, which therefore rule out some M-type objects. Finally, this discrepancy might be connected to an overestimate of the efficiency of the TDU in this mass range, which might demand a lower efficiency with respect to the lower mass counterparts. This offers the opportunity of using these results to draw important, independent conclusions on the efficiency of the convective instability of the stars of mass close to the threshold for the HBB ignition, both in terms of the degree of overadiabaticity in the convective envelopes (which affects the colour) and the TDU efficiency (related to the surface carbon enrichment). We leave this problem open.
In the 16.5 mag < F160W < 17 mag range we also find ∼3% of stars descending from M≥ 4 M⊙ progenitors, evolving at luminosities between 2 × 10^4 L⊙ and 5 × 10^4 L⊙, as indicated in the top, left panel of Fig. 1, where various evolutionary stages of the 5 M⊙ model star are indicated with open circles. These stars evolve as oxygen-rich objects during the whole AGB life, as the ignition of HBB inhibits the achievement of the C-star stage (Ventura et al. 2022). They produce silicate in their winds, so the SED is gradually shifted to the IR. As shown in Fig. 1, the evolutionary tracks of these stars move to the red, crossing the range of F160W considered here in the 2 mag < (F110W−F160W) < 2.5 mag region of the plane. The rate at which dust production takes place, shown in the bottom, middle panel of Fig. 1, is 2 × 10⁻⁸ M⊙/yr, and the optical depth is found to be correlated with the near-IR colour, according to the relationship τ10 = 1+2 × [(F110W−F160W)-2].
5.2.5. Stars undergoing HBB
The F160W < 16.5 mag region of the (F110W−F160W, F160W) diagram is mainly populated by massive AGB stars that experience HBB, and by ∼20% of stars descending from ∼ 3.5 M⊙ progenitors, populating the 16 mag < F160W < 16.5 mag strip, which attain these large near-IR fluxes during the final part of the O-rich phase, just before turning into C-stars. The brightest sources in the F160W < 16 mag region are highlighted in cyan in the left panel of Fig. 5, and the same colour coding is used to indicate their position on the ([3.6]−[4.5],[3.6]) plane, in the right panel of the figure. The position of these sources is well reproduced by the evolutionary tracks of 4−7 M⊙ stars, corresponding to the phases when the F160W flux reaches a maximum value, before dust production takes over, the SED is shifted to the medium-IR and the F160W flux decreases.
We therefore identify the bright sources in the (F110W−F160W, F160W) plane as the progeny of M ≥ 4 M⊙ stars, formed not later than 200 Myr ago. These stars, whose luminosity is in the 1.5 × 10^4 L⊙< L < 7 × 10^4 L⊙ range, are nowadays experiencing HBB and are evolving through the final evolutionary phases before the start of efficient dust formation, which prevents detection in the near-IR. Their dust production is below 10−8 M⊙/yr. The distribution of massive AGBs in the (F110W−F160W, F160W) plane is reported in the middle, left panel of Fig. 7: we note that they are distributed across a large portion of the plane, as during the early AGB and the initial phases of the AGB evolution they evolve at F160W > 16 mag (see Fig. 5).
5.3. The interpretation of Spitzer data
The distribution of the M31 sources in the catalogue described in Section 3 in the colour magnitude ([3.6]−[4.5],[3.6]) diagram obtained with the Spitzer filters is shown in Fig. 8. Overlapped to the data points are the evolutionary tracks of the same model stars shown in Fig. 1.
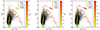 |
Fig. 8. Data points of the M31 sources included in the catalogue by G22 in the [3.6]−[4.5],[3.6]) plane obtained with the Spitzer filters are shown with grey points. Solid lines represent the same evolutionary tracks of some selected model stars reported in Fig. 1. The information regarding the C/O ratio, the DPR and the optical depth at 10 μm is shown in the left, central, and right panels, respectively. |
A large fraction (∼85%) of the stars populating the near-IR diagram discussed in Section 5.2 is missing in this plane. We refer to the old stars addressed in Section 5.2.1, which, as shown in Fig. 8 (see the sequence of triangles), do not evolve at [3.6]< 17.5 mag, thus they would populate a region of the plane severely affected by the incompleteness effects discussed in Section 3. Indeed only < 0.1% of the stars are observed in the [3.6]> 17.5 mag region and no sources are detected at [3.6]> 17.7 mag.
The colour distribution of the data points reported in Fig. 8 shows that ∼92% of the sample stars with available Spitzer photometry are located into the vertical strip −0.3 mag < ([3.6]−[4.5]) < 0.1 mag. This is consistent with the theoretical expectations, as all the evolutionary tracks shown in Fig. 8 run approximately vertically during the dust-free phases, at ([3.6]−[4.5]) ∼ −0.1 mag. This region of the plane is populated by stars formed in different epochs, descending from progenitors of various mass. The results shown in the middle panel show that the rate at which they are forming dust is extremely small, either because they are low-mass stars that produce little quantities of dust during their life, or because they are caught during the initial part of the AGB lifetime, when dust production is still negligible.
The largest fraction of these objects (∼ 40%) is the progeny of solar metallicity stars of mass slightly above solar, populating the two faintest bins in the (F110W−F160W, F160W) plane discussed in Sections 5.2.1 and 5.2.2, whose evolutionary track can be identified with that of the 0.8 M⊙ model star (pentagons) in Fig. 8, which shows that these stars are located in the [3.6]> 16.1 mag region.
Regarding the [3.6]< 16 mag region of the plane, we find that approximately half of the stars descend from 1.7−2.5 M⊙ progenitors, formed around 1 − 2 Gyr ago. The remaining half being the progeny of M ≥ 1.5 M⊙ stars evolving through the initial part of the AGB, before the start of dust production.
Stars with mass in the 1.25 M⊙≤ M ≤ 3.5 M⊙ range, represented by the evolutionary tracks of the 2.5 M⊙ (squares) and 3.5 M⊙ (diamonds) model stars in Fig. 8, evolve first along the vertical band discussed earlier, then the evolutionary tracks turn to the red, after the C-star stage is reached. All the sources in the ([3.6]−[4.5]) > 0.2 mag, [3.6]> 14 mag region of the plane descend from 1.2−3.5 M⊙ progenitors of solar metallicity, that became carbon stars. The reddest data points in Fig. 8 extend to ([3.6]−[4.5]) ∼ 2 mag, where we find stars that, after experiencing several TDU events, have reached surface C/O in the 1.5 − 2 range (see left panel of Fig. 8), produce carbon dust with rates ∼ 10−7 M⊙/yr (central panel of Fig. 8) and are characterized by optical depths τ10 ∼ 2 (right panel of Fig. 8).
The [3.6]< 14 mag region of the ([3.6]−[4.5],[3.6]) plane is populated only by the progeny of M ≥ 4 M⊙ stars, as lower mass objects do not reach these [3.6] fluxes. As indicated by the tracks of the 4−7 M⊙ model stars in the right panel of Fig. 5, these stars evolve to the red when formation of silicates begins, until reaching ([3.6]−[4.5]) ∼ 1.5 mag. We tentatively identify the group of stars in the regions centred at ([3.6]−[4.5]) ∼ 0.5 mag, [3.6]∼13 − 13.5 mag and ([3.6]−[4.5]) ∼ 1.2 mag, [3.6]∼13 mag as stars experiencing HBB, evolving through the final AGB phases.
5.4. The luminosity function of carbon stars
Boyer et al. (2019) determined the chemical type of a sub-sample of AGB stars in M31, based on medium-band HST imaging. In Fig. 9 we show the LF of the 346 sources classified as carbon stars, in the F160W (top; normalized to unity in the 16.5 mag < F160W < 17 mag bin) and [3.6] magnitudes (bottom; normalized to unity in the 14 mag < [3.6] < 14.5 mag bin). In the same figure we also report the LF obtained via the population synthesis method described in Section 2.4, where the thin, blue and the dashed, magenta lines indicate the LF obtained with and without the cuts discussed in Section 3, respectively. In the first case we obtain a total of ∼37 000 carbon stars, whereas if the colour and magnitude cuts are not applied we get ∼57 000 C-rich objects.
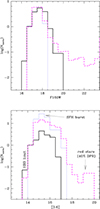 |
Fig. 9. The LF of carbon stars in F160W (top) and [3.6] (bottom), normalized to 17 and 14 mag, respectively. The LF of the carbon stars sample as selected by Boyer et al. (2019) is shown in black; the LF of the carbon stars synthetic population produced in this work is reported in magenta, while the synthetic LF obatined by considering the cuts proposed by G22 (see Section 3) is displayed in blue. |
Understanding the near-IR LF is a tricky task, because several factors affect its morphology. A difficulty arising in the interpretation of the LF, as clear in the evolutionary tracks of M≥ 1.25 M⊙ model stars in Fig. 8, is that the variation of the [3.6] magnitude is not directly correlated with the dust surrounding the stars, in turn related to the amount of carbon dredged-up in the surface regions: the [3.6] flux first increases, as the SED of the star is gradually shifted to the near-IR spectral region, then decreases when the peak of the SED moves to the mid-IR (Marini et al. 2021). The evolutionary tracks of carbon stars, as visible in Fig. 8, are characterized by the presence of a maximum in the [3.6] flux, which divides the initial phase, during which little dust is formed in the circumstellar envelope, from the latest evolutionary phases, when efficient dust production takes place. Each [3.6] magnitude bin is therefore crossed twice during the AGB evolution: however, following the discussion of Section 5.2.3, where we stressed the very short evolutionary timescales characterizing the final part of the AGB phase, we find that the statistics is dominated by the least obscured stars, which account for more than 95% of the population. These arguments hold in the [3.6]< 17.5 mag domain only: indeed we do not expect to find carbon stars with fainter [3.6] fluxes, if not during the very final AGB phases, when the SED peaks at λ > 5 μm (Marini et al. 2021). On the other hand, the LF of carbon stars in F160W is related to the dust production: as shown in Fig. 1, low-mass stars reach the brightest F160W magnitude when they enter the C-rich stage. Soon after, the increasing carbon dust production enshrouds the emission at λ ≤ 2 μm and the star progressively evolves towards fainter F160W magnitudes.
Other factors playing a role in the determination of the LF of carbon stars are the physical conditions of the stars when the C-star stage is reached and the SFH of the galaxy. The former determine the dust production efficiency at the beginning of the C-star phase, thus the F160W and [3.6] flux of the star at the transition from oxygen-rich to carbon-rich. The SFH sets the (initial) mass distribution of the carbon star population.
Inspection of Fig. 9 outlines a welcome similarity between the LFs from Boyer et al. (2019) and the results obtained from population synthesis; on the other hand, the total LF, obtained when the criteria discussed in Section 3 are ignored, exhibits a tail in the F160W > 18.5 mag and [3.6]> 17.5 mag domain. This tail is due to the contribution of extremely red objects, with very poor flux in the F110W and F160W bands.
To understand the shape of the C-stars LF and to characterize the current carbon stars population of M31, it is important to consider which stars reach the C-star stage, the formation epoch and the duration of the phase during which they are carbon-rich. Because the M31 stars potentially able to become carbon stars are characterized by solar metallicity, for which a minimum mass of ∼ 1.5 M⊙ is required to reach the C-star stage (Ventura et al. 2018), we deduce that the nowadays C-star population of M31 is made up of stars younger than ∼3 Gyr, and that all the stars formed during the initial intense star formation activity of M31, described at the beginning of Section 5, are now evolving as oxygen rich sources. Therefore, most of the carbon stars formed during the burst in the SFH occurred 1 − 2 Gyr ago, when stars of mass in the 1.7−2 M⊙ range formed. Based on these arguments, we expect that the peaks in the LF are found in correspondence of the F160W and [3.6] fluxes characterizing the C-star evolution of the progeny of 1.7−2 M⊙ stars.
The LFs reported in Fig. 9 exhibit a peak in the 17 mag < F160W < 18 mag and 15 mag < [3.6] < 15.5 mag intervals, which is in fact the range spanned by the F160W and [3.6] fluxes of the 1.7−2 M⊙ stars during the first and the second inter-pulse phases after becoming carbon stars. The faint wing of the LF in the F160W band and for [3.6]> 15.5 mag is affected by the cut choice to remove RGB stars and incompleteness, as suggested by G22. However, we believe that this is also due to the evolutionary properties of stars of various mass during the C-rich phase; this can be clearly explained focusing on the [3.6] band, more sensitive to the dust emission than the F160W band. As discussed above, 1.7−2 M⊙ stars attain [3.6] fluxes corresponding to 15.5 mag < [3.6] < 16.5 mag for two inter-pulses only, before dust formation is so intense that the entire SED shifts towards the mid-IR and the [3.6] flux drops to ![$ \rm[3.6] \sim 17 $](/articles/aa/full_html/2025/07/aa51724-24/aa51724-24-eq1.gif) mag. Therefore, these stars account for only ∼30% of the C-star population of M31 in the 15.5 mag < [3.6] < 16.5 mag range, whereas the dominant contribution of ∼70% is provided by the progeny of ∼ 2.5 M⊙ stars.
mag. Therefore, these stars account for only ∼30% of the C-star population of M31 in the 15.5 mag < [3.6] < 16.5 mag range, whereas the dominant contribution of ∼70% is provided by the progeny of ∼ 2.5 M⊙ stars.
This behaviour is connected to the afore-discussed role played by the physical conditions of the star at the achievement of the C-rich phase on the carbon stars LF. The stars descending from 2.5 M⊙ progenitors produce little dust during the phases immediately following the achievement of the C-star stage, because they become C-stars after having lost only a very small fraction of the envelope mass, which reflects into relatively large surface gravities and effective temperatures of the order of 3700 K, thus physical conditions partly inhibiting the formation of dust. This is different from the M ≤ 2 M⊙ counterparts, which become carbon stars after a significant fraction of the envelope is lost, thus they evolve at cooler effective temperatures, of the order of ∼3000 K, and produce dust more efficiently, since the early C-star phases. The SED of these objects is shifted to the near-IR as soon as they become carbon stars, which explains why they are characterized by higher [3.6] fluxes during this evolutionary phase.
The significant decrease in the LF detected at [3.6]∼17 mag is related to the fact that the minimum [3.6] magnitude of 2.5 M⊙ stars during the inter-pulse phases is [3.6]∼17 mag, thus the [3.6]> 17 mag bins are populated only by carbon stars evolving through the low-luminosity phases following each TP, which are very short in comparison to the duration of the inter-pulse periods. This explanation does not hold for the stars responsible for the tail in the 17.5 mag < [3.6] < 20 mag range exhibited by the LF (magenta line in Fig. 9). These stars are evolving through the very final AGB evolutionary phases, during which the DPR is extremely large, thus the SED peaks in the mid-IR spectral region.
Turning to the bright side of the LF peak, the drop in the LF in the 16 mag < F160W < 17 mag and 14 mag < [3.6] < 15 mag domains is because these F160W and [3.6] fluxes are reached only by M > 2 M⊙ stars during the very final AGB phases. On the contrary, the progeny of 1.7−2 M⊙ stars, which we have seen to provide the largest contribution to the overall carbon stars population of M31, do not reach these magnitude values. In the LF shown in Fig. 6 it is evident the severe drop at F160W < 16 mag and [3.6]< 14 mag, which is the limit for the ignition of HBB (see the evolutionary tracks in Fig. 8), which prevents the C-star formation.
Overall, the fraction of carbon stars found by means of the population synthesis approach adopted here is ∼12%. This fraction includes the stars populating the [3.6]> 17.5 mag tail of the LF shown in Fig. 9, which however are only a small percentage (∼0.7%) of the total carbon stars population of M31. The carbon stars fraction found in our analysis is higher than the quantities given by Boyer et al. (2019) for the various sub-fields considered in their analysis. However, this is due to the different colour cuts adopted in the studies by G22 (the same adopted in the present investigation, described in Section 3) and by Boyer et al. (2019). The cuts imposed by G22 exclude a significant fraction of stars populating the blue side of the observational planes, most of which are oxygen-rich (see the evolutionary tracks on the blue side of the (F110W−F160W, F160W) plane reported in Fig. 1). This situation is partly alleviated in the Boyer et al. (2019) case, where the only colour condition adopted is (F127W−F153W) > 0.1 mag, thus a higher number of oxygen rich stars would be recovered. To compare the C/M results from the two studies we repeated the calculation by adopting the colour cut and the TRGB cut used by Boyer et al. (2019) instead of the G22 conditions listed in Section 3. We found that the overall C/M decreases to 0.07, which is much more consistent with the percentages found by Boyer et al. (2019).
6. Discussion
The analysis of the previous section outlined how optical, near and mid-IR observations are crucial for a thorough characterization of the evolved stellar population of galaxies. This is particularly true for structures characterized by a complex SFH and metallicity distribution, such as M31.
The interpretation of the near-IR data reported on the (F110W−F160W, F160W) plane allowed us to draw important information, particularly on the structure and evolution of low-mass stars: these objects, for reasons connected to the SFH experienced by M31 and to the shape of the IMF, which peaks at the lowest masses, are the majority of the stellar population detected in the near-IR plane.
The findings regarding the mass loss suffered by low-mass stars during the ascending of the RGB are rather intriguing. The observed F160W LF can only be reproduced if we assume that the average mass loss during the RGB phase of low-mass stars is 0.2 M⊙, 0.25 M⊙, 0.3 M⊙ for the metallicities Z = 10−3, Z = 4 × 10⁻³ and Z = Z⊙, respectively. This is in agreement with several investigations aimed at reproducing the detailed morphology of the HBs of Galactic globular clusters (Caloi & D’Antona 2005; Salaris et al. 2016; Di Criscienzo et al. 2015; Tailo et al. 2016; VandenBerg & Denissenkov 2018) and with the recent results obtained by Tailo et al. (2021), who calibrated the mass loss suffered by RGB stars belonging to clusters of different metallicity.
Recent studies based on Asterosismology (e.g. Miglio et al. 2021) suggested that the total mass loss experienced by low-mass RGB stars is of the order of 0.1 M⊙, thus smaller than those derived in the afore-mentioned investigations. Most of these results regard Galactic sources of higher metallicity and younger ages than the old sources considered here. Extension of these findings to the metal-poor population older than ∼10 Gyr would pose the issue of partial inconsistency between results from Asterosismology and those from the study of globular clusters. However, entering the debate regarding the RGB mass loss is beyond the scope of the present paper, thus we leave this problem open.
The comparison between the observed and the synthetic F160W LF’s also provides information on the efficiency of convection in the envelope of AGB stars, as the latter affects the effective temperatures and colours, thus the possibility that a given model star is consistent with the colour cuts imposed by G22 upon selecting the sample stars to be considered. We find that the results obtained in the metal-poor domain when the FST or the MLT model of convection based on the solar calibration are adopted lead to colours that are too blue to satisfy the cuts imposed by G22, thus to a number of sources significantly smaller than that in the G22 sample. To reconcile the results from synthetic modelling with the observations, we find that the mixing length parameter that is connected to the efficiency of convection is α = 1.4 in the sub-solar case, whereas in the metal-poor domain the choice α = 1 is required. On the other hand, in regard of the solar metallicity, the FST-based models evolve at colours consistent with the observations. This opens the way to the possibility of calibrating the efficiency of the convective channel to transport energy in AGB stars, something so far restricted to main sequence and RGB stars. An effect of the colour cut imposed on (F110W−F160W) described in Section 3 is that a significant fraction of stars descending from progenitors of mass above 2 M⊙ is excluded from the sample. Indeed, during the oxygen-rich phase the evolutionary tracks of these stars evolve vertically, with colours too blue with respect to the threshold for (F110W−F160W) chosen by G22 (see Fig. 1). Note that this has little effects on the overall numerical consistency of the sample, as the majority of the evolved stellar population of M31 descends from low-mass progenitors. Furthermore, this has no effects on the determination of the DPR of the galaxy, as the sources excluded are surrounded by very small amounts of dust.
While the analysis of the distribution of the sources in the (F110W−F160W, F160W) plane allows a detailed statistical investigation of the M31 population, we have seen that the information on the dust and on the stars surrounded by dust can be drawn by studying the ([3.6]−[4.5],[3.6]) diagram. This is particularly relevant to study massive AGBs experiencing HBB, which are known to be efficient silicates manufacturers, owing to the large mass loss rates experienced (Ventura et al. 2014, 2022). In Section 4.3 we discussed how the description of the evolution of this class of stars is severely affected by the treatment of mass loss. The results from synthetic modelling allow us discriminating among the various choices available to determine the mass loss rates. Indeed, when the Blöcker (1995) recipe is adopted, the results are not consistent with the observations, because, as discussed in Section 4.3, we should expect a number of stars in the HBB region at ([3.6]−[4.5]) ∼ 0.5 mag and [3.6]< 14 mag far in excess of the observed number. This can be deduced by inspection of the evolutionary tracks of the 5 M⊙ model star in the right panel of Fig. 5. The HST results also confirm this conclusion: as shown in the left panel of Fig. 5 and discussed in Section 4.3, the evolutionary tracks of the 4−7 M⊙ model stars calculated with the VW93 recipe overlap with the position of the sources located at F160W < 16 mag, which otherwise remain unexplained if the Blöcker (1995) treatment is used (see the black track on the figure). As shown in the right panel of Fig. 5, the same tracks are also fully consistent with the location of the same sources (indicated with cyan points) on the ([3.6]−[4.5],[3.6]) plane.
The results obtained with the VW93 treatment of mass loss are far more consistent with the observations, which is a clear indication of the opportunity to use the VW93 recipe when massive AGBs of solar metallicity are modelled. The stars populating the [3.6]< 14 mag region of the plane, descending from M ≥ 4 M⊙ progenitors, are the youngest sources in the G22 sample, with ages below ∼200 Myr. The surface chemistry of these sources is expected to be heavily contaminated by HBB, with significant nitrogen enhancement and isotopic carbon ratios 12C/13C ∼ 3−4.
We note that the results obtained here on the description of mass loss experienced by massive AGBs of solar metallicity are consistent with the study by Marini et al. (2023), who found that the SED of a few bright, long-period, oxygen-rich stars in the Galaxy with deep absorption silicate features can be reproduced only within the VW93 modelling of mass loss. As clearly shown in the right panel of Fig. 5, the M31 counterparts of the stars studied by Marini et al. (2023) would be located into the region of the ([3.6]−[4.5],[3.6]) plane centred at ([3.6]−[4.5]) ∼ 1.5 mag, [3.6]∼14 mag, where therefore we expect to find stars characterized by intense silicates production, with rates ∼ 10−6 M⊙/yr, pulsating with periods of 1500 − 2000 yr.
(F110W−F160W, F160W) is the ideal plane for a reliable number count of massive AGBs, because these stars can be easily identified in the F160W < 16 mag region, as evident in the left panel of Fig. 5, where they are indicated with cyan points. Conversely, in the ([3.6]−[4.5],[3.6]) diagram (see right panel of Fig. 5) they are partially mixed with other sources, which complicates the statistical analysis. A rough estimate of the number of stars expected in the region of the (F110W−F160W, F160W) plane populated by the cyan points in Fig. 5 can be found by considering that the time spent by 4, 5, 6 M⊙ model stars calculated with the VW93 treatment of mass loss in the F160W < 16 mag region is 3 × 10⁵, 105 and 3 × 10⁴ yr, respectively, and that star formation between 50 and 200 Myr ago took place in M31 with rates ∼ 0.25 M⊙/yr (Williams et al. 2017). Based on the standard Kroupa IMF, we estimate that the number of stars in the F160W < 16 mag region should be around 1000, which is a factor ∼2 higher than observed. This difference might suggest that the recent star formation rate derived for M31 is overrated or that the evolutionary timescales given above, primarily determined by the VW93 description of mass loss, must be revised downwards. We leave this problem open.
Overall, based on the modelling of massive AGBs that enables us to better reproduce the observations, we estimate that the DPR by M stars in M31 is ṀSil ∼ 6 × 10⁻⁵ M⊙/yr. ∼80% of the overall silicates production is provided by massive AGBs currently experiencing HBB, while the remaining ∼20% is produced by M > 1 M⊙ stars of solar metallicity, during the evolutionary phases preceeding the C-star phase.
We finally consider the carbon-rich sample, which, as discussed in the previous section, populates the red region of the ([3.6]−[4.5],[3.6]) plane. On this regard, a clearly discrepancy between the results based on synthetic modelling and the observations is that in the latter the C-rich branch is truncated at ([3.6]−[4.5]) ∼ 2 mag, whereas we see in Fig. 8 that the evolutionary tracks of 1.25−3.5 M⊙ stars extend to ([3.6]−[4.5]) ∼ 3.5 mag. The latter extreme stars would account for the presence of the tail in LF of carbon stars in the [3.6]> 17.5 mag domain, clearly visible in Fig. 9 (magenta line). The lack of extremely red objects in M31 was also noticed by G22, who stressed that the fraction of extreme AGBs in this galaxy, slightly above 1.3%, is smaller than the values of 4.5% and 6% found in the LMC and SMC, respectively.
The scarcity of extremely red C-stars in M31, if confirmed, would indicate that the efficiency of the dust formation process by C-rich AGBs is sensitive to the metallicity, thus confirming the results from van Loon (2000) and van Loon et al. (2005). This would imply that the carbon dust yields predicted by AGB + dust formation modelling are overestimated. Unfortunately no firm conclusion can be presently reached on this argument, because the missing C-rich population in the ([3.6]−[4.5]) > 2 mag region of the plane would be characterized by near-IR fluxes 16 mag < [3.6] < 19 mag (see the evolutionary tracks of C-stars in Fig. 8), where the detection probabilities are severely affected by incompleteness: indeed, as discussed in G22, completeness starts to affect the distribution of M31 stars at magnitudes [3.6] ∼ 15.2 mag.
We are more favourable to believe that the lack in M31 of the most obscured C-rich stars that characterized the LMC, identified by Dell’Agli et al. (2015a) as the progeny of 2−3 M⊙ stars, is a simple effect of incompleteness; this would confirm the results by Sloan et al. (2012) and Sloan et al. (2016), that the formation of carbon dust is independent of metallicity.
If this is correct, we may estimate the overall carbon DPR of M31 by using the results from synthetic modelling, by summing up all the DPR of the individual stars, for which we find a tight correlation with the colour, according to the relation:
![$$ \begin{aligned} \log (\dot{M}_{car}) = {2\over 3}\times ([3.6]{-}[4.5]) -8.3. \end{aligned} $$](/articles/aa/full_html/2025/07/aa51724-24/aa51724-24-eq2.gif)
We obtain Ṁcar ∼ 3.8 × 10⁻⁴ M⊙/yr. We note that if we exclude the contribution from the stars populating the ([3.6]−[4.5]) > 2 mag zone of the ([3.6]−[4.5], [3.6]) plane, the overall DPR by C-stars would by underestimated by a factor ∼2.
Future mid-IR JWST observations with the MIRI camera will be able to confirm or disregard the presence of extremely red stars in M31, thus opening the way to an accurate estimation of the overall DPR in the galaxy and, more generally, to assess the role played by metallicity on the dust production mechanism by carbon stars.
The present results indicate that most of the dust currently released by M31 AGB stars is under the form of carbon dust, with the silicates contribution being below ∼20%. Even considering that the lack of the reddest C-stars would underestimate the current carbon DPR by ∼50%, we would still find that the silicates contribution barely reaches ∼30%. This is at odds with the suggestion given by G22 that silicates provide the dominant contribution to the global DPR by AGB stars in M31. This difference is related to the fact that the estimate of the DPR by G22 is based on the relationship between ([3.6]−[5.8]) and DPR proposed by Groenewegen & Sloan (2018), in which the authors assume a constant gas-to-dust ratio Ψ = 200. Indeed, according to the dust production modelling described in Section 2.2, we find that this choice is fairly consistent with the results obtained for the C-star phases. For what attains oxygen-rich stars, we find that during the evolution of the stars descending from M ≤ 1 M⊙ progenitors, which constitute the bulk of M-type stars of the galaxy, Ψ barely reaches 1000. Only the stars undergoing HBB attain values of Ψ of the order of 400, during the evolutionary phases when the HBB conditions are strongest (Ventura et al. 2014). These values of the gas-to-dust ratios are in agreement with the results obtained by Goldman et al. (2017) when studying a sample of bright, oxygen-rich stars in the LMC.
In summary, we find that the contribution of the carbonaceous species to the overall DPR of the galaxy is higher than that of silicates, despite the solar chemical composition of the majority of the evolved stars in M31. In the stellar populations characterized by solar chemistries, the lower mass threshold required to reach the C-star stage, of the order of 1.2−1.3 M⊙, is higher than in metal-poor environments, where the lower limit is below the solar mass (Ventura et al. 2022). This favours a higher relative fraction of M-type stars, as discussed, e.g., by Boyer et al. (2019). However, this does not reflect into a significant increase in the rate of silicates production, since the mass loss rates experienced by M-type low-mass stars are tipically below 10−6 M⊙/yr, which is not sufficient to trigger large production rates of silicates (Ventura et al. 2014). On the other hand, turning to younger objects, we find a much higher contribution from the dust released by massive AGBs experiencing HBB, in comparison with more metal-poor environments (Ventura et al. 2018): however, the fraction of these stars over the entire AGB population of M31 is below 1%, far too small to counterbalance the dust produced by 1.2−3.5 M⊙ stars, during the C-rich phase.
Further observational confirmations are required before these results can be definitively validated. For instance, these predictions could be tested by means of the criterion proposed by Boyer et al. (2017) to distinguish M-type sources from C-stars, based on the position of the individual sources on the (F127M-F139M, F139M-F153M) plane, where the two classes of objects populate distinct regions. Therefore, the future availability of these data for the sources investigated here will allow a further validation of the present interpretation.
7. Conclusions
We used a population synthesis approach based on stellar evolution and dust formation modelling to interpret HST and Spitzer data of the stars in the galaxy M31. We did this in order to characterize the AGB population and to account for the very low fraction of red objects detected in this galaxy, which is much smaller than in other environments, such as the Magellanic Clouds. The detailed comparison between the distribution of the dataset in the observational colour-magnitude planes built with the near-IR HST and Spitzer magnitudes and the expectations from synthetic modelling enabled the identification of the stars that populate the different regions of the planes and the derivation of a general view of the AGB population of M31.
The analysis of HST data shows that ∼70% of the AGB population descend from 0.8−1.2 M⊙ progenitors of various metallicity that were formed between 6 Gyr and 14 Gyr ago during the initial phase of intense star formation activity experienced by M31. A significant fraction (∼15%) of the sources classified as AGBs descends from 1.7−2.5 M⊙ stars of solar metallicity that formed during the secondary peak in the SFH of M31, which occurred between 1 Gyr and 2 Gyr ago. A small fraction (below 1%) of the AGB sample is identified as the progeny of M≥ 4 M⊙ stars that formed during the last 200 Myr and are currently experiencing HBB. The statistical study of HST data offers a notable opportunity to improve our understanding of some still poorly known aspects related to AGB evolution, which regard in particular the efficiency of the convective transport of energy in the envelope of AGB stars of different metallicities, the mass loss suffered by low-mass stars while they ascend the RGB and the mass loss rates experienced by massive AGB stars during the HBB phase.
The study of the distribution of the stars in the ([3.6]−[4.5],[3.6]) plane proves crucial to address the dust formation issue, if we consider the extremely low near-IR emission of dusty stars. On the basis of the morphology of the evolutionary tracks of stars of different mass during AGB evolution, it is possible to select the regions within this observational plane that are populated by stars of different mass with little or no dust in their surroundings. It is also possible to select those regions harbouring the stars that provide the most relevant contribution to the current dust budget; namely the progeny of M≥ 4 M⊙ stars, which are currently experiencing HBB and produce large quantities of silicates, and carbon stars, which descend from 1.2−3.5 M⊙ progenitors and are surrounded by carbonaceous dust. The larger fraction (∼80%) of the overall DPR in M31 is provided by carbon stars, which form dust at a rate of 4 × 10⁻⁴ M⊙/yr. The formation of silicates takes place at a rate of 6 × 10⁻⁵ M⊙/yr.
The latter estimates are based on the assumption that the lack of carbon stars populating the ([3.6]−[4.5]) > 2 mag region of the colour-magnitude plane of M31, and more generally the well-known smaller fraction of extreme AGBs in the galaxy with respect to the Magellanic Clouds, is an effect of incompleteness of the M31 dataset in the [3.6] band. Should the lack of extremely red carbon stars be real and not related to the completeness issue, the DPR by carbon stars would be approximately half the value indicated above. JWST mid-IR observations are urgently required to clarify this still open issue.
The results reported in Fig. 8 of Williams et al. (2017) indicate a large uncertainty in the estimated chemical composition of the oldest stars of M31: the metallicity spanning the -2 < [Fe/H] < -0.5 range. We assumed an average value of [Fe/H] ∼ −1 (corresponding to Z = 0.001) to model this old population of the galaxy. We note that this corresponds to the low metallicity tail of the [Fe/H] distribution of M31 RGB stars derived by Gregersen et al. (2015).
References
- Abel, N. P., van Hoof, P. A. M., Shaw, G., et al. 2008, ApJ, 686, 1125 [NASA ADS] [CrossRef] [Google Scholar]
- Aller, L. H., & Czyzak, S. J. 1983, ApJS, 51, 211 [NASA ADS] [CrossRef] [Google Scholar]
- Aringer, B., Girardi, L., Nowotny, W., et al. 2009, A&A, 503, 913 [NASA ADS] [CrossRef] [EDP Sciences] [Google Scholar]
- Aringer, B., Girardi, L., Nowotny, W., Marigo, P., & Bressan, A. 2016, MNRAS, 457, 3611 [Google Scholar]
- Begemann, B., Dorschner, J., Henning, T., et al. 1994, ApJ, 423, L71 [NASA ADS] [CrossRef] [Google Scholar]
- Blöcker, T. 1995, A&A, 297, 727 [NASA ADS] [Google Scholar]
- Blöcker, T., & Schönberner, D. 1991, A&A, 244, L43 [Google Scholar]
- Bowen, G. H. 1988, ApJ, 329, 299 [NASA ADS] [CrossRef] [Google Scholar]
- Boyer, M. L., Srinivasan, S., van Loon, J. T., et al. 2011, AJ, 142, 103 [Google Scholar]
- Boyer, M. L., Srinivasan, S., Riebel, D., et al. 2012, ApJ, 748, 40 [Google Scholar]
- Boyer, M. L., Girardi, L., Marigo, P., et al. 2013, ApJ, 774, 83 [NASA ADS] [CrossRef] [Google Scholar]
- Boyer, M. L., McQuinn, K. B. W., Groenewegen, M. A. T., et al. 2017, ApJ, 851, 152 [NASA ADS] [CrossRef] [Google Scholar]
- Boyer, M. L., Williams, B. F., Aringer, B., et al. 2019, ApJ, 879, 109 [NASA ADS] [CrossRef] [Google Scholar]
- Caloi, V., & D’Antona, F. 2005, A&A, 435, 987 [NASA ADS] [CrossRef] [EDP Sciences] [Google Scholar]
- Canuto, V. M. C., & Mazzitelli, I. 1991, ApJ, 370, 295 [NASA ADS] [CrossRef] [Google Scholar]
- Catelan, M. 2000, ApJ, 531, 826 [Google Scholar]
- Dalcanton, J. J., Williams, B. F., Lang, D., et al. 2012, ApJS, 200, 18 [Google Scholar]
- Dell’Agli, F., García-Hernández, D. A., Rossi, C., et al. 2014, MNRAS, 441, 1115 [Google Scholar]
- Dell’Agli, F., Ventura, P., Schneider, R., et al. 2015a, MNRAS, 447, 2992 [Google Scholar]
- Dell’Agli, F., García-Hernández, D. A., Ventura, P., et al. 2015b, MNRAS, 454, 4235 [Google Scholar]
- Dell’Agli, F., Di Criscienzo, M., Boyer, M. L., et al. 2016, MNRAS, 460, 4230 [Google Scholar]
- Dell’Agli, F., Di Criscienzo, M., Ventura, P., et al. 2018, MNRAS, 479, 5035 [Google Scholar]
- Dell’Agli, F., Di Criscienzo, M., García-Hernández, D. A., et al. 2019, MNRAS, 482, 4733 [Google Scholar]
- Di Criscienzo, M., Tailo, M., Milone, A. P., et al. 2015, MNRAS, 446, 1469 [NASA ADS] [CrossRef] [Google Scholar]
- Ferrarotti, A. S., & Gail, H.-P. 2001, A&A, 371, 133 [NASA ADS] [CrossRef] [EDP Sciences] [Google Scholar]
- Ferrarotti, A. S., & Gail, H.-P. 2002, A&A, 382, 256 [NASA ADS] [CrossRef] [EDP Sciences] [Google Scholar]
- Ferrarotti, A. S., & Gail, H.-P. 2006, A&A, 447, 553 [CrossRef] [EDP Sciences] [Google Scholar]
- Gail, H.-P., & Sedlmayr, E. 1985, A&A, 148, 183 [Google Scholar]
- Goldman, S. R., van Loon, J. T., Zijlstra, A. A., et al. 2017, MNRAS, 465, 403 [Google Scholar]
- Goldman, S. R., Boyer, M. L., Dalcanton, J., et al. 2022, ApJS, 259, 41 [NASA ADS] [CrossRef] [Google Scholar]
- Gregersen, D., Seth, A. C., Williams, B. F., et al. 2015, AJ, 150, 189 [Google Scholar]
- Groenewegen, M. A. T., & Sloan, G. C. 2018, A&A, 609, A114 [NASA ADS] [CrossRef] [EDP Sciences] [Google Scholar]
- Habing, H. J. 1996, A&ARv, 7, 97 [NASA ADS] [CrossRef] [Google Scholar]
- Harris, J., & Zaritsky, D. 2009, AJ, 138, 1243 [NASA ADS] [CrossRef] [Google Scholar]
- Hauschildt, P. H., Allard, F., Ferguson, J., et al. 1999, ApJ, 525, 871 [NASA ADS] [CrossRef] [Google Scholar]
- Höfner, S., & Olofsson, H. 2018, A&ARv, 26, 1 [Google Scholar]
- Iben, I., Jr. 1974, ARA&A, 12, 215 [NASA ADS] [CrossRef] [Google Scholar]
- Kamath, D., Dell’Agli, F., Ventura, P., et al. 2023, MNRAS, 519, 2169 [Google Scholar]
- Karakas, A. I., & Lattanzio, J. C. 2014, PASA, 31, e030 [NASA ADS] [CrossRef] [Google Scholar]
- Kobayashi, C., Karakas, A. I., & Lugaro, M. 2020, ApJ, 900, 179 [Google Scholar]
- Kroupa, P. 2001, MNRAS, 322, 231 [NASA ADS] [CrossRef] [Google Scholar]
- Laor, A., & Draine, B. T. 1993, ApJ, 402, 441 [NASA ADS] [CrossRef] [Google Scholar]
- Lewis, A. R., Dolphin, A. E., Dalcanton, J. J., et al. 2015, ApJ, 805, 183 [NASA ADS] [CrossRef] [Google Scholar]
- Marigo, P. 2002, A&A, 387, 507 [NASA ADS] [CrossRef] [EDP Sciences] [Google Scholar]
- Marigo, P., & Aringer, B. 2009, A&A, 508, 1539 [CrossRef] [EDP Sciences] [Google Scholar]
- Marini, E., Dell’Agli, F., Di Criscienzo, M., et al. 2020, MNRAS, 493, 2996 [NASA ADS] [CrossRef] [Google Scholar]
- Marini, E., Dell’Agli, F., Groenewegen, M. A. T., et al. 2021, A&A, 647, A69 [NASA ADS] [CrossRef] [EDP Sciences] [Google Scholar]
- Marini, E., Dell’Agli, F., Kamath, D., et al. 2023, A&A, 670, A97 [NASA ADS] [CrossRef] [EDP Sciences] [Google Scholar]
- Matsuura, M. 2011, Why Galaxies Care about AGB Stars II: Shining Examples and Common Inhabitants, 445, 531 [NASA ADS] [Google Scholar]
- Matsuura, M., Barlow, M. J., Zijlstra, A. A., et al. 2009, MNRAS, 396, 918 [NASA ADS] [CrossRef] [Google Scholar]
- Matsuura, M., Woods, P. M., & Owen, P. J. 2013, MNRAS, 429, 2527 [NASA ADS] [CrossRef] [Google Scholar]
- Miglio, A., Chiappini, C., Mackereth, J. T., et al. 2021, A&A, 645, A85 [NASA ADS] [CrossRef] [EDP Sciences] [Google Scholar]
- Nanni, A., Bressan, A., Marigo, P., et al. 2013, MNRAS, 434, 2390 [NASA ADS] [CrossRef] [Google Scholar]
- Nanni, A., Bressan, A., Marigo, P., et al. 2014, MNRAS, 438, 2328 [NASA ADS] [CrossRef] [Google Scholar]
- Nanni, A., Marigo, P., Groenewegen, M. A. T., et al. 2016, MNRAS, 462, 1215 [NASA ADS] [CrossRef] [Google Scholar]
- Nanni, A., Groenewegen, M. A. T., Aringer, B., et al. 2019, MNRAS, 487, 502 [NASA ADS] [CrossRef] [Google Scholar]
- Nenkova, M., Ivezic, Z., & Elitzur, M. 1999, Thermal Emission Spectroscopy and Analysis of Dust, Disks, and Regoliths, 20 [Google Scholar]
- Ordal, M. A., Bell, R. J., Alexander, R. W., et al. 1988, Appl. Opt., 27, 1203 [NASA ADS] [CrossRef] [Google Scholar]
- Ossenkopf, V., Henning, T., & Mathis, J. S. 1992, A&A, 261, 567 [NASA ADS] [Google Scholar]
- Pegourie, B. 1988, A&A, 194, 335 [NASA ADS] [Google Scholar]
- Reimers, D. 1975, MSRSL, 8, 369 [NASA ADS] [Google Scholar]
- Riebel, D., Srinivasan, S., Sargent, B., et al. 2012, ApJ, 753, 71 [NASA ADS] [CrossRef] [Google Scholar]
- Rouleau, F., & Martin, P. G. 1991, ApJ, 377, 526 [NASA ADS] [CrossRef] [Google Scholar]
- Salaris, M. 2012, Red Giants as Probes of the Structure and Evolution of the Milky Way, 26, 45 [Google Scholar]
- Salaris, M., Cassisi, S., & Pietrinferni, A. 2016, A&A, 590, A64 [CrossRef] [EDP Sciences] [Google Scholar]
- Salaris, M., Cassisi, S., Schiavon, R. P., et al. 2018, A&A, 612, A68 [NASA ADS] [CrossRef] [EDP Sciences] [Google Scholar]
- Schlegel, D. J., Finkbeiner, D. P., & Davis, M. 1998, ApJ, 500, 525 [Google Scholar]
- Schneider, R., & Maiolino, R. 2023, ArXiv e-prints [arXiv:2310.00053] [Google Scholar]
- Schneider, R., Valiante, R., Ventura, P., et al. 2014, MNRAS, 442, 1440 [NASA ADS] [CrossRef] [Google Scholar]
- Schröder, K.-P., & Cuntz, M. 2005, ApJ, 630, L73 [Google Scholar]
- Schwarzschild, M., & Härm, R. 1965, ApJ, 142, 855 [NASA ADS] [CrossRef] [Google Scholar]
- Sloan, G. C., Matsuura, M., Lagadec, E., et al. 2012, ApJ, 752, 140 [NASA ADS] [CrossRef] [Google Scholar]
- Sloan, G. C., Lagadec, E., Zijlstra, A. A., et al. 2014, ApJ, 791, 28 [NASA ADS] [CrossRef] [Google Scholar]
- Sloan, G. C., Kraemer, K. E., McDonald, I., et al. 2016, ApJ, 826, 44 [NASA ADS] [CrossRef] [Google Scholar]
- Srinivasan, S., Boyer, M. L., Kemper, F., et al. 2016, MNRAS, 457, 2814 [NASA ADS] [CrossRef] [Google Scholar]
- Tailo, M., Di Criscienzo, M., D’Antona, F., et al. 2016, MNRAS, 457, 4525 [CrossRef] [Google Scholar]
- Tailo, M., Milone, A. P., Lagioia, E. P., et al. 2021, MNRAS, 503, 694 [NASA ADS] [CrossRef] [Google Scholar]
- VandenBerg, D. A., & Denissenkov, P. A. 2018, ApJ, 862, 72 [NASA ADS] [CrossRef] [Google Scholar]
- van Loon, J. T. 2000, A&A, 354, 125 [NASA ADS] [Google Scholar]
- van Loon, J. T., Marshall, J. R., & Zijlstra, A. A. 2005, A&A, 442, 597 [NASA ADS] [CrossRef] [EDP Sciences] [Google Scholar]
- Vassiliadis, E., & Wood, P. R. 1993, ApJ, 413, 641 [Google Scholar]
- Ventura, P., & D’Antona, F. 2005a, A&A, 431, 279 [NASA ADS] [CrossRef] [EDP Sciences] [Google Scholar]
- Ventura, P., & D’Antona, F. 2005b, A&A, 439, 1075 [NASA ADS] [CrossRef] [EDP Sciences] [Google Scholar]
- Ventura, P., & Marigo, P. 2009, MNRAS, 399, L54 [Google Scholar]
- Ventura, P., & Marigo, P. 2010, MNRAS, 408, 2476 [Google Scholar]
- Ventura, P., Zeppieri, A., Mazzitelli, I., & D’Antona, F. 1998, A&A, 334, 953 [Google Scholar]
- Ventura, P., D’Antona, F., Mazzitelli, I., et al. 2001, ApJ, 550, L65 [Google Scholar]
- Ventura, P., Di Criscienzo, M., Schneider, R., et al. 2012, MNRAS, 420, 1442 [Google Scholar]
- Ventura, P., Di Criscienzo, M., Carini, R., et al. 2013, MNRAS, 431, 3642 [NASA ADS] [CrossRef] [Google Scholar]
- Ventura, P., Dell’Agli, F., Schneider, R., et al. 2014, MNRAS, 439, 977 [NASA ADS] [CrossRef] [Google Scholar]
- Ventura, P., Karakas, A., Dell’Agli, F., et al. 2018, MNRAS, 475, 2282 [NASA ADS] [Google Scholar]
- Ventura, P., Dell’Agli, F., Tailo, M., et al. 2022, Universe, 8, 45 [NASA ADS] [CrossRef] [Google Scholar]
- Vincenzo, F., Belfiore, F., Maiolino, R., et al. 2016, MNRAS, 458, 3466 [NASA ADS] [CrossRef] [Google Scholar]
- Vitense, E. 1953, Z. Astrophys., 32, 135 [NASA ADS] [Google Scholar]
- Wachter, A., Schröder, K.-P., Winters, J. M., et al. 2002, A&A, 384, 452 [NASA ADS] [CrossRef] [EDP Sciences] [Google Scholar]
- Wachter, A., Winters, J. M., Schröder, K.-P., et al. 2008, A&A, 486, 497 [NASA ADS] [CrossRef] [EDP Sciences] [Google Scholar]
- Williams, B. F., Dolphin, A. E., Dalcanton, J. J., et al. 2017, ApJ, 846, 145 [Google Scholar]
- Zubko, V. G., Mennella, V., Colangeli, L., et al. 1996, MNRAS, 282, 1321 [NASA ADS] [CrossRef] [Google Scholar]
All Tables
All Figures
|
Fig. 1. Data points in the catalogue of M31 AGB stars by G22 are shown with grey points on the colour-magnitude (F110W−F160W, F160W) plane. Solid lines represent the AGB evolutionary tracks of model stars of different mass and metallicity, with connecting points that correspond to evolutionary stages taken in the middle of each inter-pulse phase. The different lines refer to the evolution of the M = 0.65 M⊙ star of metallicity Z = 10−3 (triangles), and to the solar metallicity model stars of mass M = 0.8 M⊙ (pentagons), M = 1.05 M⊙ (stars), M = 2.5 M⊙ (squares), M = 3.5 M⊙ (diamonds), and M = 5 M⊙ (circles). The different panels provide information on the luminosity of the model stars (top, left), effective temperature (top, middle), (gas) mass loss rate (top, right), surface C/O ratio (bottom, left), DPR (bottom, middle), and optical depth at 10 μm (bottom, right). |
| In the text | |
|
Fig. 2. Time variation of the effective temperatures of 0.65 M⊙ model stars of metallicity Z = 0.001 (top, left panel) and Z = 0.004 (top, right), calculated with different convective models. The corresponding evolutionary tracks of the Z = 0.001 model star on the (F814W−F160W, F160W) and (F110W−F160W, F160W) planes are shown in the bottom, left and bottom, right panels, respectively. The points along the tracks indicate the middle of the different inter-pulse phases. Data points in the catalogue of M31 AGB stars by G22 are shown with grey points and G22 cuts are marked with dashed, magenta lines. |
| In the text | |
|
Fig. 3. Time variation of the luminosity (left panel) and of the F160W flux (right) of Z = 0.001 model stars of initial mass (taken at the beginning of the core helium burning phase) 0.6 M⊙ (magenta line), 0.65 M⊙ (black), 0.75 M⊙ (green). |
| In the text | |
|
Fig. 4. AGB time variation of the luminosity (left panel), DPR (middle), [3.6] fluxes (right) of two model stars of initial mass 5 M⊙, where mass loss was described by means of the Blöcker (1995) (black squares) and the VW93 treatments (red triangles). |
| In the text | |
|
Fig. 5. Evolutionary tracks of the same 5 M⊙ model stars reported in Fig. 4, based on the Blöcker (1995) and VW93 treatments of mass loss, are shown on the (F110W−F160W, F160W) (left panel) and ([3.6]−[4.5],[3.6]) (right panel) planes, with, respectively, black squares and red triangles. Magenta diamonds, orange circles and green pentagons refer to the evolution, respectively, of 4 M⊙, 6 M⊙ and 7 M⊙ stars, where mass loss was described following VW93. Black crosses refer to the evolution of a 7 M⊙ star, obtained with the Blöcker (1995) description of mass loss. Data points in the catalogue of M31 AGB stars by G22 are shown with grey points. Bright sources with F160W < 16 mag are shown with cyan points. |
| In the text | |
|
Fig. 6. Left: The F160W LF of the stars included in the G22 sample, indicated with a black line, is compared with the results obtained from population synthesis, shown with a red, dashed line. The contribution from stars of different mass in the various F160W bins is also given. In the legend the initial masses of the progenitor stars are indicated. Right: the same F160W LF reported on the left panel, in a logarithmic scale. For readability we show the total LF only, omitting the contributions from the stars of different mass. The large discrepancy between the dashed and the solid lines in the F160W > 18.5 domain is due to the cut adopted by G22 in that F160W range, where only the (few) sources identified as extreme AGBs were included. |
| In the text | |
|
Fig. 7. AGB candidates from the G22 sample in M31 are shown with grey points in the colour-magnitude (F110W−F160W, F160W) diagram. The expected distribution of metal-poor, sub-solar, and solar metallicity stars from the synthetic modelling is indicated with different colour-coding in the top, left, middle and right panels, respectively. The central panels indicate an age classification, in which the different sources are divided among young stars formed earlier than 200 Myr ago (left panel), old objects formed in ancient epochs (right), and intermediate age stars, which eventually reach the C-star stage (middle). The bottom panels show the distribution of C- and O-rich stars. |
| In the text | |
|
Fig. 8. Data points of the M31 sources included in the catalogue by G22 in the [3.6]−[4.5],[3.6]) plane obtained with the Spitzer filters are shown with grey points. Solid lines represent the same evolutionary tracks of some selected model stars reported in Fig. 1. The information regarding the C/O ratio, the DPR and the optical depth at 10 μm is shown in the left, central, and right panels, respectively. |
| In the text | |
|
Fig. 9. The LF of carbon stars in F160W (top) and [3.6] (bottom), normalized to 17 and 14 mag, respectively. The LF of the carbon stars sample as selected by Boyer et al. (2019) is shown in black; the LF of the carbon stars synthetic population produced in this work is reported in magenta, while the synthetic LF obatined by considering the cuts proposed by G22 (see Section 3) is displayed in blue. |
| In the text | |
Current usage metrics show cumulative count of Article Views (full-text article views including HTML views, PDF and ePub downloads, according to the available data) and Abstracts Views on Vision4Press platform.
Data correspond to usage on the plateform after 2015. The current usage metrics is available 48-96 hours after online publication and is updated daily on week days.
Initial download of the metrics may take a while.