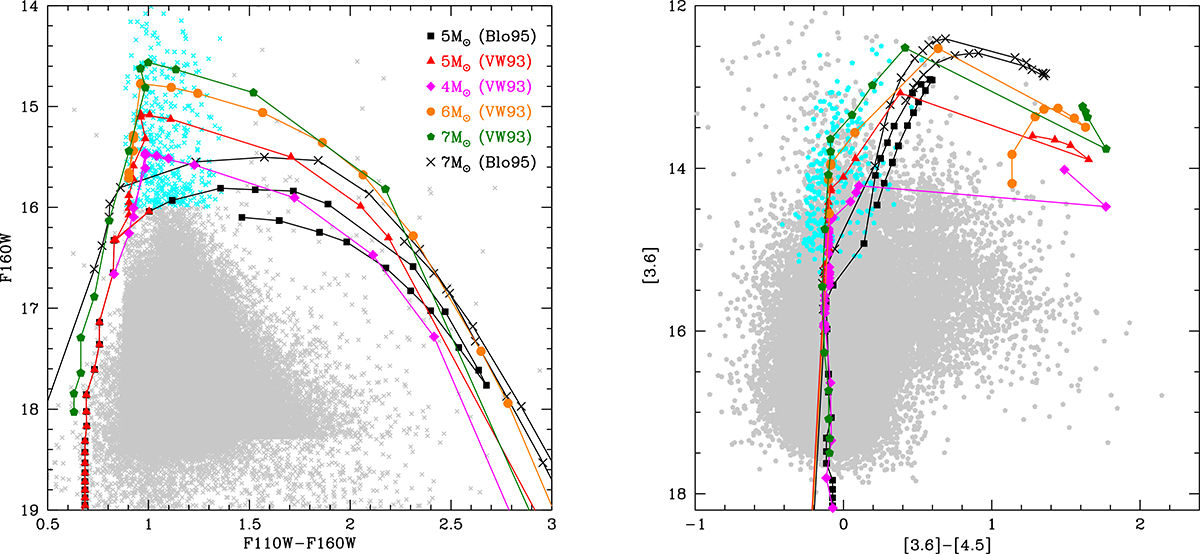
Fig. 5.
Download original image
Evolutionary tracks of the same 5 M⊙ model stars reported in Fig. 4, based on the Blöcker (1995) and VW93 treatments of mass loss, are shown on the (F110W−F160W, F160W) (left panel) and ([3.6]−[4.5],[3.6]) (right panel) planes, with, respectively, black squares and red triangles. Magenta diamonds, orange circles and green pentagons refer to the evolution, respectively, of 4 M⊙, 6 M⊙ and 7 M⊙ stars, where mass loss was described following VW93. Black crosses refer to the evolution of a 7 M⊙ star, obtained with the Blöcker (1995) description of mass loss. Data points in the catalogue of M31 AGB stars by G22 are shown with grey points. Bright sources with F160W < 16 mag are shown with cyan points.
Current usage metrics show cumulative count of Article Views (full-text article views including HTML views, PDF and ePub downloads, according to the available data) and Abstracts Views on Vision4Press platform.
Data correspond to usage on the plateform after 2015. The current usage metrics is available 48-96 hours after online publication and is updated daily on week days.
Initial download of the metrics may take a while.