| Issue |
A&A
Volume 694, February 2025
|
|
|---|---|---|
| Article Number | A177 | |
| Number of page(s) | 9 | |
| Section | Stellar structure and evolution | |
| DOI | https://doi.org/10.1051/0004-6361/202452188 | |
| Published online | 11 February 2025 | |
Planetary nebulae of the Large Magellanic Cloud
II. The connection with the progenitors’ properties
1
INAF, Observatory of Rome, Via Frascati 33, 00077 Monte Porzio Catone, (RM), Italy
2
Istituto Nazionale di Fisica Nucleare, section of Perugia, Via A. Pascoli snc, 06123 Perugia, Italy
3
Dipartimento di Matematica e Fisica, Università degli Studi Roma Tre, Via della Vasca Navale 84, 00100 Roma, Italy
4
LNF, Laboratori Nazionali Fascati, Via Enrico Fermi, 54, 00044 Frascati Roma, Italy
5
Instituto de Astrofísica de Canarias (IAC), E-38205 La Laguna, Tenerife, Spain
6
Departamento de Astrofísica, Universidad de La Laguna (ULL), E-38206 La Laguna, Tenerife, Spain
7
School of Mathematical and Physical Sciences, Macquarie University, Balaclava Road, Sydney, NSW 2109, Australia
8
NSF’s NOIRLab, 950 Cherry Ave., Tucson, AZ 85719, USA
9
Osservatorio Astronomico di Padova, Vicolo dell’Osservatorio 5, 35122 Padova, Italy
10
Departament de Física Quàntica i Astrofísica (FQA), Universitat de Barcelona (UB), c. Martí i Franqués, 1, 08028 Barcelona, Spain
11
Institut de Ciències del Cosmos (ICCUB), Universitat de Barcelona (UB), c. Martí i Franqués, 1, 08028 Barcelona, Spain
⋆ Corresponding author; paolo.ventura@inaf.it
Received:
10
September
2024
Accepted:
4
January
2025
Context. The study of planetary nebulae (PNe) offers the opportunity to evaluate the efficiency of the dust production mechanism during the very late asymptotic giant branch (AGB) phases, which allows us to assess the role played by AGB stars as dust manufacturers.
Aims. We studied the relationship between the properties of PNe, particularly the gas and dust content, and the mass and metallicity of the progenitor stars to understand how dust production works in the late AGB phases and to shed new light on the physical processes the stars and the material in their surroundings are subject to in the period between the departure from the AGB and the start of the PN phase.
Methods. We considered a sample of nine PNe in the Large Magellanic Cloud, seven of which are characterised by the presence of carbonaceous dust and the remaining two the presence of silicates. For these stars, we estimated the masses and the metallicity of their progenitor stars. We combined results from stellar evolution and dust formation modelling with results from analyses of the spectral energy distribution to determine the relation between the dust and gas mass of the PNe considered and the mass and metallicity of the progenitors.
Results. The physical properties of carbon-rich PNe are influenced by the mass of the progenitor star. Specifically, the dust-to-gas ratio in the nebula increases from 5 × 10⁻⁴ to 6 × 10⁻³ as the progenitor star’s mass increases from approximately 0.9–2 M⊙. This change is partly influenced by the effective temperature of the PNe, and it occurs because higher-mass carbon stars are more efficient at producing dust. Consequently, as the progenitor’s mass increases, the gas mass of the PN decreases since the larger amounts of dust lead to greater effects from radiation pressure, which pushes the gas outwards. No meaningful conclusions can be drawn from the study of the PNe with silicate-type dust, because the subsample comprises two PNe only, one of which is almost dust-free.
Key words: stars: abundances / stars: AGB and post-AGB / stars: carbon / stars: evolution / stars: mass-loss
© The Authors 2025
 Open Access article, published by EDP Sciences, under the terms of the Creative Commons Attribution License (https://creativecommons.org/licenses/by/4.0), which permits unrestricted use, distribution, and reproduction in any medium, provided the original work is properly cited.
This article is published in open access under the Subscribe to Open model. Subscribe to A&A to support open access publication.
1. Introduction
Over the past few decades, significant advancements have been made in understanding the evolution of stars passing through the asymptotic giant branch (AGB) phase. In particular, these improvements pertain to our understanding of changes in key physical properties and alterations in the surface chemical composition, which are closely linked to the progenitor stars’ mass and metallicity (Karakas & Lattanzio 2014; Ventura et al. 2022).
Important further progress in this field has been made in the last decade, with some research teams self-consistently coupling the results from stellar evolution modelling with the chemo-dynamical description of the circumstellar envelope (Ventura et al. 2012, 2014; Nanni et al. 2013, 2014) to derive the dust production rate (DPR) of stars during the AGB phase. These studies allowed the characterisation of the evolved stellar populations of the Magellanic Clouds (Dell’Agli et al. 2015a; Dell’Agli et al. 2015b), a few Local Group galaxies (Dell’Agli et al. 2016; Dell’Agli et al. 2018a; Dell’Agli et al. 2019), and Andromeda.
The aim of these investigations extended beyond simply learning more about the still poorly known aspects of AGB evolution. The more ambitious goal was to assess the role that these objects play in the pollution of the interstellar medium: gas is expelled via stellar winds and dust forms in significant quantities in their expanded circumstellar envelope, where the physical conditions prove extremely favourable to the condensation of gaseous molecules into dust grains (Gail & Sedlmayr 1999). Further progress in this field is needed to understand the relative contribution from AGB stars to the dust currently observed in galaxies (Schneider et al. 2014) and, more generally, to determine the contribution from these stars to the dust budget of the Universe (Schneider & Maiolino 2024).
Modelling of dust production in the wind of evolved stars has shown that, in most cases, the bulk of dust is released during the late AGB phases. This is definitively the case for carbon stars (C-stars) since the DPR increases steadily during AGB evolution due to the accumulation of carbon in the surface regions; this buildup is due to the effects of periodic third dredge-up (TDU) events (Ventura et al. 2014). Low-mass stars that fail to reach the C-star stage also exhibit this behaviour, as only during the very late AGB phases are the temperatures in the external regions of the star and in the circumstellar envelope cool enough to allow dust formation (Ventura et al. 2022). Recent studies (Marini et al. 2023) suggest that this is also the case for M ≥ 4 M⊙ stars experiencing hot bottom burning (HBB; Sackmann & Boothroyd 1992).
The fact that most of the dust is released towards the end of the AGB evolution motivated the study of the phases following the AGB, in an attempt to use the observations of post-AGB stars and planetary nebulae (PNe) to reconstruct the chain of events occurring since the very late AGB phases, when dust formation stopped. These investigations attempted to determinate the efficiency of the dust production mechanism at the tip of the AGB; this is when most of the dust is released and is thus the most relevant period for the determination of the dust yields.
Initial progress in this field was made by Tosi et al. (2022), who studied a sample of post-AGB stars in the Magellanic Clouds and gained key insights into dust formation during the late AGB phase. This was followed by Tosi et al. (2023) and Dell’Agli et al. (2023a), who focused on Galactic post-AGB stars, further refining our understanding of their mass-loss histories and dust properties. These studies highlight the potential of tracing the physical conditions of the final AGB stages – particularly the intensity of dust production – by analysing the IR excess of post-AGB stars.
Dell’Agli et al. (2023b) advanced the study of dust production by tracing the evolutionary path from the late AGB phase through the post-AGB phase to the PN stage. They propose that this approach allows for a comprehensive assessment of the gas and dust mineralogy and quantity surrounding the central object. By analysing the IR excess of a single star with a progenitor mass slightly above solar across different evolutionary stages, Dell’Agli et al. (2023b) aimed to understand how dust disperses from the star after dust formation ceases and to estimate the DPR during these epochs. Their study provides insights into dust and gas release during the late AGB phases and the subsequent PN stage.
Motivated by the potential to reconstruct the processes of gas release and dust production occurring during the late AGB phases by studying the AGB–post-AGB–PN sequence, we decided to expand upon the results obtained by Dell’Agli et al. (2023b). Whereas Dell’Agli et al. (2023b) studied a single object, we explored a wider sample of PNe for which observations are available in a wide spectral region, extending from the UV to the IR. Tosi et al. (2024) (hereafter Paper I) was dedicated to the analysis of a sample of Large Magellanic Cloud (LMC) PNe: from detailed spectral energy distribution (SED) fitting analysis, we derived the main chemical and dusty properties of the PNe, and, via comparisons with the evolutionary tracks across the Hertzsprung-Russell (HR) diagram, we inferred the mass and chemical composition of the progenitor stars. In the present work we follow the same approach proposed by Dell’Agli et al. (2023b) to deduce information on the dust production taking place during the late AGB phases and the dynamical properties of the wind during the transition from the AGB to the PN phase. To this aim, we used results from stellar evolution and dust formation modelling of the AGB phase to interpret the information for the individual objects investigated in Paper I.
Overall, we intend to create a synergy between the studies of dust production in the wind of AGB stars, which are able to predict the dust formed as a function of mass and metallicity, and the analysis of PN observations. The direct comparison of evolutionary models and observed properties would constrain the SED changes from the AGB to the initial white dwarf stellar phases, allowing us to classify the observed targets following the García-Lario & Perea Calderón (2003) scheme using spectra from the ISO (Infrared Space Observatory) archive.
This paper is structured as follows: The ingredients used to model the stellar evolution and the dust formation process, and to analyse the SED of the PNe, are described in Sect. 2. The properties of the stars believed to be progenitors of the sources in our sample are discussed in Sect. 3. Section 4 is devoted to the analysis of the connection between the properties of stars and the nebulae of the PNe and their previous evolutionary history. Conclusions are given in Sect. 5.
2. Numerical modelling and physical assumptions
In this study we focused on the PN sources investigated in Paper I, with the aim of linking the properties of the gas and dust in the nebulae (see Table 1) with the evolutionary history of the progenitor stars, and the efficiency of the dust formation mechanism that characterised the late AGB phases. The interpretation of the results from Paper I proposed in the present work is based on the combination of findings from the modelling of the AGB evolution of the stars believed to be the progenitors of the sources considered, and of the dust formation process taking place during the AGB phases of the same stars, particularly those close to the beginning of the post-AGB evolution. In this section we give a brief summary of the numerical and physical ingredients adopted.
Main properties of the PNe investigated in Paper I and the progenitor stars.
2.1. Stellar evolution modelling
The starting point of the interpretation of the results obtained in Paper I is the computation of the evolutionary sequences of the model stars considered. We note that, unlike Paper I, here we are not only interested in the excursion of the evolutionary tracks across the HR diagram, but also in the AGB variation of the physical quantities that are essential ingredients to determine the efficiency of dust production, such as the mass loss rate and the surface chemistry.
To build the evolutionary sequences, we used the ATON code for stellar evolution, the updated version whose numerical structure is described in detail in Ventura et al. (1998). The code is able to follow the entire evolution of low and intermediate-mass stars, from the pre–main sequence, to the white dwarf cooling sequence. Here we only discuss the input physical ingredients of ATON most relevant for the present work, which are: (a) the mass-loss rate during the C-star phases are modelled according to the description proposed by the Berlin group (Wachter et al. 2002, 2008), whereas for the oxygen-rich phases we adopted the treatment by Bloecker (1995); (b) the surface molecular opacities for mixtures enriched in the CNO elements are calculated by means of the AESOPUS tool, described in Marigo & Aringer (2009); and (c) the overshoot from convective borders is described by means of a diffusive approach, where convective velocities are assumed to decay exponentially with an e-folding distance of 0.002 pressure scale heights (this is in agreement with the calibration of the luminosity function of the LMC C-stars given in Ventura et al. 2014).
The description of our model stars is based on extant evolutionary sequences previously published by our group: for stars with metallicities Z = 0.004 and Z = 0.008, we used the results from Marini et al. (2021), and the low-metallicity counterparts of Z = 0.002 are from Kamath et al. (2023).
2.2. Dust production by AGB stars
Dust formation in the wind is described following the approach proposed by the Heidelberg team (Ferrarotti & Gail 2001, 2002, 2006), which was used in previous works by our group (Ventura et al. 2012, 2014). For some selected evolutionary stages (around 20) taken during each of the inter-pulses experienced by the model stars calculated with the ATON code, according to the description given in Sect. 2.1, we model dust formation on the basis of the mass, effective temperature, luminosity, mass loss rate and surface chemistry of the star.
On the chemical side, the most relevant factor for dust formation is the surface C/O, with oxygen-rich stars producing silicates and alumina dust, whereas in carbon rich environments the formation of solid carbon and silicon carbide takes place. This is due to the very large stability of the CO molecule, which absorbs the least abundant element between carbon and oxygen in its entirety. Therefore, in the case of C-stars, the amount of solid carbon dust that can form is given by the carbon excess with respect to oxygen. The solution of the set of equations listed and discussed in Ventura et al. (2012), which govern the dynamic and thermodynamic stratification of the stellar winds and the growth of dust grains, allows us to evaluate the mineralogy of the dust formed and the DPRs of the various dust species considered.
2.3. Interpretation of planetary nebula observations
For completeness, we also briefly report here the road followed to interpret the observations given in Paper I, where we used observed spectra and photometric data to model the SED of the PNe through the spectral synthesis code CLOUDY (v22.02; Ferland et al. 2017). To this aim, we built synthetic SED models, based on a detailed description of the central stars, the surrounding gaseous nebula, and the dust emission. To model the central star we used atmospheric models from Rauch (2003) and Pauldrach et al. (2001), scaling the chemical abundances from Aller & Czyzak (1983) and Khromov (1989) to align with the observed values from Leisy & Dennefeld (2006) and Henry et al. (1989). The gaseous nebula was modelled under the assumption of spherical geometry, with a constant hydrogen density and an inner radius consistent with photometric measurements from Shaw et al. (2001), as described in Paper I. This comprehensive modelling approach enabled the derivation of key PN properties such as the nebular gas mass, Mgas, and the dust-to-gas mass ratios, δ. Further details on the SED modelling and results are reported in Paper I.
3. Evolution and dust production of low-mass AGB stars
The classification of the sources discussed in Paper I was mainly based on the comparison between their position on the HR diagram and the evolutionary tracks of stars of different mass and metallicity, obtained with the ATON code, described in Sect. 2. The derived surface chemical composition, in particular the carbon mass fraction, was also used for a better identification of the mass and chemical composition of the progenitor stars (Paper I). In this section we discuss the AGB evolution and dust production mechanism of the progenitors, to be able to relate the properties of the PNe, derived from the analysis of the SED, with the physical processes that occurred during the final part of the AGB phase.
Seven of the nine sources studied in Paper I descend from C-stars, with the exceptions of SMP LMC 80 and SMP LMC 81, which are oxygen-rich. The AGB evolution of the stars that reach the C-star stage was discussed in a number of interesting reviews (Busso et al. 1999; Karakas & Lattanzio 2014; Ventura et al. 2022). The upper limit of the initial mass of these stars is around 3 M⊙ (Ventura et al. 2013), as in higher-mass objects the ignition of HBB at the base of the convective envelope prevents the stars from becoming C-stars. The afore-mentioned limit is partly sensitive to the metallicity, as HBB is ignited more easily in lower-metallicity environments (Dell’Agli et al. 2018b). The mass range of CSs is also limited from below (Karakas & Lattanzio 2014), as reaching the C-star stage demands a minimum number of TDU events, which can be experienced only if the initial mass of the envelope is above a minimum threshold. This threshold limit is also sensitive to the chemical composition (Ventura et al. 2022) and decreases as the metallicity of the stars decreases: the evolution of low-metallicity stars favours the C-star outcome given their lower oxygen content1.
As discussed in Ventura et al. (2022), the evolution of C-stars of a given metallicity is primarily driven by the initial mass. The higher the initial mass, the higher the number of thermal pulses (TPs) and TDU events experienced, the larger the amount of carbon accumulated in the surface regions. The progeny of stars whose mass is near the HBB ignition threshold (i.e. ∼ 2.5−3 M⊙) reach surface carbon mass fractions of the order of 1%: under these conditions the surface regions expand, owing to the notable increase in the low-T molecular opacities (Marigo 2002), which cause a general cooling of the external layers and the expansion of the whole stellar structure. These conditions prove extremely favourable for the condensation of gaseous molecules into solid particles, a process that increases the rate of mass loss, thus shortening the evolutionary timescales. Dell’Agli et al. (2015a) proposed that the evolved stars in the LMC exhibiting the largest IR excesses, populating the reddest side of the colour-colour plane obtained with the Spitzer magnitudes, descend from progenitors in this mass range.
Generally speaking, the DPR of C-stars increases since the start of the C-star phase, owing to the rise in the surface carbon. Therefore, most of the dust is produced and released during the latest inter-pulse phases, which are therefore the most relevant to assess the gas and dust pollution from these stars. Marini et al. (2021) suggested that all the reddest stars in the LMC, including part of the objects classified as EROSs (Extremey Red Objects), are C-stars evolving through the latest AGB phases.
Among the sources studied in Paper I, SMP LMC 4 and SMP LMC 71 were identified as the progeny of Z = 8 × 10⁻³ stars of 1.5 M⊙ and 2 M⊙, respectively. In Fig. 1 we show the evolution of the most relevant properties of this class of stars, obtained by means of the combination of stellar evolution and dust formation modelling, according to the description in Sect. 2.
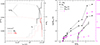 |
Fig. 1. The evolution of the physical and dust properties of 1.5 M⊙ and 2 M⊙ stars during the AGB phase. Left: Time variation of the surface carbon mass fraction (solid lines, scale on the left) and of the total mass (dashed lines, scale on the right) of model stars with metallicity Z = 8 × 10⁻³ and initial masses (taken at the start of the core helium burning) of 1.5 M⊙ (red lines) and 2 M⊙ (black). The first part of the AGB evolution, during which the stars are oxygen-rich, is indicated with thin lines and the evolutionary phases after the C-star stage is reached with thick lines. Right: Time variation of solid carbon (dashed lines) and SiC (solid lines) production rates experienced by the 1.5 M⊙ (triangles) and 2 M⊙ (squares) model stars reported in the left panel during the C-star phase. The individual points refer to the inter-pulse phases. Magenta lines and points indicate the variation in the dust-to-gas ratio (scale on the right). |
In the left panel of Fig. 1 we note the increase in the surface carbon following each TDU event; the final mass fractions are ∼4 × 10⁻³ and ∼6 × 10⁻³ for the 1.5 M⊙ and 2 M⊙ cases, respectively. The C-star evolution is limited to the last three inter-pulse phases of the 2 M⊙ model star, whereas the 1.5 M⊙ model star evolves as a C star only during the last inter-pulse. From the evolution of the total mass (dashed lines) we deduce the notable increase in the mass loss rate that accompanies the achievement of the C-star stage: indeed ∼90% of the envelope mass is lost during the final C-rich phase.
The right panel of Fig. 1 regards the dust production properties. For the two model stars considered we show the evolution of the DPR (split between the solid carbon and the SiC components), and the dust-to-gas ratio, estimated as the ratio between the dust formation rate and the mass loss rate. In the right panel we use the current mass of the star as the time indicator as use of time would shift the most relevant, final part of the evolution towards the right side of the figure.
In the phases immediately following the reaching of the C-star stage the formation of SiC is comparable or even more efficient than that of carbon dust, because the carbon excess with respect to oxygen, which is the key quantity to form carbon dust (Ferrarotti & Gail 2006), is smaller than the gaseous silicon required to form SiC grains. During the AGB evolution the relative contribution of SiC to the total dust budget diminishes over time due to the ongoing effects of TDU, which enrich the surface regions in carbon. For the models considered here, we find that the DPR during the last AGB phases is ∼10−8 and ∼ 5 × 10⁻⁷ M⊙/yr for the 1.5 M⊙ and 2 M⊙ model stars, respectively; the dust-to-gas ratios are ∼5 × 10⁻⁴ and ∼2 × 10⁻³.
The sources SMP LMC 66 and SMP LMC 102 were identified as the progeny of stars of metallicity Z = 4 × 10⁻³ and mass of 1 M⊙ and 1.25 M⊙, respectively, in Paper I. The evolution of these stars is reported in Fig. 2, whose panels show the same quantities as in Fig. 1. In both the model stars presented in Fig. 2 the C-star phase is restricted to the two last inter-pulse phases. The final surface carbon abundances are in the 3 − 4 × 10⁻³ range, a bit smaller than seen in the previous cases, in agreement with the trend of final carbon versus initial mass of the star discussed earlier in this section. The DPRs are also lower than in the higher-mass model stars discussed above, the final Ṁdust being ∼ 3 × 10⁻⁹ M⊙/yr and ∼ 5 × 10⁻⁹ M⊙/yr for the 1 M⊙ and 1.25 M⊙ model stars, respectively. As far as the dust-to-gas ratio is concerned, the final value is ∼4 × 10⁻³ for the 1 M⊙ model star and ∼5 × 10⁻³ in the 1.25 M⊙ case (see the right panel of Fig. 2 and Table 1).
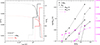 |
Fig. 2. Same as Fig. 1 but for the evolution of 1 M⊙ (red lines) and 1.25 M⊙ (black) model stars of metallicity Z = 4 × 10⁻³. The connection between the thickness of the lines and the surface C/O is the same as in Fig. 1. |
The sources SMP LMC 18, SMP LMC 25, and SMP LMC 34 investigated in Paper I were associated with the evolution of low-metallicity stars (Z ∼ 0.002) of mass ∼ 0.9 M⊙. In the metal-poor domain these masses are just above the minimum threshold required to reach the C-star stage (Kamath et al. 2023). A typical evolution of such a star is shown in Fig. 3, where we report the evolution of the same quantities as in Fig. 1. It is evident from the run of the stellar mass that most of the envelope loss takes place during the last two inter-pulses, during which in fact the star evolves as CS. The final surface carbon is ∼2 × 10⁻³, whereas the largest rate of dust production, obtained upon adding the solid carbon and SiC contributions, reached at the very end of the AGB evolution, is ∼ 2.5 × 10⁻⁹ M⊙/yr, significantly smaller than the values found for higher-mass counterparts, as reported in Figs. 1 and 2.
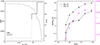 |
Fig. 3. Same as Figs. 1 and 2 but for the evolution of a 0.9 M⊙ model star of metallicity Z = 2 × 10⁻³. |
We conclude this review of the sources studied in Paper I with SMP LMC 80 and SMP LMC 81, which the authors interpreted as the progeny of low-mass stars that never reached the C-star stage. More specifically, as reported in Table 1, SMP LMC 81 descends from a Z = 4 × 10⁻³ progenitor of mass around 0.8 M⊙, whereas SMP LMC 80 is the progeny of a ∼ 0.6 M⊙ star of similar metallicity.
Figure 4 reports the main aspects of the evolution of these stars: the time evolution of the stellar mass and luminosity are shown for both sources. The changes in the DPR are shown for the higher-mass object only, as negligible dust production is expected in the case of the lower-mass star.
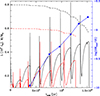 |
Fig. 4. Time variation of the luminosity (solid lines) and of the total mass (dashed) of model stars of metallicity Z = 4 × 10⁻³ and initial masses 0.6 M⊙ (red) and 0.8 M⊙ (black). The blue line indicates the DPR of the 0.8 M⊙ model star. |
As discussed in Ventura et al. (2022), the chemical composition of very low-mass stars like SMP LMC 80 and SMP LMC 81 is primarily affected by the first dredge-up process (and possible non canonical mixing) occurring during ascending of the red giant branch, as neither HBB nor TDU act during the AGB evolution of the stars in question. The envelope is lost after only a few TPs, before they contract and start the post-AGB and the PN phase. Dust is produced in limited quantities, the DPR increasing until reaching values of the order of a few times 10−9 M⊙/yr during the final AGB phases (see Fig. 4).
4. Discussion
In Paper I we adopted the methods described in Sect. 2 to determine the physical parameters characterising the nebula surrounding the CS, listed in Table 1, such as the mass of the gas in the nebula (Mgas) and the dust-to-gas ratio (δC2).
In the previous section we discussed the evolutionary and dust production properties of the stars during the AGB phase. We now attempt to relate the current properties of the PNe considered in Paper I with the efficiency of the dust formation process in the wind of the stars, as they evolve through the very final AGB phases.
4.1. Properties of the nebulae
Figure 5 shows the mass of the gas and the dust-to-gas ratio of the nebulae surrounding the C-stars in the sample investigated here. It is clear that the two quantities are anti-correlated: the stars with the largest δC ∼ 6 × 10⁻³ are surrounded by ∼ 0.05 M⊙ of gas, whereas for the sources with little dust (δC of the order of a few times 10−4), Mgas is in the 0.3−0.35 M⊙ range. Overall, the results reported in Fig. 5 indicate that the δC values derived from the different sources are related not only to the dust produced during the final AGB phases and now stored in the nebula, but also to the fraction of gas lost during the AGB-PN phase transition.
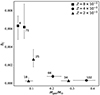 |
Fig. 5. Dust-to-gas ratio derived via SED fitting for the carbon PNe investigated in Paper I as a function of the mass of the gas in the nebula surrounding the individual sources. The different symbols refer to the metallicity of the progenitor stars, determined in Paper I based on the position of the sources on the HR diagram and the surface chemical composition. |
To discuss how the properties of the PNe are related to the previous history of the stars, and how they depend on the mass and chemical composition of the progenitors, we show in Fig. 6δC (left panel) and the total mass of carbon dust nowadays stored in the nebula (right panel) surrounding the different C-rich sources, as a function of the mass of the progenitor stars, whose properties were discussed in the previous section. The mass of dust was found by multiplying δC and Mgas deduced on the basis of the analysis of the SED.
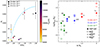 |
Fig. 6. Dust properties of the sources investigated. Left: Carbon dust-to-gas ratio of the LMC sources considered in the present work (inferred via SED fitting) as a function of the progenitors’ mass (deduced based on the position on the HR diagram and the surface chemical composition). The cyan line indicates the approximate trend traced by the sources with effective temperatures below 105 K. Right: Mass of the dust in the nebula surrounding the individual sources as a function of the progenitors’s mass (filled markers). Empty markers indicate the dust mass produced by model stars of the same mass during the whole C-star phase (circles), during the late two inter-pulse phases (triangles), and during the final inter-pulse phase (squares). |
The results reported on the left plane indicate that δC generally increases with the progenitor’s mass, up to the largest dust fractions, of the order of 0.006. The masses reported on the abscissa of the right panel of Fig. 6 are the same as in the left panel. For each of the masses considered we also show the overall dust mass produced during the carbon rich phase, and the dust masses released during the last one and the last two inter-pulses phases, derived by means of the dust formation modelling described in Sect. 2.2. These quantities can be deduced based on the time variation of the DPR reported in Figs. 1, 2, and 3.
4.2. Understanding the connection between the dust and gas content of the nebulae and the progenitors’ mass
Tosi et al. (2022) investigated a sample of post-AGB stars in the LMC and found that consistency between the observed SEDs and the results from dust formation and synthetic SED modelling could be obtained under the assumption that the winds of the stars experiencing very large DPR during the final AGB phases are faster than those of stars characterised by a lower efficient dust production at the end of the AGB evolution. This is consistent with results from dust formation and wind dynamics modelling, which demonstrated that the asymptotic velocity of the AGB winds increases with the efficiency of the dust formation process, owing to the enhanced effects of the radiation pressure on dust grains. This is further confirmed by the modelling of dust formation used to obtain the results reported in Figs. 1, 2, and 3: we find that the asymptotic velocity of the outflow during the final AGB phases is ∼ 30 km/s for the 2 M⊙ model star, then decreases to ∼ 20 km/s, for the 1 M⊙ model star, whereas it is slightly below 10 km/s in the 0.9 M⊙ case.
The δC versus Mgas trend shown in Fig. 5 can be explained by considering that the stars populating the left, upper region of the plane are those that experienced the largest DPRs during the late AGB evolution, so that they lost a significant fraction of the gas in their surroundings, owing to the fast winds. Conversely, the stars in the right, bottom corner descend from progenitors characterised by poor dust formation during the whole AGB lifetime, so that they were able to keep most of the gas by the time that they reached the PN stage.
The left panel of Fig. 6 shows that δC generally increases with the progenitor’s mass, which is a mere consequence of how the efficiency of dust production during the very final AGB phases depends on the initial mass of the star. Indeed, as discussed in the previous section, and shown in the right panels of Figs. 1 and 2 as well as in Fig. 3, the DPR at the tip of the AGB phase increases from ∼ 5 × 10⁻⁹ M⊙/yr, for the lowest masses considered here (∼ 0.9 M⊙), to ∼ 5 × 10⁻⁷ M⊙/yr, for M ∼ 2 M⊙. The growing trend of δC with the progenitors’ mass visible in Fig. 6 is therefore a consequence of the larger dust production in the wind of higher-mass C-stars, in turn related to the larger accumulation of carbon during their evolution, as discussed in Sect. 3. The higher δC found for the higher-mass stars is also due to the fact that the gas in their surroundings is dispersed more easily: as discussed earlier in this section, the large DPRs enhance the effects of the radiation pressure acting on the newly formed dust particles, which leads to faster winds. It is within this framework that we explain that the sources with the lowest Mgas, as clear in Fig. 6, are SMP LMC 4 and SMP LMC 71, those characterised by the largest DPR during the final AGB phases. Overall, these results are consistent with the analysis on the PN sample of Andromeda presented by Bhattacharya et al. (2019).
4.3. Relationship between the dust content of the nebulae and the progenitors’ mass
In the right panel of Fig. 6 we compare the current estimated mass of the dust in the nebula with the dust produced by the progenitor stars during the final AGB phases: in particular, we show the total dust released by the stars during the last two inter-pulses experienced, before the start of the evolution towards the post-AGB phase. These results offer the opportunity to evaluate the dust survival from the AGB to the current PN phase.
For the stars descending from M > 1 M⊙ progenitors, the current dust mass is lower than predicted by dust formation modelling, an indication that part of the dust was lost, either driven away by radiation pressure or vaporised by the hot temperatures in the nebula. As far as SMP LMC 4 is concerned, the current dust mass is about half that found via dust formation modelling, whereas in the cases of SMP LMC 102 and SMP LMC 71 the ‘dust depletion factor’ is around 3: this is consistent with the fact that that these two stars are the hottest ones in the sample, with effective temperatures above 105 K; we thus expect that sublimation of the solid grains destroyed part of the dust in the nebula. We discuss this point further at the end of this section.
Moving to lower masses, we find the interesting results regarding SMP LMC 25, for which the situation is reversed with respect to the larger mass counterparts: the current dust mass in the nebula, estimated to be ∼ 3 × 10⁻⁴ M⊙, is above the overall dust produced during the AGB phase, which is found to be below 5 × 10⁻⁵ M⊙. This apparently anomalous behaviour is in fact consistent with the analysis by Tosi et al. (2022), who outlined that dust production by low-mass, metal-poor AGB stars is likely underestimated, and that higher DPRs were required to reproduce the IR excesses of some metal-poor, carbon rich post-AGB stars in the Magellanic Clouds. Tosi et al. (2022) connected this behaviour with the fact that the recipes used to model dust formation (we refer specifically to the prescriptions by the Berlin group discussed in Sect. 2.1) from C-stars neglect the role of the surface chemical composition, not taking into account that lower-metallicity stars have a smaller quantity of oxygen and, thus, that the amount of carbon available to form carbon dust is greater than in the higher-metallicity counterparts, as discussed in Sect. 2. The dust mass around SMP LMC 25 is slightly higher than in the case of SMP LMC 66, thus apparently breaking the increasing trend of the dust mass with the progenitor’s mass traced by the other stars in the sample. According to our reading, this is due to the lower metallicity of SMP LMC 25, which eases the formation of carbon dust with respect to SMP LMC 66, despite the higher initial mass of the latter source.
Still in the context of the progeny of low-mass stars, we consider the case of SMP LMC 34, for which the overall carbon dust estimated from the analysis of the SED is ∼ 2.5 × 10⁻⁵ M⊙/yr, the lowest among the C-stars investigated. This is related to the fact that the progenitor’s mass is very close to the minimum threshold mass required to reach the C-star stage, such that the carbon excess with respect to oxygen, the key quantity for the formation of solid carbon (see Sect. 2), is extremely small. Indeed, the results from Paper I indicate that this source, classified as carbon-rich, can be considered as a C-stars only if the lower limit of the measured oxygen abundance is considered (see Fig. 7 in Paper I). The small dust mass and the extremely low δC ∼ 2.5 × 10⁻⁴ of SMP LMC 34 are a consequence of the very small carbon excess with respect to oxygen, so that most carbon atoms are locked into CO molecules, leaving little quantities available to the formation of dust.
SMP LMC 18 is characterised by an extremely small carbon dust mass of ∼ 2 × 10⁻⁵ M⊙/yr, when compared to the other C-stars examined here. As discussed above, the dynamics of the gas and dust in the nebula may have been altered by the ignition of a late TP, which would have favoured the loss of additional quantities of gas and dust during the transition from the post-AGB to the PN phase.
The PN sample studied in Paper I also includes SMP LMC 80 and SMP LMC 81, which are oxygen-rich. The situation regarding SMP LMC 80 is straightforward, since the lack of dust in the nebula is explained by the negligible dust production that characterised the AGB phase of the low-mass progenitor star, as discussed Sect. 3.
On the other hand, the analysis of the SED of SMP LMC 81 done in Paper I showed that some dust is present, with dust-to-gas ratio ∼ 3.3 × 10⁻³, within ∼ 0.13 M⊙ of gas. If located into the Mgas versus δC plane in Fig. 5, SMP LMC 81 would fall off the general sequence traced by the other dusty PNe, as the dust fraction is higher than the C-rich sources characterised by similar gas masses. However, comparing these directly may be inappropriate due to intrinsic differences between silicate and carbonaceous dust, such as their extinction properties and the distance of the dusty layer from the CS.
The analysis of a larger sample of oxygen-rich PNe is needed before we can draw conclusions regarding oxygen-rich stars.
4.4. Outliers that do not follow the Mgas−δC and δC−M/M⊙ trends
The only clear deviation from the anti-correlation pattern shown in Fig. 5 is SMP LMC 18, which in Paper I was interpreted as the descendant of a ∼ 0.9 M⊙ star that experienced a late TP just after the start of the post-AGB phase, similar to the evolution called AFTP (AGB final thermal pulse) by Blöcker (2001). The ignition of the late TP favoured the return of the evolutionary track to the red, followed by the excursion to the blue, until the present evolutionary stage. This is the reason for the relatively low luminosity of SMP LMC 18 (∼ 2 × 10³ L⊙) in comparison to the other stars (see the evolutionary track of the 0.9 M⊙ of metallicity Z = 2 × 10⁻³, in Fig. 5 of Paper I). The temporary cooling of the external regions following the ignition of the late TP altered the dynamics of the gas and dust released during the late AGB phases, likely favouring the loss of a further amount of residual gas, which is the reason for the anomalous position of this source in the plane shown in Fig. 5.
The sources SMP LMC 102 and SMP LMC 71 fall out of the main pattern traced by the stellar mass versus δC trend, roughly indicated with a cyan line in the left panel of Fig. 6 (actually for SMP LMC 71, when the error bar is considered, the results are marginally consistent). According to our understanding, this is related to the high effective temperatures of their two central stars, well above 105 K, which favoured the destruction of an important part of the dust present in their surroundings. A similar explanation might hold for SMP LMC 66. This interpretation is consistent with the previous Spitzer IR observational spectroscopic studies of PNe in the Galaxy (Stanghellini et al. 2012) and in the Magellanic Clouds (Stanghellini et al. 2007). Stanghellini et al. (2007) show that the large majority of PNe with featureless IR spectra (thus no dusty) are among those with the highest effective temperatures for their central stars.
5. Conclusions
We used results from stellar evolution and dust formation modelling to link the properties of the gas and dust in a sample of PNe in the LMC, obtained via SED fitting, with the main parameters of the progenitor stars, namely mass and chemical composition. The analysis is mostly limited to C-stars since our sample only included two oxygen-rich objects, one of which, descending from a very low-mass star (∼ 0.6 M⊙), exhibits no traces of dust.
We find that, generally speaking, the progenitor’s mass is anti-correlated with the nebular gas mass, while it correlates with the dust-to-gas ratio. The dust-to-gas ratio is found to increase from δC ∼ 5 × 10⁻⁴ to δC ∼ 6 × 10⁻³ as the progenitor mass increases from 0.9 M⊙ to 2 M⊙. Very hot PNe, with effective temperatures higher than 105 K, do not follow this trend, owing to the strong vaporisation the dust particles are exposed to in such hot environments.
The understanding of this behaviour is that, as far as C stars are concerned, higher-mass stars produce more dust during the AGB phase, which per se explains the higher dust content in the nebula surrounding the C-star. Furthermore, the greater dust production during the late AGB phases of higher-mass stars favours higher expansion velocities, owing to the enhanced effects of radiation pressure on the dust grains: this is the reason why the gas content of the nebula decreases from ∼ 0.3−0.35 M⊙, for 0.9 M⊙ progenitors, to ∼ 0.05 M⊙, for the descendants of 2 M⊙ stars. This supports the validity of the higher dust-to-gas ratios we derived.
This study contributes to establishing a methodology able to link the properties of PNe with the mass, chemical composition, and dust production efficiency of the progenitor stars. This information will be used to shed new light on the dust production mechanism of low- and intermediate-mass stars during the late AGB phases, which in turn will allow us to understand the role played by AGB stars as dust manufacturers. The sample used in the present work must be enlarged to explore the whole range of C-star progenitor masses (thus far limited to 2 M⊙) and to include oxygen-rich PNe, whose dust is composed of silicates.
The lower limit of the mass of the stars that become C-stars is also sensitive to the amount of mass lost during the ascending of the red giant branch: a large mass loss experienced during the red giant branch inhibits the formation of C-stars. This issue is relevant for M < 1.5 M⊙ stars, as higher-mass objects lose only a small fraction of their envelope mass during the red giant branch phase. To prevent any ambiguity, we refer to the mass of the star at the start of the core helium burning phase throughout this article.
Acknowledgments
This article is based upon work from COST Action CA21126 – Carbon molecular nanostructures in space (NanoSpace), supported by COST (European Cooperation in Science and Technology). PV acknowledges support by the INAF-Theory-GRANT 2022 “Understanding mass loss and dust production from evolved stars”. DAGH acknowledges the support from the State Research Agency (AEI) of the Ministry of Science, Innovation and Universities (MICIU) of the Government of Spain, and the European Regional Development Fund (ERDF), under grants PID2020-115758GB-I00/AEI/10.13039/501100011033 and PID2023-147325NB-I00/AEI/10.13039/501100011033. FDA acknowledges suppor by the INAF-Mini-GRANTS 2023 “Understanding evolved stars and their dust production through the lens of planetary nebulae” DK acknowledges funding support from the Australian Research Council Discovery Project DP240101150. M.A.G.-M. acknowledge to be funded by the European Union (ERC, CET-3PO, 101042610). Views and opinions expressed are however those of the author(s) only and do not necessarily reflect those of the European Union or the European Research Council Executive Agency. Neither the European Union nor the granting authority can be held responsible for them.
References
- Aller, L. H., & Czyzak, S. J. 1983, ApJS, 51, 211 [NASA ADS] [CrossRef] [Google Scholar]
- Bhattacharya, S., Arnaboldi, M., Caldwell, N., et al. 2019, A&A, 631, A56 [NASA ADS] [CrossRef] [EDP Sciences] [Google Scholar]
- Blöcker, T. 2001, Ap&SS, 275, 1 [CrossRef] [Google Scholar]
- Bloecker, T. 1995, A&A, 297, 727 [Google Scholar]
- Boyer, M. L., Srinivasan, S., Riebel, D., et al. 2012, ApJ, 748, 40 [Google Scholar]
- Busso, M., Gallino, R., & Wasserburg, G. J. 1999, ARA&A, 37, 239 [Google Scholar]
- Dell’Agli, F., Ventura, P., Schneider, R., et al. 2015a, MNRAS, 447, 2992 [Google Scholar]
- Dell’Agli, F., García-Hernández, D. A., Ventura, P., et al. 2015b, MNRAS, 454, 4235 [Google Scholar]
- Dell’Agli, F., Di Criscienzo, M., Boyer, M. L., et al. 2016, MNRAS, 460, 4230 [Google Scholar]
- Dell’Agli, F., Di Criscienzo, M., Ventura, P., et al. 2018a, MNRAS, 479, 5035 [Google Scholar]
- Dell’Agli, F., García-Hernández, D. A., Ventura, P., et al. 2018b, MNRAS, 475, 3098 [CrossRef] [Google Scholar]
- Dell’Agli, F., Di Criscienzo, M., García-Hernández, D. A., et al. 2019, MNRAS, 482, 4733 [Google Scholar]
- Dell’Agli, F., Tosi, S., Kamath, D., et al. 2023a, A&A, 671, A86 [NASA ADS] [CrossRef] [EDP Sciences] [Google Scholar]
- Dell’Agli, F., Tosi, S., Kamath, D., et al. 2023b, MNRAS, 526, 5386 [CrossRef] [Google Scholar]
- Ferland, G. J., Chatzikos, M., Guzmán, F., et al. 2017, RMxAA, 53, 385 [NASA ADS] [Google Scholar]
- Ferrarotti, A. S., & Gail, H.-P. 2001, A&A, 371, 133 [NASA ADS] [CrossRef] [EDP Sciences] [Google Scholar]
- Ferrarotti, A. S., & Gail, H.-P. 2002, A&A, 382, 256 [NASA ADS] [CrossRef] [EDP Sciences] [Google Scholar]
- Ferrarotti, A. S., & Gail, H.-P. 2006, A&A, 447, 553 [CrossRef] [EDP Sciences] [Google Scholar]
- Gail, H.-P., & Sedlmayr, E. 1999, A&A, 347, 594 [Google Scholar]
- García-Hernández, D. A., Villaver, E., García-Lario, P., et al. 2012, ApJ, 760, 107 [CrossRef] [Google Scholar]
- García-Lario, P., & Perea Calderón, J. V. 2003, Exploiting the ISO Data Archive. Infrared Astronomy in the Internet Age, 511, 97 [Google Scholar]
- Henry, R. B. C., Liebert, J., & Boroson, T. A. 1989, ApJ, 339, 872 [NASA ADS] [CrossRef] [Google Scholar]
- Iben, I., Jr. 1974, ARA&A, 12, 215 [NASA ADS] [CrossRef] [Google Scholar]
- Kamath, D., Van Winckel, H., Ventura, P., et al. 2022, ApJ, 927, L13 [NASA ADS] [CrossRef] [Google Scholar]
- Kamath, D., Dell’Agli, F., Ventura, P., et al. 2023, MNRAS, 519, 2169 [Google Scholar]
- Karakas, A. I., & Lattanzio, J. C. 2014, PASA, 31, e030 [NASA ADS] [CrossRef] [Google Scholar]
- Khromov, G. S. 1989, Space Sci. Rev., 51, 339 [NASA ADS] [CrossRef] [Google Scholar]
- Laor, A., & Draine, B. T. 1993, ApJ, 402, 441 [NASA ADS] [CrossRef] [Google Scholar]
- Leisy, P., & Dennefeld, M. 2006, A&A, 456, 451 [NASA ADS] [CrossRef] [EDP Sciences] [Google Scholar]
- Marigo, P. 2002, A&A, 387, 507 [NASA ADS] [CrossRef] [EDP Sciences] [Google Scholar]
- Marigo, P., & Aringer, B. 2009, A&A, 508, 1539 [CrossRef] [EDP Sciences] [Google Scholar]
- Marini, E., Dell’Agli, F., Groenewegen, M. A. T., et al. 2021, A&A, 647, A69 [NASA ADS] [CrossRef] [EDP Sciences] [Google Scholar]
- Marini, E., Dell’Agli, F., Kamath, D., et al. 2023, A&A, 670, A97 [NASA ADS] [CrossRef] [EDP Sciences] [Google Scholar]
- Martin, P. G., & Rouleau, F. 1991, Extreme Ultraviolet Astronomy, 341 [CrossRef] [Google Scholar]
- Mathis, J. S., Rumpl, W., & Nordsieck, K. H. 1977, ApJ, 217, 425 [Google Scholar]
- Mazzitelli, I. 1979, A&A, 79, 251 [Google Scholar]
- Nanni, A., Bressan, A., Marigo, P., et al. 2013, MNRAS, 434, 2390 [NASA ADS] [CrossRef] [Google Scholar]
- Nanni, A., Bressan, A., Marigo, P., et al. 2014, MNRAS, 438, 2328 [NASA ADS] [CrossRef] [Google Scholar]
- Pauldrach, A. W. A., Hoffmann, T. L., & Lennon, M. 2001, A&A, 375, 161 [NASA ADS] [CrossRef] [EDP Sciences] [Google Scholar]
- Perea-Calderón, J. V., García-Hernández, D. A., García-Lario, P., et al. 2009, A&A, 495, L5 [NASA ADS] [CrossRef] [EDP Sciences] [Google Scholar]
- Rauch, T. 2003, A&A, 403, 709 [NASA ADS] [CrossRef] [EDP Sciences] [Google Scholar]
- Rouleau, F., & Martin, P. G. 1991, ApJ, 377, 526 [NASA ADS] [CrossRef] [Google Scholar]
- Sackmann, I.-J., & Boothroyd, A. I. 1992, ApJ, 392, L71 [NASA ADS] [CrossRef] [Google Scholar]
- Schneider, R., & Maiolino, R. 2024, A&ARv, 32, 2 [NASA ADS] [CrossRef] [Google Scholar]
- Schneider, R., Valiante, R., Ventura, P., et al. 2014, MNRAS, 442, 1440 [NASA ADS] [CrossRef] [Google Scholar]
- Shaw, R. A., Stanghellini, L., Mutchler, M., et al. 2001, ApJ, 548, 727 [NASA ADS] [CrossRef] [Google Scholar]
- Stanghellini, L., García-Lario, P., García-Hernández, D. A., et al. 2007, ApJ, 671, 1669 [NASA ADS] [CrossRef] [Google Scholar]
- Stanghellini, L., García-Hernández, D. A., García-Lario, P., et al. 2012, ApJ, 753, 172 [NASA ADS] [CrossRef] [Google Scholar]
- Tosi, S., Dell’Agli, F., Kamath, D., et al. 2022, A&A, 668, A22 [NASA ADS] [CrossRef] [EDP Sciences] [Google Scholar]
- Tosi, S., Kamath, D., Dell’Agli, F., et al. 2023, A&A, 673, A41 [NASA ADS] [CrossRef] [EDP Sciences] [Google Scholar]
- Tosi, S., Dell’Agli, F., Kamath, D., et al. 2024, A&A, 688, A36 [NASA ADS] [CrossRef] [EDP Sciences] [Google Scholar]
- Ventura, P., & D’Antona, F. 2005a, A&A, 431, 279 [NASA ADS] [CrossRef] [EDP Sciences] [Google Scholar]
- Ventura, P., & D’Antona, F. 2005b, A&A, 439, 1075 [NASA ADS] [CrossRef] [EDP Sciences] [Google Scholar]
- Ventura, P., Zeppieri, A., Mazzitelli, I., & D’Antona, F. 1998, A&A, 334, 953 [Google Scholar]
- Ventura, P., Di Criscienzo, M., Schneider, R., et al. 2012, MNRAS, 424, 2345 [NASA ADS] [CrossRef] [Google Scholar]
- Ventura, P., Di Criscienzo, M., Carini, R., et al. 2013, MNRAS, 431, 3642 [NASA ADS] [CrossRef] [Google Scholar]
- Ventura, P., Dell’Agli, F., Schneider, R., et al. 2014, MNRAS, 439, 977 [NASA ADS] [CrossRef] [Google Scholar]
- Ventura, P., Dell’Agli, F., Tailo, M., et al. 2022, Universe, 8, 45 [NASA ADS] [CrossRef] [Google Scholar]
- Wachter, A., Schröder, K.-P., Winters, J. M., et al. 2002, A&A, 384, 452 [NASA ADS] [CrossRef] [EDP Sciences] [Google Scholar]
- Wachter, A., Winters, J. M., Schröder, K.-P., et al. 2008, A&A, 486, 497 [NASA ADS] [CrossRef] [EDP Sciences] [Google Scholar]
All Tables
All Figures
|
Fig. 1. The evolution of the physical and dust properties of 1.5 M⊙ and 2 M⊙ stars during the AGB phase. Left: Time variation of the surface carbon mass fraction (solid lines, scale on the left) and of the total mass (dashed lines, scale on the right) of model stars with metallicity Z = 8 × 10⁻³ and initial masses (taken at the start of the core helium burning) of 1.5 M⊙ (red lines) and 2 M⊙ (black). The first part of the AGB evolution, during which the stars are oxygen-rich, is indicated with thin lines and the evolutionary phases after the C-star stage is reached with thick lines. Right: Time variation of solid carbon (dashed lines) and SiC (solid lines) production rates experienced by the 1.5 M⊙ (triangles) and 2 M⊙ (squares) model stars reported in the left panel during the C-star phase. The individual points refer to the inter-pulse phases. Magenta lines and points indicate the variation in the dust-to-gas ratio (scale on the right). |
| In the text | |
|
Fig. 2. Same as Fig. 1 but for the evolution of 1 M⊙ (red lines) and 1.25 M⊙ (black) model stars of metallicity Z = 4 × 10⁻³. The connection between the thickness of the lines and the surface C/O is the same as in Fig. 1. |
| In the text | |
|
Fig. 3. Same as Figs. 1 and 2 but for the evolution of a 0.9 M⊙ model star of metallicity Z = 2 × 10⁻³. |
| In the text | |
|
Fig. 4. Time variation of the luminosity (solid lines) and of the total mass (dashed) of model stars of metallicity Z = 4 × 10⁻³ and initial masses 0.6 M⊙ (red) and 0.8 M⊙ (black). The blue line indicates the DPR of the 0.8 M⊙ model star. |
| In the text | |
|
Fig. 5. Dust-to-gas ratio derived via SED fitting for the carbon PNe investigated in Paper I as a function of the mass of the gas in the nebula surrounding the individual sources. The different symbols refer to the metallicity of the progenitor stars, determined in Paper I based on the position of the sources on the HR diagram and the surface chemical composition. |
| In the text | |
|
Fig. 6. Dust properties of the sources investigated. Left: Carbon dust-to-gas ratio of the LMC sources considered in the present work (inferred via SED fitting) as a function of the progenitors’ mass (deduced based on the position on the HR diagram and the surface chemical composition). The cyan line indicates the approximate trend traced by the sources with effective temperatures below 105 K. Right: Mass of the dust in the nebula surrounding the individual sources as a function of the progenitors’s mass (filled markers). Empty markers indicate the dust mass produced by model stars of the same mass during the whole C-star phase (circles), during the late two inter-pulse phases (triangles), and during the final inter-pulse phase (squares). |
| In the text | |
Current usage metrics show cumulative count of Article Views (full-text article views including HTML views, PDF and ePub downloads, according to the available data) and Abstracts Views on Vision4Press platform.
Data correspond to usage on the plateform after 2015. The current usage metrics is available 48-96 hours after online publication and is updated daily on week days.
Initial download of the metrics may take a while.