Fig. 1.
Download original image
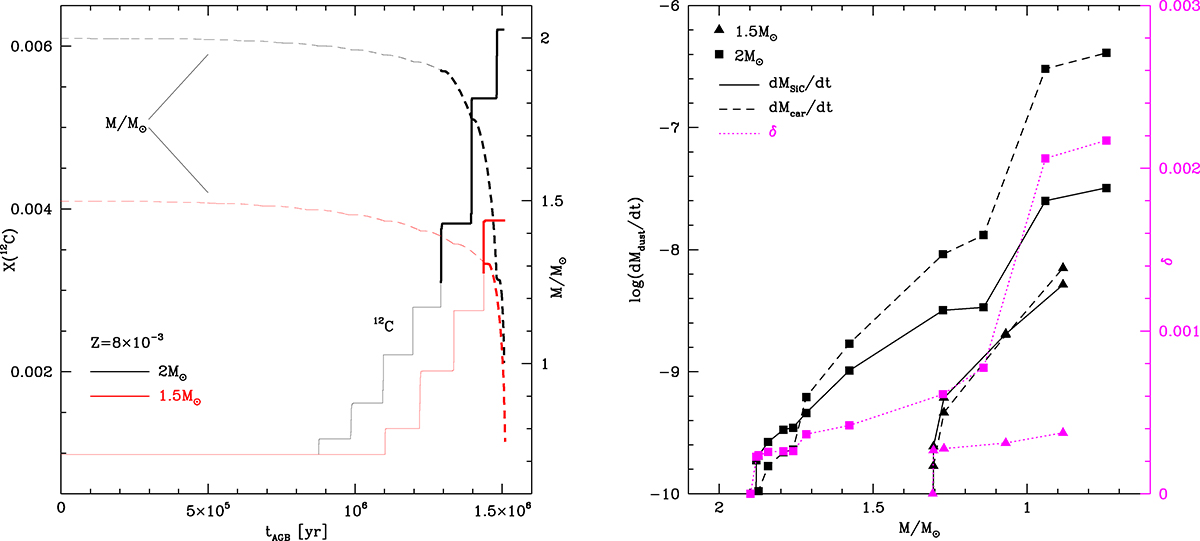
The evolution of the physical and dust properties of 1.5 M⊙ and 2 M⊙ stars during the AGB phase. Left: Time variation of the surface carbon mass fraction (solid lines, scale on the left) and of the total mass (dashed lines, scale on the right) of model stars with metallicity Z = 8 × 10⁻³ and initial masses (taken at the start of the core helium burning) of 1.5 M⊙ (red lines) and 2 M⊙ (black). The first part of the AGB evolution, during which the stars are oxygen-rich, is indicated with thin lines and the evolutionary phases after the C-star stage is reached with thick lines. Right: Time variation of solid carbon (dashed lines) and SiC (solid lines) production rates experienced by the 1.5 M⊙ (triangles) and 2 M⊙ (squares) model stars reported in the left panel during the C-star phase. The individual points refer to the inter-pulse phases. Magenta lines and points indicate the variation in the dust-to-gas ratio (scale on the right).
Current usage metrics show cumulative count of Article Views (full-text article views including HTML views, PDF and ePub downloads, according to the available data) and Abstracts Views on Vision4Press platform.
Data correspond to usage on the plateform after 2015. The current usage metrics is available 48-96 hours after online publication and is updated daily on week days.
Initial download of the metrics may take a while.