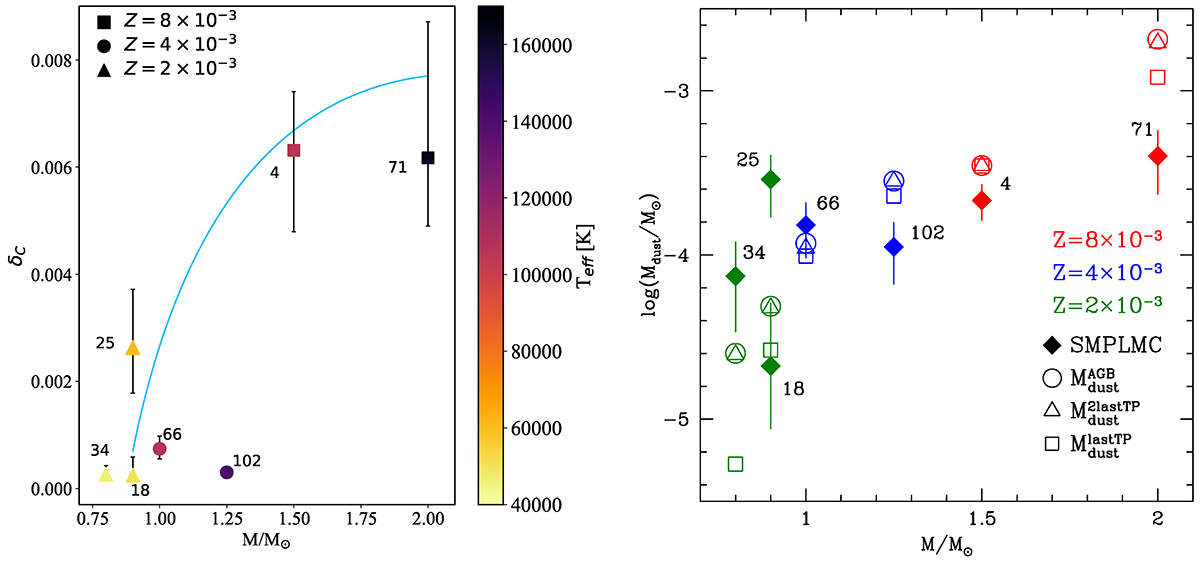
Fig. 6.
Download original image
Dust properties of the sources investigated. Left: Carbon dust-to-gas ratio of the LMC sources considered in the present work (inferred via SED fitting) as a function of the progenitors’ mass (deduced based on the position on the HR diagram and the surface chemical composition). The cyan line indicates the approximate trend traced by the sources with effective temperatures below 105 K. Right: Mass of the dust in the nebula surrounding the individual sources as a function of the progenitors’s mass (filled markers). Empty markers indicate the dust mass produced by model stars of the same mass during the whole C-star phase (circles), during the late two inter-pulse phases (triangles), and during the final inter-pulse phase (squares).
Current usage metrics show cumulative count of Article Views (full-text article views including HTML views, PDF and ePub downloads, according to the available data) and Abstracts Views on Vision4Press platform.
Data correspond to usage on the plateform after 2015. The current usage metrics is available 48-96 hours after online publication and is updated daily on week days.
Initial download of the metrics may take a while.