Fig. 7.
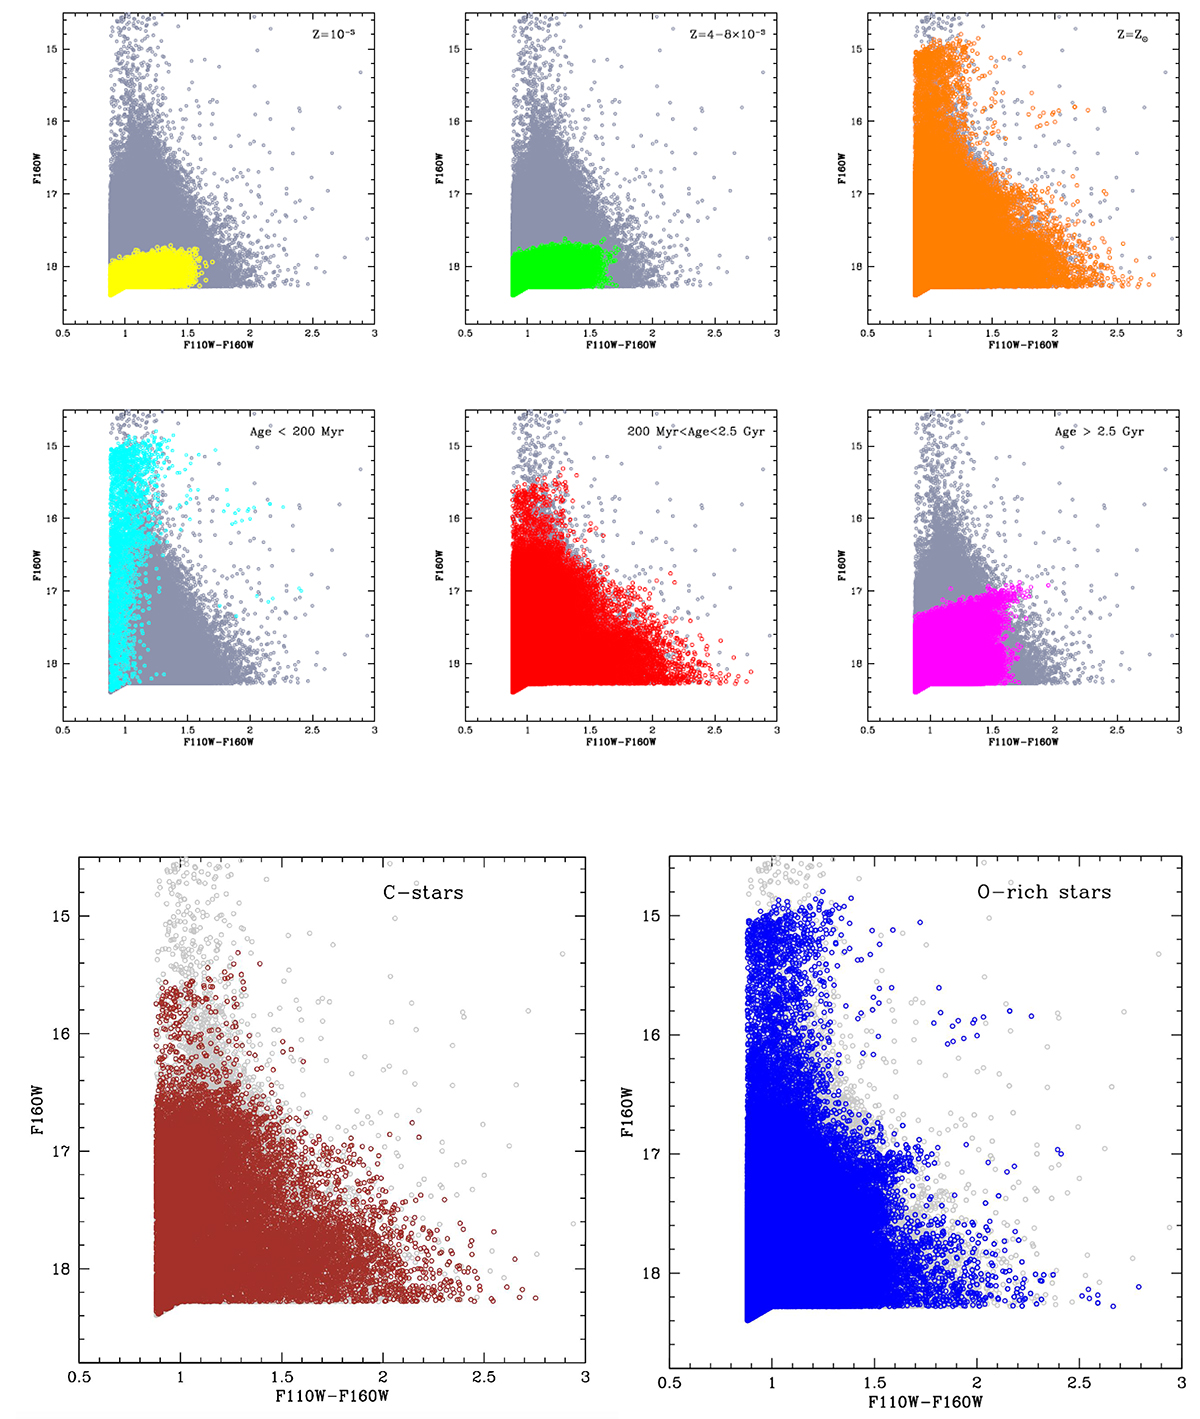
Download original image
AGB candidates from the G22 sample in M31 are shown with grey points in the colour-magnitude (F110W−F160W, F160W) diagram. The expected distribution of metal-poor, sub-solar, and solar metallicity stars from the synthetic modelling is indicated with different colour-coding in the top, left, middle and right panels, respectively. The central panels indicate an age classification, in which the different sources are divided among young stars formed earlier than 200 Myr ago (left panel), old objects formed in ancient epochs (right), and intermediate age stars, which eventually reach the C-star stage (middle). The bottom panels show the distribution of C- and O-rich stars.
Current usage metrics show cumulative count of Article Views (full-text article views including HTML views, PDF and ePub downloads, according to the available data) and Abstracts Views on Vision4Press platform.
Data correspond to usage on the plateform after 2015. The current usage metrics is available 48-96 hours after online publication and is updated daily on week days.
Initial download of the metrics may take a while.