Fig. 6.
Download original image
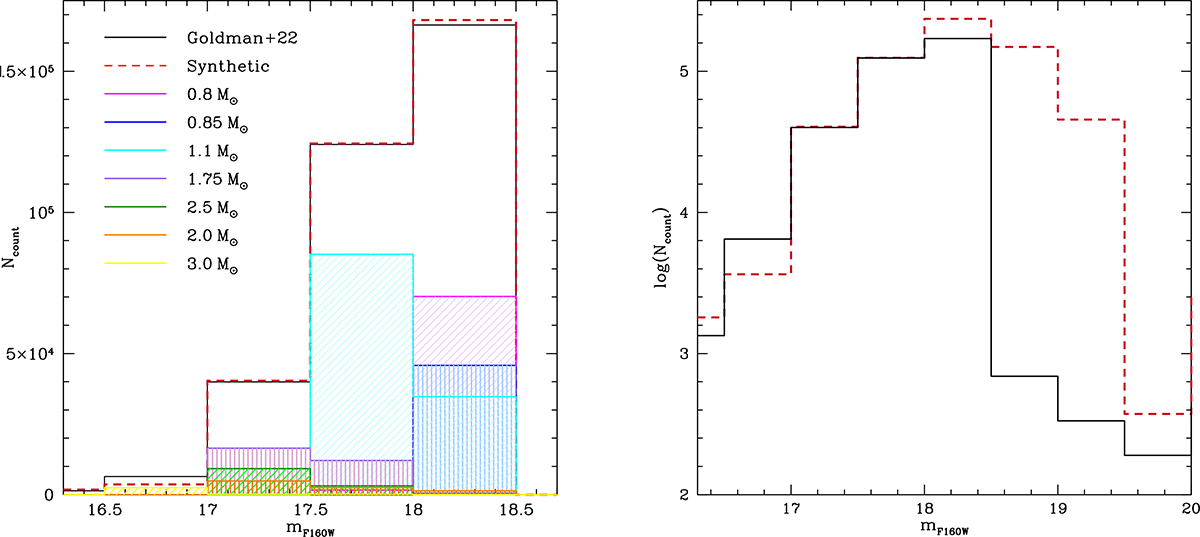
Left: The F160W LF of the stars included in the G22 sample, indicated with a black line, is compared with the results obtained from population synthesis, shown with a red, dashed line. The contribution from stars of different mass in the various F160W bins is also given. In the legend the initial masses of the progenitor stars are indicated. Right: the same F160W LF reported on the left panel, in a logarithmic scale. For readability we show the total LF only, omitting the contributions from the stars of different mass. The large discrepancy between the dashed and the solid lines in the F160W > 18.5 domain is due to the cut adopted by G22 in that F160W range, where only the (few) sources identified as extreme AGBs were included.
Current usage metrics show cumulative count of Article Views (full-text article views including HTML views, PDF and ePub downloads, according to the available data) and Abstracts Views on Vision4Press platform.
Data correspond to usage on the plateform after 2015. The current usage metrics is available 48-96 hours after online publication and is updated daily on week days.
Initial download of the metrics may take a while.