Fig. 4
Download original image
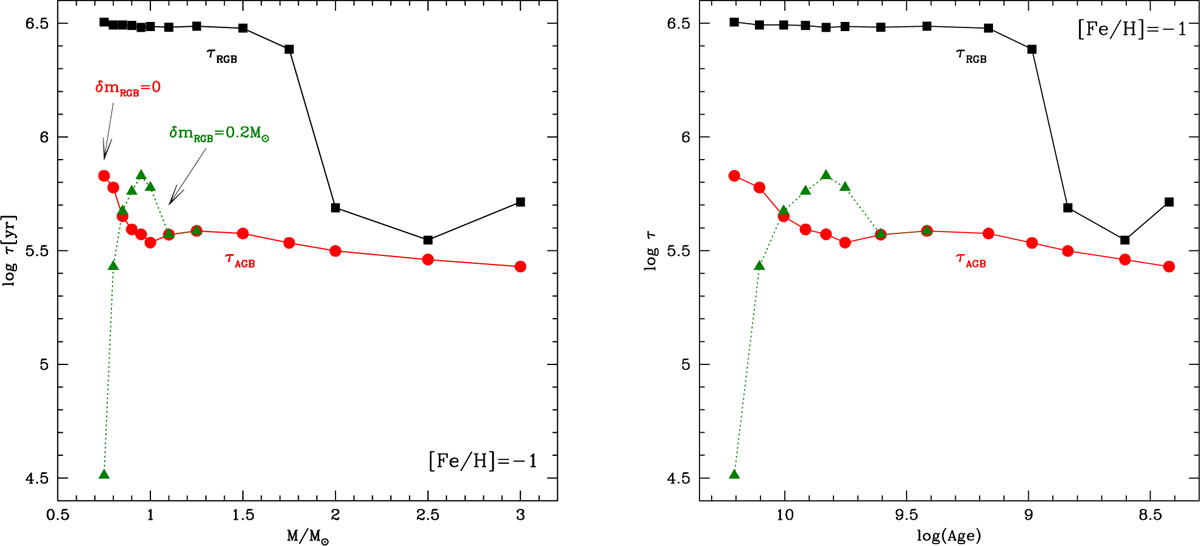
Duration of the phase during which the stars evolve into the RGB (black squares and lines) and the AGB (red dots and lines) boxes introduced by H23 as a function of the initial mass (left) and the formation epoch (right). Dotted lines and green triangles refer to the results obtained by assuming 0.2 M⊙ mass loss during the RGB evolution of M < 1.5 M⊙ stars.
Current usage metrics show cumulative count of Article Views (full-text article views including HTML views, PDF and ePub downloads, according to the available data) and Abstracts Views on Vision4Press platform.
Data correspond to usage on the plateform after 2015. The current usage metrics is available 48-96 hours after online publication and is updated daily on week days.
Initial download of the metrics may take a while.