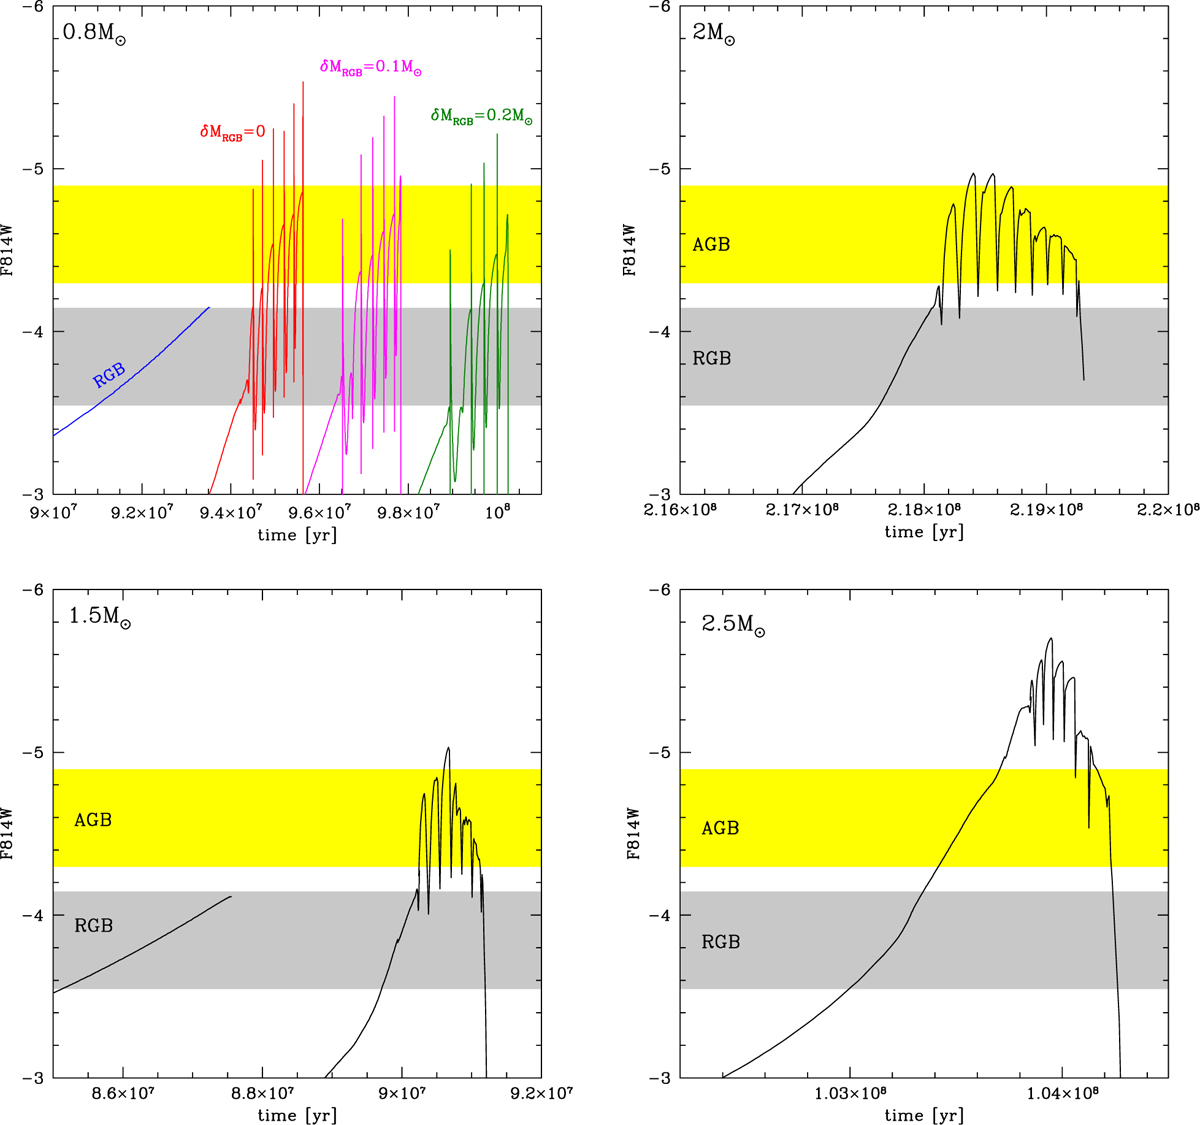
Fig. 3
Download original image
Top panels: time variation of the F814W magnitude of the 0.8 M⊙ and 2 M⊙ model stars shown in Fig. 2. The grey and yellow regions refer to the F814W magnitudes of the RGB and AGB boxes introduced by H23. The evolution of the 0.8 M⊙ model star is divided into the RGB (blue line) and the post-flash (red) parts. The magenta and green lines refer to the evolution of the 0.8 M⊙ model star, under the hypothesis that 0.1 M⊙ and 0.2 M⊙ were lost during the RGB phase. Bottom panels: time variation of the F814W magnitude of 1.5 M⊙ and 2.5 M⊙ stars.
Current usage metrics show cumulative count of Article Views (full-text article views including HTML views, PDF and ePub downloads, according to the available data) and Abstracts Views on Vision4Press platform.
Data correspond to usage on the plateform after 2015. The current usage metrics is available 48-96 hours after online publication and is updated daily on week days.
Initial download of the metrics may take a while.