Fig. 5
Download original image
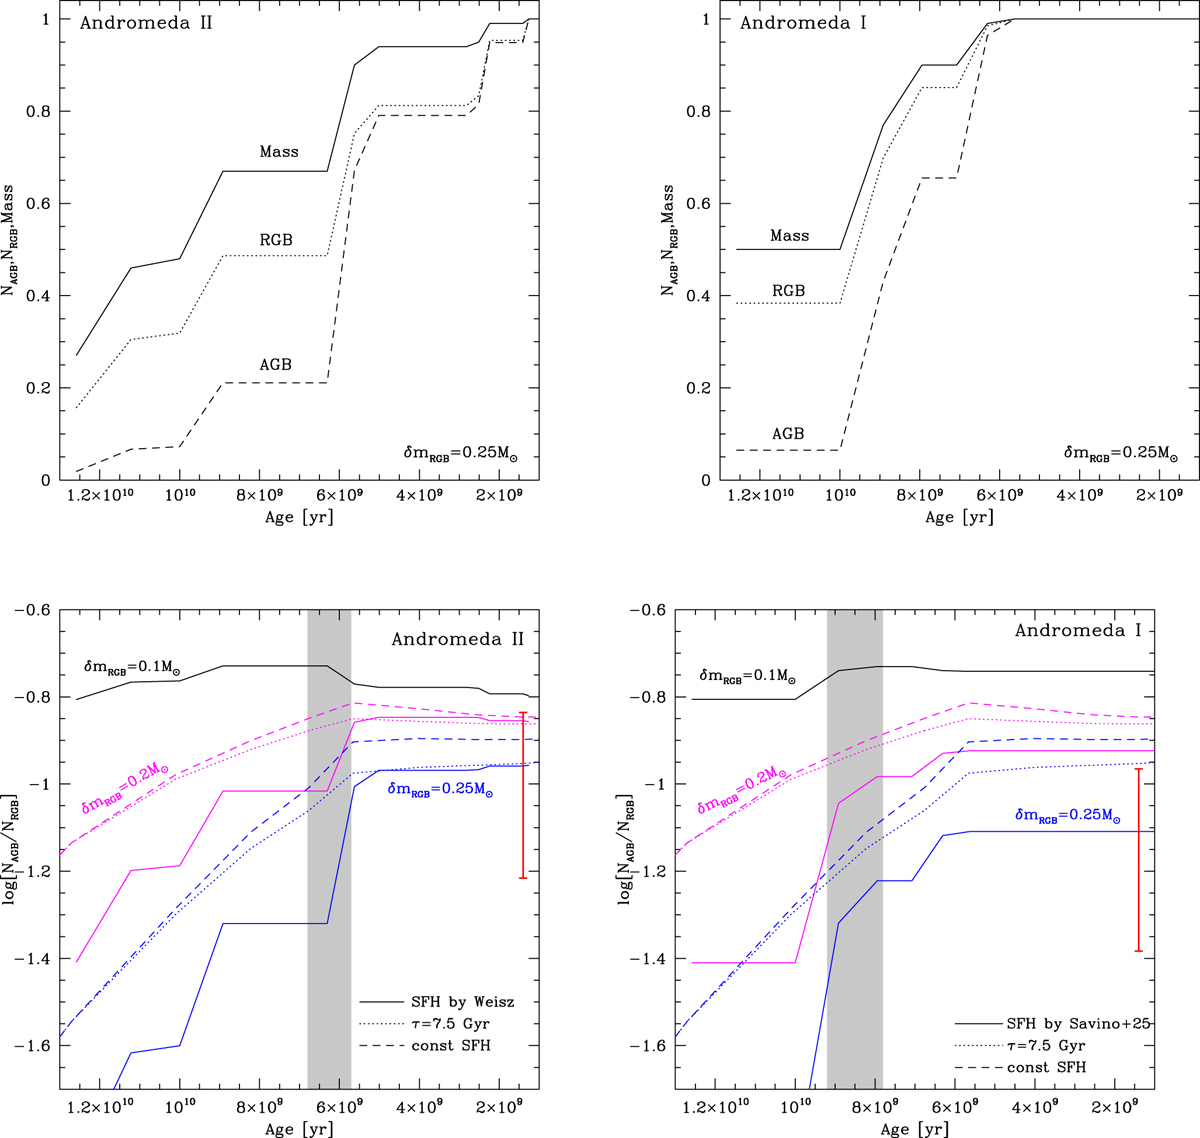
Top panels: variation of the relative mass of the galaxy (solid line) and of the fraction of AGB (dashed) and RGB (dotted) stars formed for the δm(RGB) = 0.25 M⊙ case and the SFH by Weisz et al. (2014) and Savino et al. (2025) for the galaxies Andromeda II (top left) and Andromeda I (top right), respectively. Bottom panels: cumulative contribution of various star formation epochs to the present-day ratio of AGB-to-RGB stars of Andromeda II (bottom left) and Andromeda I (bottom right), based on different assumptions regarding the star formation history and the average mass lost by low-mass stars during the RGB phase. Solid lines indicate results found by adopting the SFH by Weisz et al. (2014) for Andromeda II and that of Savino et al. (2025) for Andromeda I; dashed tracks are based on the assumption of constant SFH; dotted lines refer to results obtained when assuming that the SFH decays with a timescale of 7.5 Gyr. Colour-coding indicates the mass lost by stars during the RGB evolution: the cases δm(RGB) = 0.1 M⊙ (black lines), 0.2 M⊙ (magenta), and 0.25 M⊙ (blue) are shown. The grey shaded region indicates the T90 epoch; the red line refers to the AGB-to-RGB ratio derived for Andromeda II and Andromeda I.
Current usage metrics show cumulative count of Article Views (full-text article views including HTML views, PDF and ePub downloads, according to the available data) and Abstracts Views on Vision4Press platform.
Data correspond to usage on the plateform after 2015. The current usage metrics is available 48-96 hours after online publication and is updated daily on week days.
Initial download of the metrics may take a while.