| Issue |
A&A
Volume 709, May 2026
|
|
|---|---|---|
| Article Number | A65 | |
| Number of page(s) | 10 | |
| Section | Galactic structure, stellar clusters and populations | |
| DOI | https://doi.org/10.1051/0004-6361/202558569 | |
| Published online | 05 May 2026 | |
The multiple corrugations in the Galactic disk derived from the LAMOST and Gaia survey data
1
National Astronomical Observatories, Chinese Academy of Sciences,
Beijing
100101,
PR China
2
Shandong Key Laboratory of Space Environment and Exploration Technology, Institute of Space Sciences, School of Space Science and Technology, Shandong University,
Weihai
264209,
PR China
3
School of Astronomy and Space Science, Nanjing University,
Nanjing
210093,
PR China
4
Key Laboratory of Modern Astronomy and Astrophysics (Nanjing University), Ministry of Education,
Nanjing
210093,
PR China
5
School of Astronomy and Space Science, University of Chinese Academy of Sciences,
Beijing
100049,
PR China
6
School of Physics and Optoelectronic Engineering, Hainan University,
Haikou
570228,
PR China
★ Corresponding authors: This email address is being protected from spambots. You need JavaScript enabled to view it.
; This email address is being protected from spambots. You need JavaScript enabled to view it.
Received:
15
December
2025
Accepted:
26
March
2026
Abstract
Context. Large spectroscopic and astrometric surveys have revealed complex wave-like features in the Milky Way disk, suggesting that its kinematic and chemical structures are shaped by time-dependent perturbations. Recent studies have reported oscillatory patterns in the Rg–Vϕ − VR space, hinting at a possible structural transition in the outer disk.
Aims. We aim to characterise the transition between the inner and outer Galactic thin disk and to investigate whether radial corrugations can provide a plausible physical interpretation of the observed features.
Methods. We analysed two large stellar samples from LAMOST DR8 and Gaia DR3, combining spatial, kinematic, and chemical diagnostics. A simplified corrugation model – consisting of two radial waves propagating in opposite directions – was constructed and fitted to the observed VR pattern. We further validated the model using N-body simulations.
Results. Both LAMOST and Gaia samples reproduce the previously reported wave-like pattern in the Rg–Vϕ − VR plane. We identify a clear transition between the inner and outer disks via the variations in rotational velocity and metallicities. The corrugation model naturally reproduces the periodic variation of VR with galactocentric radius, and the superposition of the inward- and outward-propagating modes gives rise to a comparable oscillatory pattern in both observations and simulations.
Conclusions. Our modelling suggests that radial corrugations can provide a plausible interpretation of the observed kinematic signatures. The results highlight the complex, multi-perturber nature of the Galactic disk and motivate further investigation with upcoming surveys.
Key words: Galaxy: disk / Galaxy: evolution / Galaxy: kinematics and dynamics / Galaxy: stellar content
© The Authors 2026
 Open Access article, published by EDP Sciences, under the terms of the Creative Commons Attribution License (https://creativecommons.org/licenses/by/4.0), which permits unrestricted use, distribution, and reproduction in any medium, provided the original work is properly cited.
This article is published in open access under the Subscribe to Open model. This email address is being protected from spambots. You need JavaScript enabled to view it. to support open access publication.
1 Introduction
As a typical barred spiral galaxy, the Galactic disk is one of the most prominent components of the Milky Way (MW; Binney & Merrifield 1998; Bland-Hawthorn & Gerhard 2016). In the canonical picture of disk assembly, the MW is believed to follow an inside-out growth, with gas accretion and star formation proceeding more rapidly at small galactocentric radii (R) and on longer timescales in its outskirts (Chiappini & Gratton 1997; Chiappini et al. 2001). This process naturally leads to a negative radial metallicity gradient, which has been confirmed by large spectroscopic surveys. Based on APOGEE data, Katz et al. (2021) found that the thin disk follows an inside-out formation up to about 10–12 kpc, while Frankel et al. (2019) quantified this process for the low-α stellar disk within 13 kpc. Nevertheless, beyond this radius, the metallicity gradient appears to flatten, and the origin of the outer disk remains under debate.
Using 70 000 red clump stars from the LAMOST survey, Huang et al. (2015) found that in the solar vicinity (7 < R < 11.5 kpc), the radial metallicity gradient is moderately steep, whereas in the outer disk (11.5 < R < 14 kpc) it becomes much more gradual. Chen et al. (2024) also mentioned that open clusters reveal a decreasing metallicity gradient in the inner disk (R < 12 kpc) that flattens outwards. By further studying the R − Vϕ diagram, Chen et al. (2024) found that the slope of the ridges changes at R ~ 11.5 kpc; combined with the reversal of the trend in the Rg–Vϕ plane, this could be interpreted as a transition between the inner and outer disks. It has long been recognized that a transition region exists between the inner and outer thin disks (e.g. Zhang et al. 2021; Spina et al. 2022; Das et al. 2024; Tian et al. 2024).
The theoretical interpretations in kinematic wave mechanics for stellar disks stem from the quasi-stationary density wave theory, which proposes that spiral arms are wave patterns that rotate rigidly (Lin & Shu 1966). On the other hand, the swing amplification, proposed by Julian & Toomre (1966) (see also Toomre 1977, 1981), shows how transient disturbances in a differentially rotating disk could be massively amplified into prominent spiral features as they were sheared by background rotation. The wave propagation in the stellar disk and the possible mechanisms that persist the wave pattern were discussed in Toomre (1969). A crucial insight into wave maintenance was provided by Lynden-Bell & Kalnajs (1972), who demonstrated the vital role of angular momentum transfer between waves, showing how a negative angular momentum wave inside the co-rotation radius could couple with and amplify a positive angular momentum wave outside it.
The progress in observational facilities has made significant improvements over the last few decades, including ground-based spectroscopic surveys (York et al. 2000; Steinmetz et al. 2006; Yanny et al. 2009; Zhao et al. 2012; Majewski et al. 2017) and space astrometric telescopes (ESA 1997; Gaia Collaboration 2016), which have helped elucidate the large-scale wave structures in the Galactic disk. Two apparent rings of stars were discovered in the anti-center direction: the Monoceros ring (Newberg et al. 2002; Yanny et al. 2003) and the Triangulum Andromeda stream, which lies at larger galactocentric radii (Majewski et al. 2004; Martin et al. 2007). Using SDSS data, Xu et al. (2015) detected asymmetry in the number counts of main-sequence stars, showing asymmetric wave patterns above and below the Galactic plane. Prominent wave-like features in both the R–vz and Rg–vz planes were discovered using Gaia TGAS data by Schönrich & Dehnen (2018). Similar wave-like structures are also seen in the R–vz plane (Kawata et al. 2018; Gaia Collaboration 2021), the Rg–vz plane (Friske & Schönrich 2019; Antoja et al. 2022), and the stellar energy distribution (Khanna et al. 2019). More recently, Poggio et al. (2025) presented strong observational evidence for a massive, non-axisymmetric vertical wave propagating radially outwards through the Galactic disk.
In addition to the waves in the Euclidean space, the Gaia spiral (Antoja et al. 2018), which is a non-axisymmetric structure in the phase space, indicates that the Galactic disk is out-of-equilibrium by a recent perturber. The structure includes one-armed (Binney & Schönrich 2018; Khanna et al. 2019; Frankel et al. 2025) and two-armed (Hunt et al. 2022) phase spirals. The one-armed spiral is widely thought to result from the interactions between the MW and the Sagittarius dwarf galaxy (Sgr hereafter) (Binney & Schönrich 2018; Laporte et al. 2019; Bland-Hawthorn & Tepper-Garcia 2021), while the two-armed spirals probably result from internal perturbations such as the Galactic bar (Banik et al. 2022; Li et al. 2023; Chiba et al. 2025). The Gaia spiral results from perturbations to the Galactic disk, similar to those producing corrugations. However, the relation between the corrugation and the Gaia spiral remains unclear.
Several key questions remain open in this research field, including whether multiple corrugations exist in the disk, whether the disk corrugations include both ![Mathematical equation: $\[R{-}\overline{V}_{z}\]$](/articles/aa/full_html/2026/05/aa58569-25/aa58569-25-eq1.png) and
and ![Mathematical equation: $\[R{-}\overline{V}_{R}\]$](/articles/aa/full_html/2026/05/aa58569-25/aa58569-25-eq2.png) patterns, how these two patterns are related, what the origins of the corrugations are, and how the corrugations are related to the warp and the Gaia phase spirals. In this paper, we investigate the multiplicity and the
patterns, how these two patterns are related, what the origins of the corrugations are, and how the corrugations are related to the warp and the Gaia phase spirals. In this paper, we investigate the multiplicity and the ![Mathematical equation: $\[R{-}\overline{V}_{R}\]$](/articles/aa/full_html/2026/05/aa58569-25/aa58569-25-eq3.png) pattern of the corrugations. This paper is organized as follows. Section 2 describes the two datasets adopted in this study and outlines the procedure used to select the disk samples. In Section 3, we present the transition features between the inner and outer Galactic disks, based on multiple kinematic and chemical diagnostics. In Section 4, we explore a dynamical interpretation of the observational features in terms of multiple disk corrugations across the Galactic disk. Finally, we summarize the results of this study in Section 5.
pattern of the corrugations. This paper is organized as follows. Section 2 describes the two datasets adopted in this study and outlines the procedure used to select the disk samples. In Section 3, we present the transition features between the inner and outer Galactic disks, based on multiple kinematic and chemical diagnostics. In Section 4, we explore a dynamical interpretation of the observational features in terms of multiple disk corrugations across the Galactic disk. Finally, we summarize the results of this study in Section 5.
2 Data
We constructed two stellar samples based on LAMOST DR8 and Gaia DR3 data. The LAMOST sample follows the selection in Chen et al. (2024), targeting thin-disk stars with [Fe/H] > −0.8 dex and [Mg/Fe] < −0.1 × [Fe/H] + 0.12 dex. Elemental abundances were taken from Li et al. (2022) catalogue, derived via a neural network (NN) trained on LAMOST DR8 and APOGEE DR17 (Luo et al. 2015; Zhao et al. 2012; Accetta et al. 2022). We retained stars with abundance uncertainties below 0.1 dex. Astrometric parameters (right ascension, declination, and proper motions) were obtained from Gaia DR3 (Gaia Collaboration 2016, 2023), adopting a re-normalized unit weight error (RUWE) < 1.4 to ensure reliable solutions (Lindegren et al. 2021). Radial velocities were taken from the LAMOST DR8 catalogue, with uncertainties <10 km s−1. Distances were adopted from the Anders et al. (2022) catalogue, derived using the StarHorse code (Queiroz et al. 2020), and we restricted the relative distance uncertainty to be below 30%. To further guarantee the purity of the thin-disk population, we imposed an additional kinematic criterion of Vϕ > 120 km s−1.
As a supplement and for cross-validation, we also constructed a Gaia sample using the selection of Li et al. (2024). Specifically, we included stars in Gaia DR3 with available photo-astrometric distances and radial velocities (Anders et al. 2022; Gaia Collaboration 2023). The same restrictions on RUWE and relative distance uncertainty were applied as in the LAMOST sample, while the radial velocity uncertainty was limited to <20 km s−1. As discussed in Li et al. (2024), the distances of a small number of stars located behind the Galactic centre (GC) and close to the Galactic plane may be systematically overestimated due to extinction effects. To mitigate this bias, we excluded stars within the region defined by x > 0 kpc, z > −3 kpc, rgc > 6 kpc, and −50° < l < 50°, −10° < b < 15°, where rgc, l, and b denote the galactocentric distance, Galactic longitude, and Galactic latitude, respectively.
Li et al. (2024) developed an NN classifier to distinguish between in situ and ex situ stellar populations. Its output is a continuous probability ranging from 0 to 1, with values close to 0 corresponding to in situ stars and values near 1 indicating ex situ stars. Based on comparisons between test particle simulations and observational data, Li et al. (2025) demonstrated that stars with predicted probabilities below 0.1 are predominantly thin-disk members. Following this method, we used the same classification threshold to initially select thin-disk candidates. In the second stage, we further refined the sample using the atmospheric parameters provided by Gaia DR3 (Gaia Collaboration 2023). We required the uncertainties of [Fe/H] and log g to be less than 0.1 dex, and then selected stars with [Fe/H] > −0.8 dex and log g < 4.0. Finally, we applied the same Vϕ criterion as in the LAMOST sample.
When deriving the kinematic parameters for both samples, we adopted a circular speed at a solar radius of 232.8 km s−1 and a solar galactocentric distance of 8.2 kpc (McMillan 2017). The distance from the Sun to the Galactic plane was taken as 20.8 pc (Bennett & Bovy 2019). For the solar peculiar motion, we adopted the value reported by Schönrich et al. (2010), yielding (U, V, W) = (11.1, 12.24, 7.25) km s−1.
After applying all selection criteria, the final LAMOST sample contains 516 261 thin-disk stars, while the Gaia sample contains 7 306 868 thin-disk stars. In Fig. A.1, we show the spatial distribution of our sample. As we applied different selection criteria to the two samples, and since they are inherently affected by distinct selection effects and observational strategies, the two distributions exhibit noticeable differences. The Gaia sample has a much broader spatial coverage, whereas the LAMOST sample mainly extends towards the outer disk. Nevertheless, we expect the phenomenon identified in this study to appear consistently in both datasets, thereby reinforcing its physical reality.
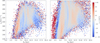 |
Fig. 1 Velocity waves in the Rg–Vϕ–VR plane, following Chen et al. (2024). The LAMOST sample (left panel) and the Gaia sample (right panel) exhibit good consistency, both showing a clear transition at Rg ~ 13.5 kpc. |
3 Transition features between the inner and outer disks
One of the main phenomena discovered by Chen et al. (2024) is the presence of velocity waves in the Rg–Vϕ plane colour-coded by VR, where VR varies alternately with Rg. As shown in Fig. 1, we reproduced this wave-like pattern using our LAMOST sample and identified a comparable structure in the Gaia data. For stars belonging to the inner part of the Galactic disk, the mean radial velocity changes direction rapidly with increasing Rg. Although the detailed morphology of the two samples differs slightly, both display the same overall trend. In the outer part, however, the oscillation appears to vanish, giving way to a coherent inward motion in both datasets. This behaviour suggests a possible transition near Rg ~ 13.5 kpc, separating the two kinematic regimes of the thin disk.
To further investigate this transition, we examined the overall trend of rotational velocity as a function of Rg. We divided the data into bins in Rg and analysed the variation of the mean rotational velocity across these intervals. As shown in Fig. 2, the LAMOST sample exhibits an increase in rotational velocity followed by a decline, with a distinct transition near Rg ~ 13.5 kpc. The outer disk region of the LAMOST sample primarily covers Galactic longitudes between 100° and 240°. To ensure a comparable spatial coverage, we applied a similar restriction to the Gaia sample in this figure, selecting stars in the second and third Galactic quadrants (90° < l < 270°). Although the absolute values of Vϕ differ between the two samples, reflecting differences in sample definition and observational characteristics, we note that the longitude restriction applied to the Gaia sample is limited to the outer disk stars, and therefore the overall spatial distributions of the two samples remain substantially different. Nevertheless, both datasets consistently show a change in the Vϕ − Rg trend around Rg ~ 13.5 kpc.
This change in azimuthal velocity is not independent of the radial velocity pattern discussed above. In a non-equilibrium disk, coherent large-scale radial motions can lead to a redistribution of stars in phase space, such that the relative contributions of stars on different orbital phases vary systematically with radius. When averaged over radius, this non-equilibrium phase-space sampling can give rise to systematic variations in the mean azimuthal velocity. In this sense, the observed behaviour of Vϕ provides a complementary kinematic signature that is consistent with the presence of a large-scale radial response of the disk, traced more directly by the oscillatory pattern in VR. Accordingly, the inner and outer disk separated by the transition radius could be described as two kinematic regimes, reflecting different radial manifestations of the same non-equilibrium response of the disk.
The metallicity of the MW disk tends to decrease with R, providing evidence for the inside-out formation pattern of the MW disk. We find the metallicity changes similarly with Rg. The LAMOST dataset provides a good estimation of metallicity. Gaia provides large amounts of metallicity data, which is very suitable for source selection after quality restrictions are imposed. However, it may not be very suitable for studying metallicity gradients (e.g. Andrae et al. 2023). Hence, we used the LAMOST sample alone to perform a supplementary analysis.
In the upper panel of Fig. 3, we show the variation of metallicity as a function of Rg. The trend resembles the radial metallicity gradient, displaying an overall negative slope that is steeper in the inner disk but becomes flatter in the outer region, with a transition near Rg ~ 13.5 kpc. The lower panel illustrates an inflection in the rotational velocity, occurring at metallicities between −0.60 and −0.33 dex. This metallicity range corresponds to the interval around Rg ~ 13.5 kpc in the upper panel. Such consistency suggests that the change in the radial metallicity trend occurs over the same radial range as the kinematic transition identified in Fig. 2.
Taken together, these observational diagnostics reveal a coherent change in the properties of the thin disk around Rg ~ 13.5 kpc. The wave-like behaviour of the mean radial velocity in Fig. 1 provides a prominent kinematical signature of this transition, while the corresponding changes in rotational velocity and metallicity demonstrate that this feature is also imprinted in additional observable dimensions of the disk. The prominence of the radial velocity oscillations naturally points to radial dynamical processes, prompting the question of what mechanism could generate such a pattern. This consideration motivates an exploration of whether a simple radial corrugation can reproduce the observed behaviour.
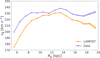 |
Fig. 2 Variation of rotational velocity with guiding radius. Each dot represents the arithmetic mean value within the corresponding bin, and the shaded area denotes the error of the mean. Data from LAMOST and Gaia are shown in orange and purple, respectively. |
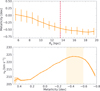 |
Fig. 3 Upper panel: mean metallicity of the LAMOST sample as a function of guiding radius. Each point indicates the arithmetic mean within the corresponding bin, with the shaded region showing the uncertainty of the mean. The error bars denote the 1σ dispersion of the data in each bin. Lower panel: rotational velocity as a function of metallicity for the LAMOST sample. The vertical shaded band marks the metallicity dispersion at Rg ~ 13.5 kpc. |
4 Multiple corrugations across the disk
The observational results presented in Sect. 3 highlight the strong radial velocity oscillations that accompany the transition between the inner and outer regions of the Galactic thin disk. In this section, we investigate whether these oscillations can be interpreted within a corrugation framework. We adopt a simplified description in which the disk experiences large-scale radial displacements that vary coherently with position, producing characteristic patterns in the mean radial velocity field. The goal of this model is not to reproduce all observational trends discussed earlier, but rather to assess whether corrugations can account for the wave-like behaviour of mean radial velocity and provide a plausible dynamical ingredient relevant to the emergence of the inner-outer disk transition.
4.1 The corrugations in the Galactic disk
Chen et al. (2024) reported a group of stars moving inwards (the G1 group), which corresponds to the stellar component with Rg greater than 13.5 kpc in Fig. 1. In addition, by analysing the kinematics of two samples of young disk stars, Poggio et al. (2025) identified an outward-propagating vertical corrugation. These findings, together with our results, suggest that the transition between the inner and outer disks identified here may be related to the same underlying phenomenon revealed in previous studies, i.e. the propagation and superposition of the corrugations.
Inspired by Poggio et al. (2025), we constructed a corrugation model to interpret our observational results. While their formulation concentrates on vertical perturbations, our modelling focuses on the radial oscillations, since the initial signatures are traced by VR. Moreover, our model includes two waves propagating in opposite directions:
![Mathematical equation: $\[\xi_{R, \text {tot}}(R, t)=\xi_{R, \text {out}}(R, t)+\xi_{R, \text {in}}(R, t).\]$](/articles/aa/full_html/2026/05/aa58569-25/aa58569-25-eq4.png) (1)
(1)
Here, ξR,tot(R, t) describes the radial displacement of a star relative to its initial position. Each component in Eq. (1) follows the same functional form, which we denote generically by
![Mathematical equation: $\[\xi_R(R, t)=A_C ~D_C(R) ~\sin \left[\frac{2 \pi}{\lambda_C}\left(R-R_0-v_C t\right)\right],\]$](/articles/aa/full_html/2026/05/aa58569-25/aa58569-25-eq5.png) (2)
(2)
where AC is the amplitude of the corrugation, and DC(R) is a radial damping factor, defined as
![Mathematical equation: $\[D_C(R) \equiv \exp \left[-\frac{\left|R-R_0\right|}{L_C}\right],\]$](/articles/aa/full_html/2026/05/aa58569-25/aa58569-25-eq6.png) (3)
(3)
with LC being the radial damping length. The parameter λC denotes the wavelength of the radial oscillation, R0 is the radial offset with respect to the GC, and t is the time. The propagation velocity vC is positive for an outward-propagating wave and negative for an inward-propagating one. In this toy model, we neglected any temporal and spatial variations of vC and λC − i.e. their dependence on time t and galactocentric coordinates (R, φ) − in order to keep the model sufficiently simple for parameter fitting.
Correspondingly, the radial velocity was obtained by differentiating Eq. (2) with respect to time:
![Mathematical equation: $\[V_R(R, t)=-A_C ~D_C(R)\left(\frac{2 \pi v_C}{\lambda_C}\right) \cos \left[\frac{2 \pi}{\lambda_C}\left(R-R_0-v_C t\right)\right].\]$](/articles/aa/full_html/2026/05/aa58569-25/aa58569-25-eq7.png) (4)
(4)
The radial displacement itself is difficult to trace observationally, whereas the corresponding oscillation in the radial velocity can be directly measured in both the LAMOST and Gaia samples. To avoid introducing additional model-dependent assumptions about the Galactic disk, we determined the parameters of the corrugation pattern empirically by fitting the observed radial velocity data.
Specifically, we binned the thin-disk sample in galactocentric radius R over the range 5 ≤ R ≤ 20 kpc into 50 equal-width bins. In each bin, the mean radial velocity was computed to form a data point in the radial velocity profile. The corrugation model in Eq. (4) was then fitted to this binned profile using a bounded non-linear least-squares algorithm.
The upper panel of Fig. 4 shows the fitted radial corrugation pattern and its associated radial velocity. At the snapshot of t=0, we applied the fitting procedure to the Gaia sample and derived the corresponding radial displacement. The Gaia sequence provides a clean and well-defined trend that makes it well suited for illustrating the modelling procedure. In principle, the same method can be applied to other datasets such as LAMOST, although the Gaia data yield a more stable fit for demonstration purposes. For comparison, we illustrate the behaviour of a single wave model in the lower panel of Fig. 4, which demonstrates that a single wave is insufficient to reproduce the observed VR(R) pattern. The best-fitting parameters of the double wave model are listed in Table 1.
In Fig. 1, the radial velocity exhibits a periodic variation with guiding radius Rg. A similar oscillation is visible in Fig. 4, but with a lower frequency and amplitude. This reduction arises because stars with different guiding radii contribute to the same radial position R, leading to spatial averaging that smooths the signal. Even after this smoothing, the model retains a reversal in the sign of VR around 13–14 kpc, matching the location of the transition identified in the observations. The associated radial displacement, shown by the blue curve, reveals systematic outward and inward shifts whose peaks and troughs mark where the corrugation is most pronounced. These coherent radial motions illustrate how a large-scale corrugation can generate the wave-like behaviour of VR. When combined with the underlying density structure of the Galactic disk, such corrugations may contribute to shaping the large-scale features associated with the emergence of the inner-outer disk transition described in Sect. 3.
Our analysis offers an alternative interpretation in line with the findings of Poggio et al. (2025), although a full quantitative framework will require dedicated dynamical modelling. Identifying the physical drivers of the inward- and outward-propagating modes remains an open challenge. Nevertheless, the transition between the inner and outer parts of the disk revealed in this work stands out as a genuine structural signature of the MW. Understanding its origin will provide a key benchmark for future models of the Galaxy’s dynamical evolution.
Best-fitting parameters of the inward and outward corrugation modes.
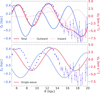 |
Fig. 4 Corrugation model fitted to the Gaia sample. Upper panel: best-fitting double-wave model. The purple points show the mean radial velocity in each radial bin, with error bars indicating the uncertainty of the mean. The red curve represents the best-fitting VR pattern. The inferred radial displacement ξR(R) is shown in blue. Lower panel: same as the upper panel, but using a single-wave model, which fails to reproduce the full structure of the observed VR pattern. |
4.2 Validation of the radial corrugation model with N-body simulations
To assess whether such a corrugation can arise in a realistic dynamical environment, we further examined an N-body simulation of a MW-like disk. The details of the settings and methods of the N-body experiment are shown in Appendix B.
We successfully reproduced radial velocity oscillation as a function of galactocentric radius in the N-body simulation. Fig. 5 shows the velocity wave in the R − Vϕ plane colour-coded by VR using the N-body simulations. We chose the snapshot at T = 4.4 Gyr both in this plot and in Fig. 6. The wave-like pattern is clearly seen both in the inner and outer disk. This snapshot does not represent the present-day properties of the MW disk, as both the amplitude and wavelength differ from those inferred from the observations. We chose this snapshot because it exhibits a clear large-scale kinematic pattern that is qualitatively consistent with the superposition of two oppositely propagating wave components, providing a useful phenomenological illustration for the interpretation of the observational results. As shown in Fig. 6, the simulated sample exhibits a clear periodic variation with R, closely resembling the behaviour identified in the Gaia data. Following the same procedure adopted for the observational sample, we directly fitted the simulated VR distribution with the model in Eq. (4).
The best-fitting parameters are listed in Table 2. The amplitudes recovered from the simulation are slightly smaller than those inferred from the observations. The simulation also tends to favour larger damping lengths and smaller propagation velocities, although these parameters remain only weakly constrained in the toy-model fit. These discrepancies may reflect the simplified nature of the model as well as the differences between the simulated MW–Sgr interaction and the real Galaxy.
Importantly, despite these quantitative differences, both the simulations and the observations display comparable periodic variation in galactocentric radius and radial velocity, and the overall pattern of oscillation is broadly similar. As discussed above, our aim here is not to establish a detailed quantitative model, but rather to provide an intuitive dynamical demonstration of the plausibility of such a corrugation pattern. In this sense, the fitted parameters should be regarded primarily as an effective characterization of the overall wave pattern, rather than as precise physical measurements. Taken together, these results suggest that the superposition of an inward- and an outward-propagating wave, as encoded in our corrugation model, can provide a plausible phenomenological description of the transition identified in Sect. 3.
Best-fitting parameters of the inward and outward corrugation modes in simulation.
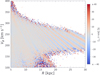 |
Fig. 5 Velocity waves in the R–Vϕ plane colour-coded by |
![Mathematical equation: $\[\overline{V}_{R}\]$](/articles/aa/full_html/2026/05/aa58569-25/aa58569-25-eq8.png)
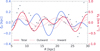 |
Fig. 6 Corrugation model fitted to the simulated sample at T = 4.4 Gyr. The grey points show the median radial velocity in each radial bin. The red curve represents the best-fitting VR pattern, and the blue curve shows the corresponding inferred radial displacement ξR, both plotted as functions of the galactocentric radius R. |
5 Conclusion
In this work, we carried out a comprehensive investigation of the dual structure of the Galactic thin disk using large stellar samples from LAMOST DR8 and Gaia DR3. By jointly analysing spatial, kinematic, and chemical information, we identified a clear transition between the inner and outer disks. First, we reproduced the wave-like pattern in the Rg–Vϕ plane colour-coded by VR reported by Chen et al. (2024) and found a consistent transition at Rg ~ 13.5 kpc in both datasets. This boundary is also imprinted in the Vϕ − Rg relation, where the trend of the rotational velocity changes near Rg ~ 13.5 kpc. Furthermore, Fig. 3 shows that this transition is accompanied by a change in metallicity, indicating that it is not purely kinematic. Taken together, these observational signatures delineate a robust boundary separating the disk into two distinct kinematic regimes, corresponding to the inner and outer disk.
To provide physical insight, we constructed a simplified corrugation model and performed N-body simulations. Building upon the framework of Poggio et al. (2025), our model incorporates two waves propagating in opposite directions. This formulation can be fitted to the observational data and applies equally well to the simulated sample. Both the observed and simulated disks exhibit coherent periodic variations in radial velocity and galactocentric radius, suggesting that the identified transition may be understood as part of a large-scale dynamical response of the disk. As discussed in Sect. 4.1, such a corrugation could naturally produce a transition between inner and outer disk behaviours. Although not intended as a quantitative model, it provides an intuitive demonstration and offers a plausible interpretation of the observed features.
Overall, our results highlight the complex nature of the MW disk and reinforce the emerging view that its large-scale kinematic substructures are shaped by multiple time-dependent perturbations. The Galactic bar or possible external influences may contribute to the observed features. Future high-resolution spectroscopic surveys–particularly DESI and PFS–will provide crucial constraints on the chemical and kinematic signatures across the transition radius, enabling a more complete dynamical understanding of the Galactic disk.
Acknowledgements
This study is supported by the National Natural Science Foundation of China under grant Nos. 12588202 and 12373020, National Key Research and Development Program of China under grant Nos. 2024YFA1611902 and 2023YFE0107800. CL is supported by the Fundamental Research Funds for the Central Universities under grant No. KG202502. C.Y. acknowledges the support from the National Natural Science Foundation of China under grant No. 12403025. We have made use of data from the European Space Agency (ESA) mission Gaia (https://www.cosmos.esa.int/gaia), processed by the Gaia Data Processing and Analysis Consortium (DPAC, https://www.cosmos.esa.int/web/gaia/dpac/consortium). Funding for the DPAC has been provided by national institutions, in particular the institutions participating in the Gaia Multilateral Agreement. This work also made use of data products from the Guo Shoujing Telescope (the Large Sky Area Multi-Object Fiber Spectroscopic Telescope, LAMOST). LAMOST is a National Major Scientific Project built by the Chinese Academy of Sciences. Funding for the project has been provided by the National Development and Reform Commission. LAMOST is operated and managed by the National Astronomical Observatories, Chinese Academy of Sciences.
References
- Ablimit, I., Zhao, G., Flynn, C., & Bird, S. A. 2020, ApJ, 895, L12 [Google Scholar]
- Accetta, K., Aerts, C., Aguirre, V. S., et al. 2022, ApJS, 259, 35 [NASA ADS] [CrossRef] [Google Scholar]
- Anders, F., Khalatyan, A., Queiroz, A. B. d. A., et al. 2022, A&A, 658, A91 [NASA ADS] [CrossRef] [EDP Sciences] [Google Scholar]
- Andrae, R., Fouesneau, M., Sordo, R., et al. 2023, A&A, 674, A27 [CrossRef] [EDP Sciences] [Google Scholar]
- Antoja, T., Helmi, A., Romero-Gómez, M., et al. 2018, Nat, 561, 360 [Google Scholar]
- Antoja, T., Ramos, P., López-Guitart, F., et al. 2022, A&A, 668, A61 [NASA ADS] [CrossRef] [EDP Sciences] [Google Scholar]
- Banik, U., Weinberg, M. D., & van den Bosch, F. C. 2022, ApJ, 935, 135 [NASA ADS] [CrossRef] [Google Scholar]
- Bennett, M., & Bovy, J. 2019, MNRAS, 482, 1417 [NASA ADS] [CrossRef] [Google Scholar]
- Binney, J. 2014, MNRAS, 440, 787 [Google Scholar]
- Binney, J., & Merrifield, M. 1998, Galactic astronomy (Princeton, NJ: Princeton University Press) [Google Scholar]
- Binney, J., & Schönrich, R. 2018, MNRAS, 481, 1501 [Google Scholar]
- Binney, J., & Tremaine, S. 2008, Galactic Dynamics, 2nd edn. [Google Scholar]
- Binney, J., & Vasiliev, E. 2023, MNRAS, 520, 1832 [NASA ADS] [CrossRef] [Google Scholar]
- Binney, J., & Vasiliev, E. 2024, MNRAS, 527, 1915 [Google Scholar]
- Bland-Hawthorn, J., & Gerhard, O. 2016, ARA&A, 54, 529 [Google Scholar]
- Bland-Hawthorn, J., & Tepper-García, T. 2021, MNRAS, 504, 3168 [CrossRef] [Google Scholar]
- Chandrasekhar, S. 1943, ApJ, 97, 255 [Google Scholar]
- Chen, Y., Zhao, G., Wu, W., et al. 2024, ApJ, 961, L4 [Google Scholar]
- Chiappini, C., & Gratton, R. 1997, ApJ, 477, 765 [NASA ADS] [CrossRef] [Google Scholar]
- Chiappini, C., Matteucci, F., & Romano, D. 2001, ApJ, 554, 1044 [NASA ADS] [CrossRef] [Google Scholar]
- Chiba, R., Frankel, N., & Hamilton, C. 2025, MNRAS, 543, 2159 [Google Scholar]
- Das, P., Huang, Y., Ciucă, I., & Fragkoudi, F. 2024, MNRAS, 527, 4505 [Google Scholar]
- Eilers, A.-C., Hogg, D. W., Rix, H.-W., & Ness, M. K. 2019, ApJ, 871, 120 [Google Scholar]
- ESA, 1997, ESA Special Publication, 1200, The HIPPARCOS and TYCHO catalogues. Astrometric and photometric star catalogues derived from the ESA HIPPARCOS Space Astrometry Mission [Google Scholar]
- Frankel, N., Sanders, J., Rix, H.-W., Ting, Y.-S., & Ness, M. 2019, ApJ, 884, 99 [Google Scholar]
- Frankel, N., Hogg, D. W., Tremaine, S., Price-Whelan, A., & Shen, J. 2025, ApJ, 987, 81 [Google Scholar]
- Friske, J. K. S., & Schönrich, R. 2019, MNRAS, 490, 5414 [Google Scholar]
- Gaia Collaboration (Prusti, T., et al.) 2016, A&A, 595, A1 [NASA ADS] [CrossRef] [EDP Sciences] [Google Scholar]
- Gaia Collaboration (Antoja, T., et al.) 2021, A&A, 649, A8 [EDP Sciences] [Google Scholar]
- Gaia Collaboration (Vallenari, A., et al.) 2023, A&A, 674, A1 [NASA ADS] [CrossRef] [EDP Sciences] [Google Scholar]
- Huang, Y., Liu, X.-W., Zhang, H.-W., et al. 2015, Res. Astron. Astrophys., 15, 1240 [CrossRef] [Google Scholar]
- Hunt, J. A. S., Price-Whelan, A. M., Johnston, K. V., & Darragh-Ford, E. 2022, MNRAS, 516, L7 [NASA ADS] [CrossRef] [Google Scholar]
- Julian, W. H., & Toomre, A. 1966, ApJ, 146, 810 [NASA ADS] [CrossRef] [Google Scholar]
- Katz, D., Gómez, A., Haywood, M., Snaith, O., & Di Matteo, P. 2021, A&A, 655, A111 [NASA ADS] [CrossRef] [EDP Sciences] [Google Scholar]
- Kawata, D., Baba, J., Ciucă, I., et al. 2018, MNRAS, 479, L108 [CrossRef] [Google Scholar]
- Khanna, S., Sharma, S., Tepper-Garcia, T., et al. 2019, MNRAS, 489, 4962 [Google Scholar]
- Laporte, C. F. P., Minchev, I., Johnston, K. V., & Gómez, F. A. 2019, MNRAS, 485, 3134 [Google Scholar]
- Li, C., & Binney, J. 2022a, MNRAS, 510, 4706 [NASA ADS] [CrossRef] [Google Scholar]
- Li, C., & Binney, J. 2022b, MNRAS, 516, 3454 [NASA ADS] [CrossRef] [Google Scholar]
- Li, Z., Zhao, G., Chen, Y., Liang, X., & Zhao, J. 2022, MNRAS, 517, 4875 [NASA ADS] [CrossRef] [Google Scholar]
- Li, C., Siebert, A., Monari, G., Famaey, B., & Rozier, S. 2023, MNRAS, 524, 6331 [NASA ADS] [CrossRef] [Google Scholar]
- Li, Z., Zhao, G., Zhang, R., et al. 2024, MNRAS, 527, 9767 [Google Scholar]
- Li, Z., Li, C., Zhao, G., Zhang, R., & Xue, X.-X. 2025, ApJ, 988, 124 [Google Scholar]
- Lin, C. C., & Shu, F. H. 1966, Proc. Natl. Acad. Sci., 55, 229 [NASA ADS] [CrossRef] [Google Scholar]
- Lindegren, L., Bastian, U., Biermann, M., et al. 2021, A&A, 649, A4 [EDP Sciences] [Google Scholar]
- Luo, A.-L., Zhao, Y.-H., Zhao, G., et al. 2015, Res. Astron. Astrophys., 15, 1095 [Google Scholar]
- Lynden-Bell, D., & Kalnajs, A. J. 1972, MNRAS, 157, 1 [Google Scholar]
- Majewski, S. R., Ostheimer, J. C., Rocha-Pinto, H. J., et al. 2004, ApJ, 615, 738 [Google Scholar]
- Majewski, S. R., Schiavon, R. P., Frinchaboy, P. M., et al. 2017, AJ, 154, 94 [NASA ADS] [CrossRef] [Google Scholar]
- Martin, N. F., Ibata, R. A., & Irwin, M. 2007, ApJ, 668, L123 [Google Scholar]
- McMillan, P. J. 2017, MNRAS, 465, 76 [NASA ADS] [CrossRef] [Google Scholar]
- Moster, B. P., Macciò, A. V., & Somerville, R. S. 2014, MNRAS, 437, 1027 [Google Scholar]
- Newberg, H. J., Yanny, B., Rockosi, C., et al. 2002, ApJ, 569, 245 [Google Scholar]
- Poggio, E., Khanna, S., Drimmel, R., et al. 2025, A&A, 699, A199 [NASA ADS] [CrossRef] [EDP Sciences] [Google Scholar]
- Queiroz, A. B. A., Anders, F., Chiappini, C., et al. 2020, A&A, 638, A76 [NASA ADS] [CrossRef] [EDP Sciences] [Google Scholar]
- Reid, M., Menten, K., Brunthaler, A., et al. 2019, ApJ, 885, 131 [NASA ADS] [CrossRef] [Google Scholar]
- Schönrich, R., Binney, J., & Dehnen, W. 2010, MNRAS, 403, 1829 [NASA ADS] [CrossRef] [Google Scholar]
- Schönrich, R., & Dehnen, W. 2018, MNRAS, 478, 3809 [Google Scholar]
- Spina, L., Magrini, L., & Cunha, K. 2022, Universe, 8, 87 [NASA ADS] [CrossRef] [Google Scholar]
- Springel, V., Pakmor, R., Zier, O., & Reinecke, M. 2021, MNRAS, 506, 2871 [NASA ADS] [CrossRef] [Google Scholar]
- Steinmetz, M., Zwitter, T., Siebert, A., et al. 2006, AJ, 132, 1645 [Google Scholar]
- Tian, H., Liu, C., Li, J., & Zhang, B. 2024, MNRAS, 531, 1730 [Google Scholar]
- Toomre, A. 1969, ApJ, 158, 899 [NASA ADS] [CrossRef] [Google Scholar]
- Toomre, A. 1977, AnnRA&A, 15, 437 [Google Scholar]
- Toomre, A. 1981, in Structure and Evolution of Normal Galaxies, eds. S. M. Fall, & D. Lynden-Bell, 111 [Google Scholar]
- Vasiliev, E. 2019, MNRAS, 482, 1525 [Google Scholar]
- Vasiliev, E., Belokurov, V., & Erkal, D. 2021, MNRAS, 501, 2279 [NASA ADS] [CrossRef] [Google Scholar]
- Xu, Y., Newberg, H. J., Carlin, J. L., et al. 2015, ApJ, 801, 105 [Google Scholar]
- Yanny, B., Newberg, H. J., Grebel, E. K., et al. 2003, ApJ, 588, 824 [Google Scholar]
- Yanny, B., Rockosi, C., Newberg, H. J., et al. 2009, AJ, 137, 4377 [Google Scholar]
- York, D. G., Adelman, J., Anderson, Jr., J. E., et al. 2000, AJ, 120, 1579 [NASA ADS] [CrossRef] [Google Scholar]
- Zhang, H., Chen, Y., & Zhao, G. 2021, ApJ, 919, 52 [NASA ADS] [CrossRef] [Google Scholar]
- Zhao, G., Zhao, Y.-H., Chu, Y.-Q., Jing, Y.-P., & Deng, L.-C. 2012, Res. Astron. Astrophys., 12, 723 [NASA ADS] [CrossRef] [Google Scholar]
Appendix A Spatial distribution of the sample
As shown in Fig. A.1, our sample spatially overlaps with six spiral arms. The spiral arm loci are adopted from Reid et al. (2019), which are based on trigonometric parallax measurements of molecular masers.
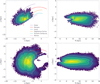 |
Fig. A.1 Spatial distribution of the disk sample from LAMOST (first row) and Gaia (second row). Number-density maps are shown in the x–y and R–z planes. Bins with fewer than five stars are omitted. The white contours indicate the regions enclosing 68%, 95%, and 99% of the stars. Spiral arm models from Reid et al. (2019) are overplotted in all panels. |
Appendix B N-body settings and methods
The particles used in the N-body simulations are generated by a more realistic MW model constructed by DFs via AGAMA package (Vasiliev 2019). In equilibrium, the DF can be taken as a function of the three action variables (JR, Jz, Jϕ), which are isolating integrals of the motion (Binney & Tremaine 2008), where JR quantifies the amplitude of radial excursions, Jz oscillations away from the Galactic plane, and Jϕ is the component of angular momentum parallel to the Galaxy’s assumed symmetry axis. Following the modelling work in Binney & Vasiliev (2023), an equilibrium MW model can be defined by a superposition of similar DFs. The DF of each Galactic component is a specified function f(J) of the action integrals.
In this model, the disk components have exponential DFs, which is physically reasonable throughout action space compared to quasi-isothermal DFs. A double power law DF is used to model the bulge, stellar and dark halo. The total gravitational potential of the MW is then derived from the DFs. The details of the descriptions of this MW axisymmetric model can be found in (Binney & Vasiliev 2023, 2024). The circular velocity generated from this axisymmetric potential is shown in the upper panel of Fig. B.1.
The spheroidal components in the MW are constructed using modified double power-law DFs exactly the same as those in Binney & Vasiliev (2023), including the bulge and the dark and stellar halos.
![Mathematical equation: $\[f(\mathbf{J})=\frac{M}{\left(2 \pi J_0\right)^3} \frac{\left(1+\left[J_0 / h_J\right]^\gamma\right)^{\alpha_{\text {in }} / \gamma}}{\left(1+\left[g_J / J_0\right]^\gamma\right)^{\alpha_{\text {out }} / \gamma}} e^{-\left(g_J / J_{c u t}\right)^\delta},\]$](/articles/aa/full_html/2026/05/aa58569-25/aa58569-25-eq9.png) (B.1)
(B.1)
The modifications of this model compared with Li & Binney (2022a) are the replacement of the linear combinations of g(J) and h(J), which endeavours to solve the unphysical behaviour velocity distributions at small |vϕ|. In this model, the g(J) and h(J) are:
![Mathematical equation: $\[g(\mathbf{J})=h(\mathbf{J})=J_R \mathrm{e}^{-\beta \sin (\mathrm{c} \pi / 2)}+\frac{1}{2}(1+\mathrm{c} \xi) \mathrm{e}^{\beta \sin (\mathrm{c} \pi / 2)} \mathcal{L},\]$](/articles/aa/full_html/2026/05/aa58569-25/aa58569-25-eq10.png) (B.2)
(B.2)
where
![Mathematical equation: $\[c \equiv \frac{L}{L+J_R},\]$](/articles/aa/full_html/2026/05/aa58569-25/aa58569-25-eq11.png) (B.3)
(B.3)
is the measurement of the orbital circularity and L = |Jϕ| + Jz is the angular momentum. The realization of the total angular momentum reads,
![Mathematical equation: $\[\mathcal{L}\left(J_z, J_\phi\right) \equiv \mathrm{aJ}_{\mathrm{z}}+\mathrm{b} \frac{\left|\mathrm{~J}_\phi\right| \mathrm{J}_{\mathrm{z}}}{\mathrm{~L}}+\left|\mathrm{J}_\phi\right|,\]$](/articles/aa/full_html/2026/05/aa58569-25/aa58569-25-eq12.png) (B.4)
(B.4)
where the constants a and b are chosen to ensure that the value of ![Mathematical equation: $\[\frac{\partial \mathcal{L}}{\partial v_{\phi}}\]$](/articles/aa/full_html/2026/05/aa58569-25/aa58569-25-eq13.png) vanishes at vϕ → 0, which deals with the unphysical behaviour at small |vϕ|. The constants a and b are determined by:
vanishes at vϕ → 0, which deals with the unphysical behaviour at small |vϕ|. The constants a and b are determined by:
![Mathematical equation: $\[a=\frac{1}{2}(k+1) \quad \text { and } \quad \mathrm{b}=\frac{1}{2}(\mathrm{k}-1),\]$](/articles/aa/full_html/2026/05/aa58569-25/aa58569-25-eq14.png) (B.5)
(B.5)
where the value of k is determined by
![Mathematical equation: $\[k(\xi)=(1-\xi) \mathrm{F}_{\mathrm{in}}+\xi \mathrm{F}_{\mathrm{out}}\]$](/articles/aa/full_html/2026/05/aa58569-25/aa58569-25-eq15.png) (B.6)
(B.6)
Fin and Fout are two constant numbers that listed in Table B.2 for the halo and bulge. The parameter ξ is another representative of the energy which is defined as
![Mathematical equation: $\[\xi \equiv \frac{j_t^\alpha}{j_t^\alpha+1},\]$](/articles/aa/full_html/2026/05/aa58569-25/aa58569-25-eq16.png) (B.7)
(B.7)
where α = 0.6 in our work and
![Mathematical equation: $\[j_t \equiv \frac{1.5 J_R+L}{L_0},\]$](/articles/aa/full_html/2026/05/aa58569-25/aa58569-25-eq17.png) (B.8)
(B.8)
where L0 is a scale action of L0 = 6J0. The last term in Equation B.1 measures the cutoff of the bulge and halo components, in which Jcut is the cutoff action and δ is the cutoff strength.
This disk model follows Binney & Vasiliev (2024), which adopted truncated exponential DF models for the disks as:
![Mathematical equation: $\[f(\mathbf{J})=f_\phi\left(J_\phi\right) f_r\left(J_R, J_\phi\right) f_z\left(J_z, J_\phi\right) f_{\mathrm{ext}}\left(J_\phi\right) f_{\mathrm{int}}\left(J_\phi\right).\]$](/articles/aa/full_html/2026/05/aa58569-25/aa58569-25-eq18.png) (B.9)
(B.9)
In this model, the function fr controls the velocity dispersions σR and σϕ near the Galactic plane. The function fz controls both the thickness of the disk and the velocity dispersion σz. The factor fϕ generates a roughly exponentially declining surface density Σ(R) ≃ exp(−R/Rd). The factor fext and fint truncates the disk at some outer and inner radius respectively. The young thin disk behaves taper exponential profile which owns a truncated radius in the inner disk following the work from Li & Binney (2022b). The high-α disk favours a sharpness density decline in large radii at about Jϕ ≈ 2000 km s−1 kpc. The factors fext and fint are:
![Mathematical equation: $\[\begin{aligned}& f_{\mathrm{int}}\left(J_\phi\right)=\frac{e^{2\left(J_\phi-J_{\mathrm{int}}\right) / D_{\mathrm{int}}}}{e^{2\left(J_\phi-J_{\mathrm{int}}\right) / D_{\mathrm{int}}}+1}, \\& f_{\mathrm{ext}}\left(J_\phi\right)=\frac{e^{-2\left(J_\phi-J_{\mathrm{ext}}\right) / D_{\mathrm{ext}}}}{e^{-2\left(J_\phi-J_{\mathrm{ext}}\right) / D_{\mathrm{ext}}}+1},\end{aligned}\]$](/articles/aa/full_html/2026/05/aa58569-25/aa58569-25-eq19.png) (B.10)
(B.10)
where the action Jint and Jext determines the characteristic radius of the central depression or outer cutoff. The parameters Dint and Dext controls the sharpness of the transitions. The function for fR(J) and fz(J) are
![Mathematical equation: $\[\begin{aligned}& f_{\mathrm{R}}(\mathbf{J})=\frac{1}{J_{\mathrm{R} 0}}\left(\frac{J_v}{J_{\phi 0}}\right)^{p_R} \exp \left[-\frac{1}{J_{\mathrm{R} 0}}\left(\frac{J_v}{J_{\phi 0}}\right)^{p_R} J_R\right], \\& f_{\mathrm{z}}(\mathbf{J})=\frac{1}{J_{\mathrm{z} 0}}\left(\frac{J_v}{J_{\phi 0}}\right)^{p_z} \exp \left[-\frac{1}{J_{\mathrm{z} 0}}\left(\frac{J_v}{J_{\phi 0}}\right)^{p_z} J_z\right],\end{aligned}\]$](/articles/aa/full_html/2026/05/aa58569-25/aa58569-25-eq20.png) (B.11)
(B.11)
where Jϕ0 is the action that correlates with the disk’s scale length and the action JR0 and Jz0 determine the velocity dispersions σR and σz. pR and pz control the velocity dispersion profile along the Galactic radial direction. Jv ≡ JR + Jz + Jϕ + Jv0, where Jv0 is a scale action that controls the velocity dispersion at small radii. The function form of Jϕ is
![Mathematical equation: $\[f_\phi(\mathbf{J})=\frac{\mathrm{M}}{(2 \pi)^3} \frac{J_d}{J_{\phi 0}^2} e^{-J_d / J_{\phi 0}},\]$](/articles/aa/full_html/2026/05/aa58569-25/aa58569-25-eq21.png) (B.12)
(B.12)
where Jd ≡ JR + Jz + Jϕ + Jd0, and Jd0 is a scale action that controls the surface density at small radii. The detailed description and the predictions of this model can be found in Binney & Vasiliev (2024). The DF parameters for the disk and spheroidal components are listed in Table B.1 and Table B.2 respectively. The orange curve in the left panel in Fig. B.1 shows the total circular velocity curve of the Galaxy derived by the DF model, the dashed blue and dotted curves denote the spheroidal and disk components respectively. The black and blue data points are the observational results based on Ceipheids (Ablimit et al. 2020) and red giants (Eilers et al. 2019) respectively. The middle and right panels of Fig. B.1 shows the spatial distribution of the initial disk particles, in x − z and y − z plane respectively. There are neither warp nor flare signatures in the initial disk.
The other preparation is the computing of the initial position and velocity for the Sgr. The initial position of the Sgr 2 Gyr ago is estimated by integrating backwards the current position and velocity of Sgr, given by xSgr,0 = {17.9, 2.6, −6.6} kpc and vSgr,0 = {239.5, −29.6, 213.5} km s−1 (Vasiliev et al. 2021), under the axisymmetric MW model, which is computed by the DF models through a self-consistently iterating procedure (Binney 2014). At 2 Gyr ago, the Sgr is modelled as a Plummer profile with a mass of 2 × 10⁹ M⊙ and a scale radius rs of 1.5 kpc. The dynamical friction experienced by the Sgr during the backward orbital integration is approximated using Chandrasekhar’s standard formula (Chandrasekhar 1943):
![Mathematical equation: $\[\begin{aligned}\mathbf{a}_{\mathrm{DF}}= & -4 \pi G^2 \rho_{\mathrm{MW}}\left(\mathbf{x}_{\mathrm{Sgr}}\right) M_{\mathrm{Sgr}} ~\ln~ \Lambda \\& \times \frac{\mathbf{v}_{\mathrm{Sgr}}}{\left|\mathbf{v}_{\mathrm{Sgr}}\right|^3}\left[\operatorname{erf}(X)-\frac{2 X}{\sqrt{\pi}} e^{-X^2}\right],\end{aligned}\]$](/articles/aa/full_html/2026/05/aa58569-25/aa58569-25-eq22.png) (B.13)
(B.13)
where ρMW(xSgr) denotes the density of the MW halo at the position of Sgr, and the Coulomb logarithm is fixed at ln Λ = 3 following Vasiliev et al. (2021). The parameter X is defined as ![Mathematical equation: $\[X=\frac{\left|\mathbf{v}_{\mathrm{Sg}}\right|}{\sqrt{2} \sigma_{\mathrm{MW}}}\]$](/articles/aa/full_html/2026/05/aa58569-25/aa58569-25-eq23.png) , where σMW is the local velocity dispersion of the MW halo (Vasiliev et al. 2021).
, where σMW is the local velocity dispersion of the MW halo (Vasiliev et al. 2021).
A constant mass-loss rate of 0.2% per 0.01 Gyr is adopted for Sgr, resulting in a cumulative mass loss of approximately 70% over 2 Gyr. The integrated initial position of Sgr 2 Gyr ago is listed in Table B.3.
The N-body simulations of TDH and Sgr were carried out using GADGET-4 (Springel et al. 2021). The initial conditions of particles for the MW components and Sgr were generated from their DF models using AGAMA.
The particle mass of each MW component and Sgr is determined by dividing the total mass of the component by the number of particles, with the resulting value rounded to the nearest integer. The particle numbers and masses for each component and Sgr are listed in Table B.4.
We adopt an empirical formula for the gravitational softening length, which depends solely on the particle mass (Moster et al. 2014):
![Mathematical equation: $\[\epsilon=32 \sqrt{\frac{M_p}{10^{10} M_{\odot}}},\]$](/articles/aa/full_html/2026/05/aa58569-25/aa58569-25-eq24.png) (B.14)
(B.14)
where Mp is the mass of an individual particle in solar masses.
Parameters used for the DF model of the disk components.
Parameters used for the spheroidal DF model of the bulge and halo.
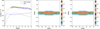 |
Fig. B.1 Circular velocity and distributions in x − z, and y − z plans of the initial disk particles. In the left panel, the orange curve shows the total circular velocity curve of the Galaxy derived by the DF model, the dashed blue and dotted curves denote the spheroidal and disk components respectively. The black and blue data points are the observational results based on Ceipheids (Ablimit et al. 2020) and red giants (Eilers et al. 2019) respectively. The middle and right panels show the spatial distribution of the initial disk particles, in x − z and y − z plane respectively. |
Initial phase space coordinates of the Sgr dwarf galaxy in the N-body simulation.
Particle numbers and particle masses for each component used in the N-body simulations.
All Tables
Best-fitting parameters of the inward and outward corrugation modes in simulation.
Initial phase space coordinates of the Sgr dwarf galaxy in the N-body simulation.
Particle numbers and particle masses for each component used in the N-body simulations.
All Figures
|
Fig. 1 Velocity waves in the Rg–Vϕ–VR plane, following Chen et al. (2024). The LAMOST sample (left panel) and the Gaia sample (right panel) exhibit good consistency, both showing a clear transition at Rg ~ 13.5 kpc. |
| In the text | |
|
Fig. 2 Variation of rotational velocity with guiding radius. Each dot represents the arithmetic mean value within the corresponding bin, and the shaded area denotes the error of the mean. Data from LAMOST and Gaia are shown in orange and purple, respectively. |
| In the text | |
|
Fig. 3 Upper panel: mean metallicity of the LAMOST sample as a function of guiding radius. Each point indicates the arithmetic mean within the corresponding bin, with the shaded region showing the uncertainty of the mean. The error bars denote the 1σ dispersion of the data in each bin. Lower panel: rotational velocity as a function of metallicity for the LAMOST sample. The vertical shaded band marks the metallicity dispersion at Rg ~ 13.5 kpc. |
| In the text | |
|
Fig. 4 Corrugation model fitted to the Gaia sample. Upper panel: best-fitting double-wave model. The purple points show the mean radial velocity in each radial bin, with error bars indicating the uncertainty of the mean. The red curve represents the best-fitting VR pattern. The inferred radial displacement ξR(R) is shown in blue. Lower panel: same as the upper panel, but using a single-wave model, which fails to reproduce the full structure of the observed VR pattern. |
| In the text | |
|
Fig. 5 Velocity waves in the R–Vϕ plane colour-coded by |
| In the text | |
|
Fig. 6 Corrugation model fitted to the simulated sample at T = 4.4 Gyr. The grey points show the median radial velocity in each radial bin. The red curve represents the best-fitting VR pattern, and the blue curve shows the corresponding inferred radial displacement ξR, both plotted as functions of the galactocentric radius R. |
| In the text | |
|
Fig. A.1 Spatial distribution of the disk sample from LAMOST (first row) and Gaia (second row). Number-density maps are shown in the x–y and R–z planes. Bins with fewer than five stars are omitted. The white contours indicate the regions enclosing 68%, 95%, and 99% of the stars. Spiral arm models from Reid et al. (2019) are overplotted in all panels. |
| In the text | |
|
Fig. B.1 Circular velocity and distributions in x − z, and y − z plans of the initial disk particles. In the left panel, the orange curve shows the total circular velocity curve of the Galaxy derived by the DF model, the dashed blue and dotted curves denote the spheroidal and disk components respectively. The black and blue data points are the observational results based on Ceipheids (Ablimit et al. 2020) and red giants (Eilers et al. 2019) respectively. The middle and right panels show the spatial distribution of the initial disk particles, in x − z and y − z plane respectively. |
| In the text | |
Current usage metrics show cumulative count of Article Views (full-text article views including HTML views, PDF and ePub downloads, according to the available data) and Abstracts Views on Vision4Press platform.
Data correspond to usage on the plateform after 2015. The current usage metrics is available 48-96 hours after online publication and is updated daily on week days.
Initial download of the metrics may take a while.