Fig. B.1
Download original image
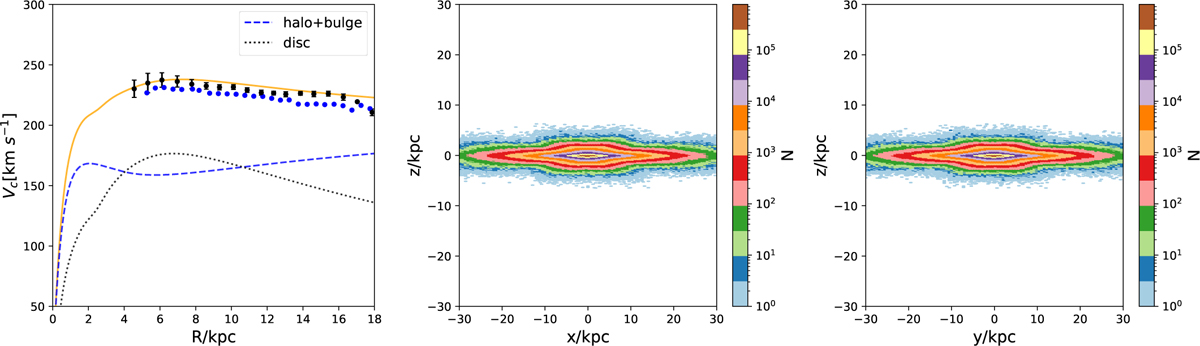
Circular velocity and distributions in x − z, and y − z plans of the initial disk particles. In the left panel, the orange curve shows the total circular velocity curve of the Galaxy derived by the DF model, the dashed blue and dotted curves denote the spheroidal and disk components respectively. The black and blue data points are the observational results based on Ceipheids (Ablimit et al. 2020) and red giants (Eilers et al. 2019) respectively. The middle and right panels show the spatial distribution of the initial disk particles, in x − z and y − z plane respectively.
Current usage metrics show cumulative count of Article Views (full-text article views including HTML views, PDF and ePub downloads, according to the available data) and Abstracts Views on Vision4Press platform.
Data correspond to usage on the plateform after 2015. The current usage metrics is available 48-96 hours after online publication and is updated daily on week days.
Initial download of the metrics may take a while.