Fig. 3
Download original image
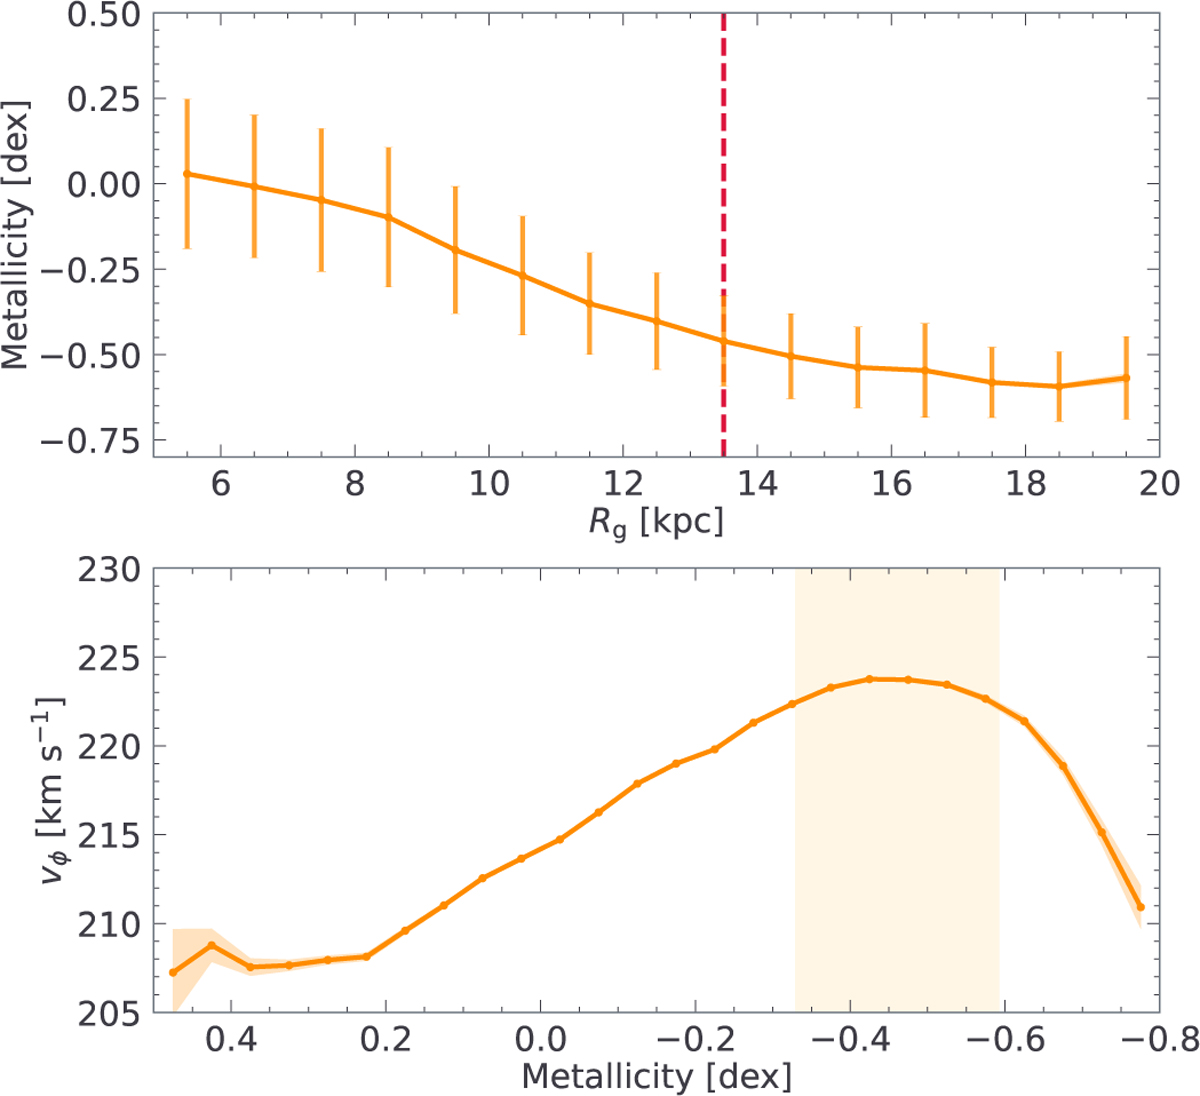
Upper panel: mean metallicity of the LAMOST sample as a function of guiding radius. Each point indicates the arithmetic mean within the corresponding bin, with the shaded region showing the uncertainty of the mean. The error bars denote the 1σ dispersion of the data in each bin. Lower panel: rotational velocity as a function of metallicity for the LAMOST sample. The vertical shaded band marks the metallicity dispersion at Rg ~ 13.5 kpc.
Current usage metrics show cumulative count of Article Views (full-text article views including HTML views, PDF and ePub downloads, according to the available data) and Abstracts Views on Vision4Press platform.
Data correspond to usage on the plateform after 2015. The current usage metrics is available 48-96 hours after online publication and is updated daily on week days.
Initial download of the metrics may take a while.