Fig. 4
Download original image
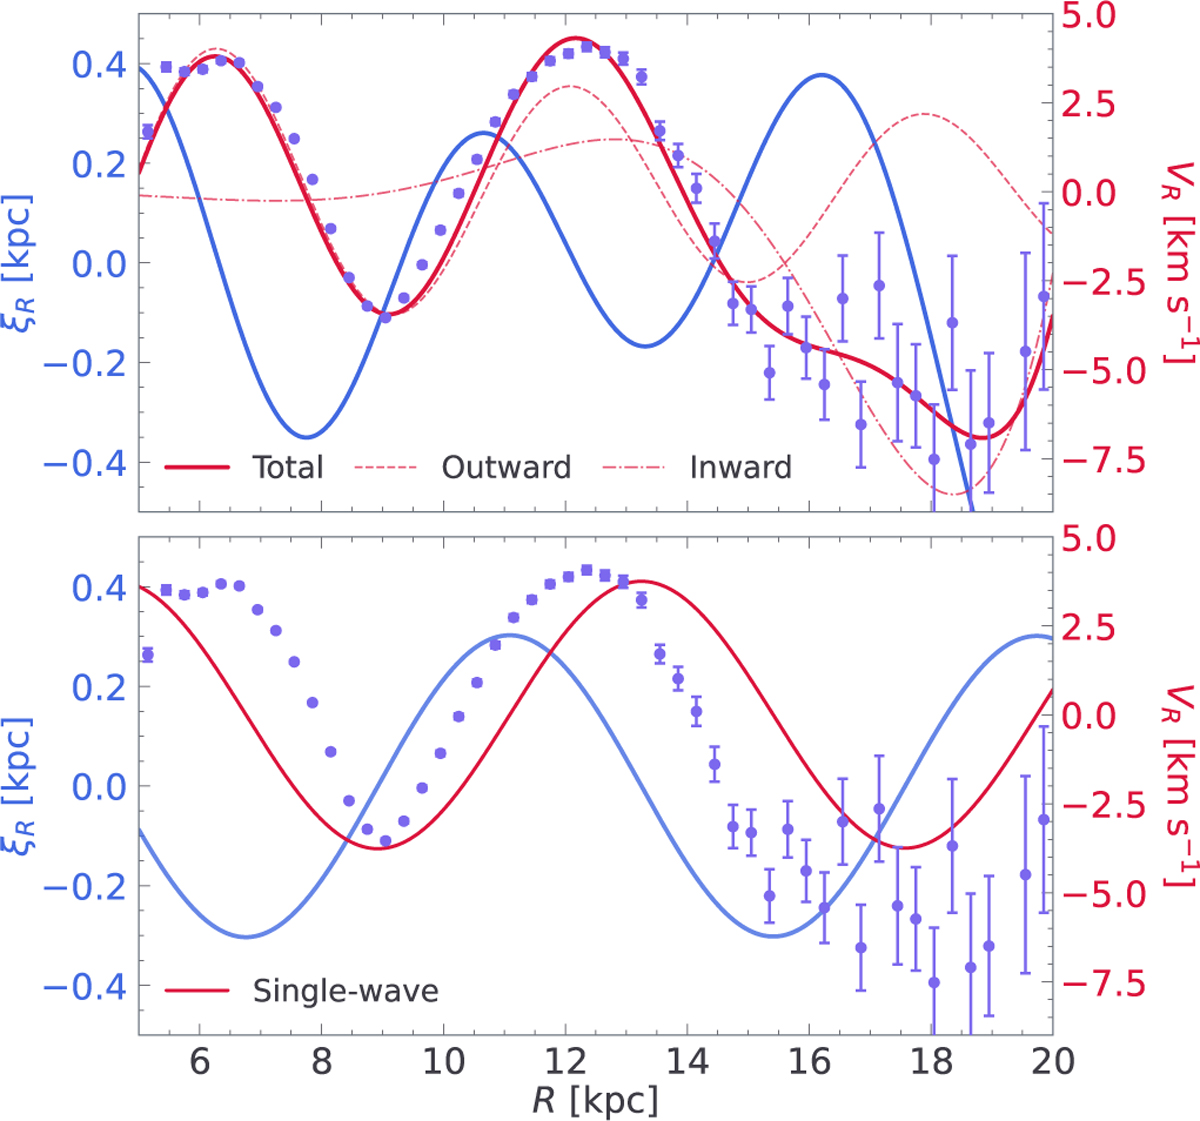
Corrugation model fitted to the Gaia sample. Upper panel: best-fitting double-wave model. The purple points show the mean radial velocity in each radial bin, with error bars indicating the uncertainty of the mean. The red curve represents the best-fitting VR pattern. The inferred radial displacement ξR(R) is shown in blue. Lower panel: same as the upper panel, but using a single-wave model, which fails to reproduce the full structure of the observed VR pattern.
Current usage metrics show cumulative count of Article Views (full-text article views including HTML views, PDF and ePub downloads, according to the available data) and Abstracts Views on Vision4Press platform.
Data correspond to usage on the plateform after 2015. The current usage metrics is available 48-96 hours after online publication and is updated daily on week days.
Initial download of the metrics may take a while.