Open Access
Fig. 5
Download original image
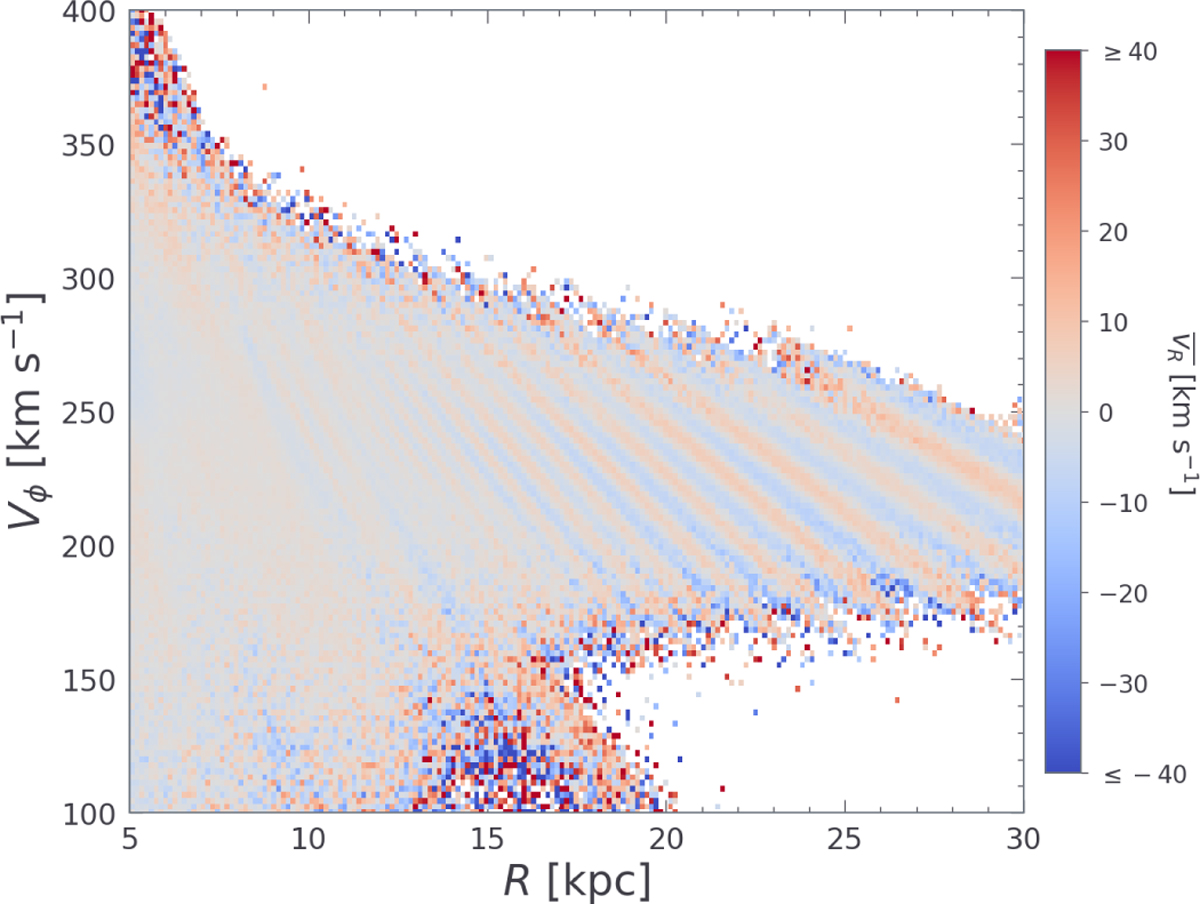
Velocity waves in the R–Vϕ plane colour-coded by ![]() using the N-body simulations. The snapshot at T = 4.4 Gyr is selected. Note that no selection criteria are applied and all the disk particles are used in this plot.
using the N-body simulations. The snapshot at T = 4.4 Gyr is selected. Note that no selection criteria are applied and all the disk particles are used in this plot.
Current usage metrics show cumulative count of Article Views (full-text article views including HTML views, PDF and ePub downloads, according to the available data) and Abstracts Views on Vision4Press platform.
Data correspond to usage on the plateform after 2015. The current usage metrics is available 48-96 hours after online publication and is updated daily on week days.
Initial download of the metrics may take a while.