| Issue |
A&A
Volume 708, April 2026
|
|
|---|---|---|
| Article Number | A320 | |
| Number of page(s) | 10 | |
| Section | Cosmology (including clusters of galaxies) | |
| DOI | https://doi.org/10.1051/0004-6361/202558705 | |
| Published online | 21 April 2026 | |
POLAR
II. Modeling the star formation history of galaxies on the 21 cm signal from the Epoch of Reionization
1
School of Physics and Electronic Science, Guizhou Normal University, Guiyang 550001, PR China
2
Guizhou Provincial Key Laboratory of Radio Astronomy and Data Processing, Guizhou Normal University, Guiyang 550001, PR China
3
Department of Physical Sciences, Indian Institute of Science Education and Research Kolkata, Mohanpur, WB 741 246, India
4
Max-Planck Institute für Astrophysics, Karl-Schwarzschild-Straße 1, 85748 Garching bei München, Germany
5
Berkeley Center for Cosmological Physics, Department of Physics, University of California, Berkeley, CA 94720, USA
6
National Astronomical Observatories, Chinese Academy of Sciences, 20A Datun Road, Chaoyang District, Beijing, 100101, China
7
State Key Laboratory of Radio Astronomy and Technology, Beijing 100101, China
8
Astronomy Centre, Department of Physics and Astronomy, University of Sussex, Falmer, Brighton BN19QH, UK
9
Kapteyn Astronomical Institute, University of Groningen, P.O. Box 800, NL-9700AV, Groningen, The Netherlands
10
The Oskar Klein Centre, Department of Astronomy, Stockholm University, AlbaNova, SE-10691 Stockholm, Sweden
11
ARCO (Astrophysics Research Center), Department of Natural Sciences, The Open University of Israel, 1 University Road, PO Box 808 Ra’anana, 4353701, Israel
★ Corresponding author: This email address is being protected from spambots. You need JavaScript enabled to view it.
Received:
20
December
2025
Accepted:
4
March
2026
Abstract
Context. Galaxies may suffer some starburst and quenched periods in their history due to galaxy mergers and feedback. However, semi-numerical simulations of the Epoch of Reionization (EoR) do not accurately model the effects of the star formation history (SFH) of galaxies.
Aims. Keeping the same total ionizing photon budget from galaxies, we investigate how the ionization and heating of the intergalactic medium (IGM), as well as the associated 21 cm signal during the EoR, depend on the variations in modeling the SFH of galaxies.
Methods. We adopted the JIUTIAN-300 N-body dark matter simulation and the semi-analytic model L-GALAXIES 2020 to model galaxy formation. Using the galaxy catalog from L-GALAXIES 2020 as input, we post-processed the JIUTIAN-300 density field with the 1D radiative transfer code GRIZZLY to model the reionization process and the 21 cm signal.
Results. We find that the ionized regions produced by galaxies with a SFH derived from L-GALAXIES 2020 are slightly larger and warmer than the ones obtained with a constant star formation rate. For a fixed stellar mass, galaxies produce smaller ionized regions with increasing stellar-mass-weighted stellar age τage. This results in a different topology and timing of the IGM ionization and heating obtained from GRIZZLY.
Conclusions. The SFH of galaxies is highly dependent on τage and redshift. Different models of the galactic SFH affect the gas heating and ionizing processes during the EoR and, as a consequence, also affect the 21 cm global signal and power spectrum.
Key words: galaxies: evolution / galaxies: high-redshift / dark ages / reionization / first stars
© The Authors 2026
 Open Access article, published by EDP Sciences, under the terms of the Creative Commons Attribution License (https://creativecommons.org/licenses/by/4.0), which permits unrestricted use, distribution, and reproduction in any medium, provided the original work is properly cited.
This article is published in open access under the Subscribe to Open model. This email address is being protected from spambots. You need JavaScript enabled to view it. to support open access publication.
1. Introduction
The Epoch of Reionization (EoR) is a major phase transition of the Universe from a fully neutral and cold state to a highly ionized and hot state (Gnedin & Madau 2022). It occurs after the formation of the first stars and galaxies and ends with the full ionization of the neutral intergalactic medium (IGM). Indirect observations of the physical state of the IGM, such as the Gunn–Peterson absorption trough in high-z QSO spectra (Fan et al. 2006; Bosman et al. 2022) and the Thomson scattering optical depth measured by cosmic microwave background (CMB) experiments (e.g., Planck satellite Planck Collaboration VI 2020), suggest that the EoR ends at z ≳ 5.
Since there is abundant neutral IGM during the EoR, the 21 cm hyperfine line of neutral hydrogen is expected to be an ideal probe of the high-z Universe (Furlanetto et al. 2006). The Experiment to Detect the Global EoR Signature (EDGES experiment)1 reported an absorption profile in the 21 cm signal at 78 MHz (i.e., z ∼ 17, Bowman et al. 2018), which has been interpreted as arising from formation of the first sources in the Universe. This result is strongly debated (e.g., Hills et al. 2018; Singh et al. 2022), and the absorption feature has not been found by the experiment SARAS 3 (Bevins et al. 2022). Radio array telescopes such as the low-frequency array (LOFAR)2, the New Extension in Nançay Upgrading LOFAR (NenuFAR)3, the hydrogen Epoch of Reionization Array (HERA)4, and the Murchison Widefield Array (MWA)5 have presented results on upper limits to the 21 cm power spectra (e.g., Mertens et al. 2025; Munshi et al. 2025; Abdurashidova et al. 2022; Trott et al. 2025), which have already been used to rule out some EoR models (Ghara et al. 2025; Mondal et al. 2020). The next generation radio telescope Square Kilometre Array (SKA)6 will provide more details on the history and topology of the EoR (Koopmans et al. 2015).
Observations of the IGM with 21 cm experiments are complemented by recent data on high-z galaxies. Due to its high sensitivity and wavelength coverage, the James Webb Space Telescope (JWST) has provided data in the last few years on low-mass and faint galaxies at high-z. These include three galaxies with spectroscopically confirmed redshifts of z ∼ 14 (Carniani et al. 2024; Naidu et al. 2026), the rest-frame UV luminosity functions (UVLFs) of galaxies up to z ∼ 16 (Harikane et al. 2023; Donnan et al. 2024), the stellar masses and star formation rates (SFRs) of many high-z galaxies (Navarro-Carrera et al. 2024; Wang et al. 2024). These superb data are combined with other high-z observations from such instruments as the Hubble Space Telescope (HST), the Spitzer telescope, and the Atacama Large Millimeter/submillimeter Array (ALMA) telescope, which also measured the UVLF and stellar mass functions (SMFs) of galaxies at z > 6 (Bouwens et al. 2020, 2021; Stefanon et al. 2021).
Both the 21 cm and high-z galaxy observations will provide powerful probes for studying galaxy formation and reionization processes. However, accurately modeling the complex physical processes during EoR remains challenging. High-resolution cosmological hydrodynamic and radiative transfer (RT) simulations are able to model gas cooling, star formation, metal enrichment, feedback effects, and gas ionizing processes and thus consistently compute both galactic and IGM properties. Among these simulations are SPHINX (Rosdahl et al. 2018; Katz et al. 2021), CoDa (Ocvirk et al. 2016, 2020), CROC (Gnedin 2014, 2016), THESAN (Kannan et al. 2022; Borrow et al. 2023; Kannan et al. 2025), and SPICE (Bhagwat et al. 2024), which are extremely computationally expensive and somewhat limited in terms of box size and/or mass resolution. Thus, their computational costs inhibit a parameter space exploration. In this respect, semi-analytical and semi-numerical approaches such as MERAXES (Mutch et al. 2016), ASTRAEUS (Hutter et al. 2021), and POLAR (Ma et al. 2023) are more efficient in modeling the formation and evolution of galaxies and reionization, with the drawback that not all the physical processes are treated fully self-consistently. 21cmFAST (Mesinger et al. 2011) and GRIZZLY (Ghara et al. 2015) apply semi-numerical calculations for the reionization process. However, they have no physical modeling of galaxy formation and thus cannot naturally include, for example, the stochasticity of the UV luminosity versus halo mass relation (Gelli et al. 2024; Nikolić et al. 2024).
Due to galaxy mergers and feedback effects, galaxies during the EoR may suffer diverse histories of starburst and quenching (Furlanetto & Mirocha 2022; Sugimura et al. 2024) and thus have very different star formation histories (SFHs) (Legrand et al. 2022; Iyer et al. 2025). Although the total ionizing photon emission of galaxies with the same stellar mass can be similar when evaluated over their entire history (e.g., Ma et al. 2025), their different SFHs can affect the recombination and cooling of ionized and heated IGM gas. Nevertheless, the effect of an evolving SFH is typically not properly included in the semi-numerical approaches mentioned above to study the 21 cm signal during the EoR. In this paper, we update POLAR (Ma et al. 2023; Acharya et al. 2025) to explicitly include the SFHs of galaxies in the reionization modeling, evaluated from semi-analytical galaxy formation simulations, and explore how different SFHs affect the ionizing and heating processes and the 21 cm signal during the EoR.
The paper is organized as follows. We describe the galaxy formation, UV and X-ray sources, and RT models in Sect. 2. We present our results on high-z galaxy SFH and reionization in Sect. 3 and summarize our conclusions in Sect. 4. The cosmological parameters adopted are ΩΛ = 0.6889, Ωm = 0.3111, Ωb = 0.049, h = 0.6766, σ8 = 0.8102, and ns = 0.9665 from the Planck project (Planck Collaboration VI 2020) fitted with the datasets of TT, TE, and EE+lowE+lensing+BAO.
2. Methods
2.1. Galaxy formation and evolution
Analogously to Ma et al. (2025), to model galaxy formation and evolution, we used the JIUTIAN-300 N-body dark matter simulation (Han et al. 2025) in combination with the semi-analytic model L-GALAXIES 2020 (named LG20 in the following; Henriques et al. 2020). JIUTIAN-300 was run with GADGET-4 (Springel et al. 2021), with a box size of 300 h−1 cMpc and 61443 dark matter particles, i.e., particle mass 107 h−1 M⊙. The simulation began at z = 127 and ended at z = 0, with a total of 128 snapshot outputs. We employed 39 of them at z ≥ 6. The dark matter halos were resolved with the friend-of-friend (FoF) algorithm (Springel et al. 2001), and the Subfind technique (Springel et al. 2005) was applied to identify the sub-halos. The halos have at least 20 dark-matter particles, i.e., the minimum halo mass is 2 × 10⁸ h−1 M⊙. Although to properly model high-z galaxies and the large-scale structure of the 21 cm signals during the EoR, one should run simulations in hundreds of comoving megaparsec boxes at a much higher resolution than that of JIUTAN-300. In practice, nevertheless, this is not feasible from a computational point of view. As a compromise, the mass resolution of JIUTIAN-300 is sufficient to evaluate the properties of high-z galaxies (see Ma et al. 2025), and box size 300 h−1 cMpc is enough to compute the 21 cm signal on the relevant scales.
LG20 is a semi-analytical galaxy formation model (Henriques et al. 2020), which includes physical processes such as gas cooling, star formation, galaxy mergers, supernova, and active galactic nucleus (AGN) feedback, chemical enrichment, tidal effects, and reincorporation of ejected gas. It adopts a star formation law based on molecular hydrogen H2. We adopted the parameter values listed in the column LG20_dust_final of Table 1 in Ma et al. (2025). They are mostly those from Henriques et al. (2020) consistent with observations of SMF at z ≤ 3, while four parameters (i.e., αH2, βSF, burst, γreinc, and Mr.p.) are the values that best fit the UVLF observations using HST and JWST at z = 6 − 12. With this set of parameters, the LG20 results are consistent with UVLF and SMF measured at z = 6 − 12. We refer the reader to Ma et al. (2025) for more details about the parameter values and a comparison with observations.
Note that radiative feedback is not included in the galaxy formation model, as the radiative processes described in the following are treated in post-processing. We note that star formation of very low-mass halos might be overestimated without the inclusion of radiative feedback (Hutter et al. 2021).
2.2. UV and X-ray sources
Since the budget of ionizing photons is dominated by massive stars while heating is dominated by X-ray binaries (XRBs) and shock-heated ISM (hot-ISM) (Eide et al. 2020; Ma et al. 2021), in the following we discuss in more detail how the various sources were modeled. Although the accretion of massive black holes (i.e., QSOs) can also emit abundant UV and X-ray photons, their total contribution to the EoR is usually considered to be subdominant due to their low number density (Ma et al. 2021; Zeltyn & Trakhtenbrot 2022; Jiang et al. 2022). Some studies nonetheless suggest that QSOs might have a nonnegligible contribution to reionization (Ross et al. 2019; Asthana et al. 2025). In this work we do not include the impact of QSOs.
2.2.1. Stellar sources
For each galaxy at a specific z, LG20 saves the stellar and metal mass formed within ∼30 time bins along its history. In each of these, we evaluated the spectral energy distribution (SED) of the formed stellar mass along with its age and metallicity using the binary star mode of Binary Population and Spectral Synthesis (BPASS, Eldridge et al. 2017; Stanway & Eldridge 2018). We then integrated along the history to get the integrated SEDs (iSEDs). As discussed in Ma et al. (2023, 2025), the iSED is not very sensitive to the redshift evolution, the stellar mass, and the galaxy formation model after normalization by stellar mass.
As a reference, Fig. 1 shows the average iSED of the stellar sources ⟨iSED⟩stellar after stellar mass normalization. When compared to the total SED, obtained from the sum of all source types (denoted as “All” in Fig. 1), we note that the stellar component dominates the UV radiation at E < 100 eV, while it becomes negligible at higher energies. Consistently with Ma et al. (2023), the ⟨iSED⟩stellar has negligible dependence on z, as we adopted a constant stellar IMF in the simulations and the stellar SED from the stellar population synthesis model (Eldridge et al. 2017) is insensitive to the metallicity evolution below Z⊙.
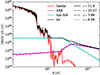 |
Fig. 1. Average stellar mass-normalized iSED of stellar sources (red), XRB (magenta), hot-ISM (cyan), and all source types combined (black) at z = 11.9 (solid), 10.07 (dashed), 7.88 (dash-dotted), and 6.99 (dotted) obtained from the LG20 simulation. These results are the mean values of all galaxies with > 104 M⊙. The slight differences (< 10%) observed in ⟨iSED⟩ at various redshifts are due to the evolution of galactic properties such as metallicity and stellar age. |
2.2.2. X-ray binaries
We modeled the luminosities and SEDs of XRB systems employing the stellar mass and metallicity obtained from LG20 in combination with the scaling relations from Madau & Fragos (2017). For each galaxy, we computed the luminosity associated with its high-mass XRBs (HMXBs) LHMXB and low-mass XRBs (LMXBs) LLMXB within each time bin along its SFH, where LHMXB is related to the metallicity and SFR, and LLMXB depends on the stellar age and mass. The total XRB luminosity of one galaxy is then LXRB = LHMXB + LLMXB. We adopted the SED template from Madau & Fragos (2017) to distribute the LXRB into the energy range 13.6 eV − 2 keV. Finally, we integrated along the SFH to obtain the integrated XRB SEDs for each galaxy.
In Fig. 1 we show the average stellar-mass-normalized iSED of XRBs ⟨iSED⟩XRB at four redshifts. Similarly to ⟨iSED⟩stellar, ⟨iSED⟩XRB also shows no redshift evolution. We note that ⟨iSED⟩XRB dominates the X-ray emission at E > 400 eV.
2.2.3. Shock-heated hot-ISM
The diffuse ISM shock-heated by supernova explosions (i.e., hot-ISM) can produce strong soft X-ray emission. The luminosity of the hot-ISM is linearly proportional to the SFR by a factor  within the energy range 0.3 − 10 keV (Pacucci et al. 2014). Note that the linear relation between hot-ISM luminosity and SFR assumes that the massive supernova explosion rate is proportional to the SFR, although such a relation may also depend on the environment. Since this was still not very clear, we just adopted the simplest linear relation previously adopted in other studies. For each galaxy, we computed the luminosity emitted by the hot-ISM within each time bin and then integrated along its SFH to obtain the integrated luminosity. This was then distributed within the energy range 13.6 eV − 2 keV with the thermal bremsstrahlung spectral shape shown in Pacucci et al. (2014).
In Fig. 1, we show the average stellar-mass-normalized iSED of the hot-ISM ⟨iSED⟩ISM at four redshifts. We see that ⟨iSED⟩ISM dominates the X-ray emission in the energy range 100 − 400 eV and that the ⟨iSED⟩ISM shows no redshift evolution.
2.3. Reionization and 21 cm signal
We used the 1D RT code GRIZZLY (Ghara et al. 2015) to evaluate the ionization and temperature of the IGM, and the associated 21 cm signal. Depending on the stellar mass and age of a galaxy, as well as on the underlying matter density, GRIZZLY first computes 1D ionization and temperature profiles associated with each galaxy, followed by the 3D ionization and temperature maps via the fast Fourier transform (FFT) technique to include ionizing and heating effects (Ghara et al. 2015). In the original version of GRIZZLY, a constant SFR (defined as stellar mass divided by stellar age) is assumed. Here, instead, we replaced the SFH assuming constant SFR with the one obtained from LG20. To make the computation more efficient, we took the average SFH of the galaxies within 29 stellar mass bins from 104 to 1011 M⊙ times 13 stellar age bins from 1 to 106 Myr. We included the ionization and heating of UV and X-ray radiation of stellar sources, XRBs, and hot-ISM using ⟨iSED⟩All shown in Fig. 1. We assumed an escape fraction of 0.1 for UV photons (E < 100 eV) and 1.0 for photons with E > 100 eV. During the latest stages of the EoR, when ionized regions merge into bigger ones, GRIZZLY corrects for the effects of bubble overlap by conserving the ionizing photon budget.
With the galaxy catalog from LG20 and the matter density maps from JIUTIAN-300, we modeled the reionization of the IGM with GRIZZLY. We ran GRIZZLY on a 2563 grid, i.e., the width of each cell is 1.17 h−1 cMpc. With such resolution, we expect the gas density to be roughly proportional to the dark matter density.
Finally, the 21 cm differential brightness temperature (DBT; T21 cm) was computed as
 (1)
(1)
where δm is the matter density obtained from the JIUTIAN-300 simulation, xHI is the neutral hydrogen fraction computed by GRIZZLY, TCMB is the CMB temperature, and TS is the spin temperature. We assumed that in the redshift range of our interest, at z < 12, a Lyα background has been established strong enough to couple the spin temperature to the kinetic temperature of the gas, i.e., TS = Tk, where Tk is computed by GRIZZLY. Note that this assumption is not correct at very high-z. To simplify our discussions, we also ignore redshift-space distortion (RSD) effects in the calculation of the 21 cm signal (Mao et al. 2012).
3. Results
3.1. Star formation history
During its evolution, a galaxy might experience several starburst and quenching episodes due to physical processes such as gas cooling, galaxy merger, supernova, and/or AGN feedback. LG20 describes the SFH of a galaxy at z in terms of its stellar-mass-weighted stellar age  , where zstart is the birth redshift of a galaxy, M★(z′) is the stellar mass formed within the time bin at z′ after the subtraction of mass loss due to supernova and asymptotic giant branch (AGB) winds, and tb(z′) is the time between z and z′. For galaxies with the same M★, a low τage denotes more stars formed at a later time, while a high τage means that most stars in the galaxy are formed at an earlier time.
To present how the SFH of galaxies is sensitive to τage, Fig. 2 shows the history of average SFR of galaxies with M★ ∼ 107 M⊙ but with different τage at seven redshifts from 12 to 6. The SFH with 1σ scatter of Fig. 2 is shown in Appendix A. Despite the fairly large scatter, we can still observe some obvious differences for galaxies with different τage. Note that, since at very high-z no galaxy is very massive and has a high τage, these lines are not shown in the plots. We observe that the SFHs of galaxies is highly dependent on τage and also evolve with z, although there are some common features with the same τage. More specifically, the SFR of galaxies roughly peaks at tb ≈ τage; namely, galaxies with τage = 0.4 Gyr at z = 5.96 have the highest SFR at tb ∼ 0.4 Gyr. This conclusion is redshift-independent, although galaxies at high-z (e.g., z = 11.9) have much shorter star formation periods than those at low z (e.g., z = 5.96). As τage decreases, the SFR increases at tb ∼ 0 Gyr; namely, galaxies with τage = 0.02 Gyr show the highest SFR at tb ∼ 0 Gyr.
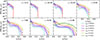 |
Fig. 2. Average SFR history of galaxies with M★ ∼ 107 M⊙ and stellar age τage = 0.02 Gyr (cyan), 0.04 Gyr (magenta), 0.06 Gyr (blue), 0.1 Gyr (red), 0.2 Gyr (yellow), and 0.4 Gyr (green) at z = 11.9, 10.94, 10.07, 8.91, 7.88, 6.99, and 5.96, from left to right and top to bottom. The x-axis tb is the time of galaxies traced back from z to higher redshift. |
Figure 3 shows the histories of the specific SFR (sSFR, i.e., the SFR divided by the stellar mass) of galaxies with different M★ and τage at z = 6.99. Consistently with Fig. 2, the sSFR of galaxies is sensitive to τage, while it does not depend very much on the stellar mass M★. More specifically, galaxies with the same τage but different M★ have roughly similar sSFR histories; for example, the sSFR of galaxies with three M★ are similar at tb < 0.5 Gyr in the case of τage = 0.2 Gyr. In contrast, with a fixed τage, more massive galaxies have earlier star formation than the less massive ones.
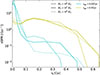 |
Fig. 3. Average sSFR (i.e., SFR per unit stellar mass) history of galaxies with stellar age τage = 0.02 Gyr (cyan) and 0.2 Gyr (yellow) for galaxies with M★ ∼ 106 M⊙ (dashed), 107 M⊙ (solid), and 108 M⊙ (dotted). The results are at z = 6.99. |
Figure 4 shows the distributions of stellar-mass-weighted stellar age τage versus stellar mass M★ of galaxies at various redshifts. At the same z, the mean τage increases with increasing M★ for M★ < 106 M⊙, while it decreases for M★ > 106 M⊙. This is due to the higher SFR in the massive galaxies, while star formation in smaller objects (∼ 106 M⊙) is easily quenched by supernova feedback. With the same M★, the mean τage of galaxies increases with decreasing z. We note that the number density of galaxies peaks at 105 M⊙, while the lack of lower-mass galaxies is due to a combination of the resolution limit of JIUTIAN-300 and the supernova feedback effect. As shown in Ma et al. (2025), the galaxy sample at M★ < 107 M⊙ might be incomplete due to the mass resolution of the simulation, and thus the relation of τage and M★ might not be very robust at M★ < 107 M⊙. As the τage and M★ relations at all redshifts have very strong scatters, we took τage and M★ as two independent properties for each galaxy in the GRIZZLY simulations.
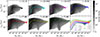 |
Fig. 4. Distributions of stellar age τage vs. stellar mass M★ of galaxies at z = 11.9, 10.94, 10.07, 8.91, 7.88, 6.99, and 5.96, from left to right and top to bottom. The solid lines indicate the mean τage of galaxies within the same M★ bins, shown together for all redshifts in the bottom-right plot. |
3.2. Reionization
Using the galactic stellar mass M★, stellar age τage, and SFH obtained from LG20 as input quantities, we employed GRIZZLY to compute the reionization process and the associated 21 cm signal. To investigate how the ionization and heating of the IGM and the associated 21 cm signal from the EoR depend on the galactic SFH, we ran six GRIZZLY simulations with different SFH models. As a reference, three adopt a constant stellar age, i.e., τage = 0.02 Gyr, 0.1 Gyr, and 0.2 Gyr, while one adopts the τage of galaxies obtained from LG20. The simulations are named simul_0.02, simul_0.1, simul_0.2, and simul_Fiducial, respectively. In all simulations, the galactic SFH is the one obtained from LG20. Additionally, for simul_0.1 and simul_Fiducial we also ran a case in which the SFR is kept constant (i.e., SFR =M★/τage) along the galactic history with a period of τage. These simulations are named simul_0.1_const and simul_Fiducial_const, respectively. In the following we employ these six GRIZZLY simulations to study the effects of different SFH modeling on the ionizing and heating processes and on the 21 cm signal during the EoR.
3.2.1. Ionization and gas temperature
As mentioned in Sect. 2.3, GRIZZLY first precomputes the 1D ionization and temperature profiles along the radius away from galaxies with different stellar masses, stellar ages, and IGM matter densities. As a reference, Fig. 5 shows some samples of the ionization fraction xHII, gas temperature Tk, and 21 cm DBT T21 cm profiles for galaxies with the same stellar mass M* but different stellar ages τage and SFH models at z = 10.07. Galaxies with M* = 107 M⊙ but different τage have similar ionized bubbles, of extension ∼ 90 kpc, as the ionized photon budget is roughly linearly proportional to M* (Ma et al. 2025). Some differences, though, are visible. More specifically, the radius of the ionized bubble becomes slightly smaller with increasing τage. For example, for τage = 0.2 Gyr the radius is ∼13% smaller (corresponding to ∼34% smaller in ionized volume) than for τage = 0.02 Gyr, because the recombination of ionized hydrogen and free electrons becomes more significant for longer τage. Meanwhile, for the same τage = 0.02 Gyr, the ionized bubble of a galaxy with the SFH from LG20 is roughly ∼10% larger than the one with a constant SFR. The difference reduces to ∼5% and ∼1% for τage = 0.1 Gyr and 0.2 Gyr, respectively. The tail of low ionization visible at longer distances beyond the fully ionized bubble is due to the high energy photons, which can only partially ionize the neutral gas (see also Ghara et al. 2015), reaching xHII = 10−4 at R ∼ 200 kpc. The profiles of the gas temperature, Tk, are similar to those of xHII; i.e., Tk becomes slightly smaller as τage increases, while for the same τage the galaxy with the SFH from LG20 has a higher Tk than the one with a constant SFR. The differences of xHII and Tk caused by the various models of SFH also produce clear differences in the 21 cm DBT T21 cm. Since T21 cm ∝ (1 − TCMB/TS) (see Eq. (1)), such differences are more significant at R > 120 kpc, where the gas temperature Tk is below TCMB.
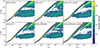 |
Fig. 5. 1D profiles of ionization fraction xHII (left), gas temperature Tk (middle), and 21 cm signal T21 cm (right) as functions of the physical distance R from a galaxy with M* = 107 M⊙ at z = 10.07. The colors indicate galaxies with τage = 0.02 Gyr (cyan), 0.1 Gyr (red), and 0.2 Gyr (yellow). The solid lines denote the results obtained by adopting the SFH from LG20 (SFH_LG20), while the dotted lines denote a constant SFR throughout the SFH (SFH_const). The surrounding IGM is assumed to be uniform with the mean density of the Universe at z = 10.07. |
To investigate how the different models of SFH affect the ionization and gas temperature of the IGM, we show in Fig. 6 the 2D distributions of gas temperature Tk as a function of the ionization fraction xHII at z = 10.07. As a reference, we also show Tk as a function of xHII from the 1D RT calculations for galaxies with different stellar masses, stellar ages, and matter densities precomputed by GRIZZLY. Note that the size of the ionized bubbles can be larger than that estimated by the 1D RT calculations due to the correction applied to account for the overlap of ionized regions (see Ghara et al. 2015, for more details). This means that in the simulation box many cells with the same Tk show higher xHII than the ones from the 1D RT calculations. In all simulations, the IGM cells are roughly located in three regions. The first is at Tk > 103 K with xHII > 0.05, comprising gas heated and ionized by both UV and X-ray photons. Since the Tk of these cells is much higher than the CMB temperature, the slight differences shown in the six simulations would not be visible in the corresponding 21 cm signal. The second region is at Tk < 400 K with xHII > 0.003, where the cells have xHII higher than those from the 1D RT calculations due to the correction for overlap. With a constant τage and the SFH from LG20, the Tk of cells within this region becomes lower with increasing τage. For example, their Tk from simul_0.2 is typically lower than that from simul_0.02, consistent with Fig. 5. The Tk within this region from simulations with the SFH from LG20 is higher than the one with a constant SFR. For example, the one from simul_0.1 and simul_Fiducial is higher than that from simul_0.1_const and simul_Fiducial_const, respectively. Since most cells within this region have Tk < 100 K, we expect to see differences in the associated 21 cm signal of simulations with different SFH models. In the third region, the Tk and xHII values overlap with those from the 1D RT calculation. These are cells located far away from the ionization-fronts (I-fronts) and thus are not affected by the correction for overlap. Many cells within this region also have Tk < 100 K. The Tk values decrease with increasing τage in the simulations with constant τage and SFH from LG20, while the values from simulations with the SFH from LG20 are higher than those with constant SFRs. Such differences in Tk within this region from simulations with different SFH models are expected to affect the corresponding 21 cm signals.
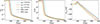 |
Fig. 6. 2D distributions of gas temperature Tk vs. ionization fraction xHII from simulation simul_0.02, simul_0.1, simul_0.1_const, simul_0.2, simul_Fiducial, and simul_Fiducial_const at z = 10.07, from left to right and top to bottom. simul_0.1_const and simul_Fiducial_const have a constant SFR, while the others adopt the SFH obtained from LG20. The gray lines in the background denote Tk as a function of xHII from the 1D RT calculations. |
3.2.2. The 21 cm signal
Figure 7 shows the light cones of T21 cm extracted from six simulations. At z = 12, most of the 21 cm signal is still in absorption (blue cells), and fully ionized gas (white cells) is negligible. Because of heating from the X-ray sources (see Fig. 1), the 21 cm signal becomes mostly in emission at z ∼ 10. Ionized bubbles are clearly visible at z = 7, where all the cells are highly heated and the 21 cm signal is in emission. The simulations with different models of SFH show some visible differences: simul_0.02 has more ionization at z = 7 and higher T21 cm at z = 12 than simul_0.2, due to the larger ionized bubbles and stronger gas heating produced by the galaxies with smaller τage (see Fig. 5). As galaxies with the SFH from LG20 can produce larger ionized bubbles than those with a constant SFR (see Fig. 5), simul_0.1 has more ionization at z = 7 than simul_0.1_const. simul_Fiducial shows an ionization history similar to that from simul_Fiducial_const, even though the former has higher T21 cm than the latter at for instance z > 10.
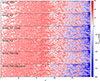 |
Fig. 7. Top to bottom: Light cones of 21 cm DBT T21 cm from z = 7 to 12, extracted from simul_0.02, simul_0.1, simul_0.1_const, simul_0.2, simul_Fiducial, and simul_Fiducial_const. |
The left panel of Fig. 8 shows the evolution of the volume-averaged mean ionization fraction  , mean 21 cm DBT
  , and rms of 21 cm DBT σ21 cm for different models of SFH. As shown in Fig. 5, galaxies with smaller τage produce larger ionized bubbles; thus, the EoR in simul_0.02 ends Δz ≈ 0.5 earlier than in simul_0.2. The EoR in simul_0.1 finishes earlier than in simul_0.1_const, as the galaxies with the SFH from LG20 produce ionized bubbles larger than those with a constant SFR, as shown in Fig. 5. For the same reason, the EoR in simul_Fiducial ends slightly earlier than in simul_Fiducial_const. At z > 10, simul_Fiducial, simul_Fiducial_const, simul_0.1, and simul_0.1_const have similar
  , while simul_0.02 and simul_0.2 produce a higher and lower
  at the same z, respectively.
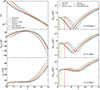 |
Fig. 8. Left: Histories of volume-averaged mean ionization fraction |


Galaxies with the same M★ but different models of SFH can exhibit different ionization and heating patterns (see Fig. 5) and hence associated 21 cm signatures, particularly at z > 9 when heating dominates the signal (see also the gas temperature distributions in Fig. 6). More specifically, a higher τage means less X-ray heating; thus, simul_0.2 has a lower  than simul_0.1 and simul_0.02. The
  of simul_0.1, instead, is higher than that of simul_0.1_const due to greater heating from galaxies with the SFH obtained from LG20 compared to those with a constant SFR (see also Fig. 6). For the same reason, simul_Fiducial has a higher
  than simul_Fiducial_const. σ21 cm is roughly related to the absolute value of
  , and a higher absolute value of
  leads to a larger σ21 cm. When the neutral gas becomes highly heated (e.g., z < 9),
  is dominated by the contribution from the ionization fraction
  , and a higher
  leads to a lower
  and smaller σ21 cm.
The right panel of Fig. 8 shows the evolution of the 21 cm power spectra Δ21 cm2 at k = 0.05 Mpc−1, 0.1 Mpc−1, and 0.5 Mpc−1 for simulations with different SFH models. All power spectra exhibit similar features at the three k-values, i.e., they decrease with decreasing z at z > 9 due to X-ray heating, while at z < 8 they increase with decreasing z due to the inhomogeneous ionizing process. Modeling SFH also imprints some differences on Δ21 cm2. At z > 9, when the bulk of the IGM gas is only weakly heated, X-ray heating increases the local 21 cm fluctuations. For this reason, Δ21 cm2 is higher in simulations with less gas heating, and its evolution roughly follows the σ21 cm shown in the left panel of Fig. 8. More specifically, simul_0.2 has a higher Δ21 cm2 than simul_0.1 and simul_0.02, as the weaker X-ray heating of galaxies with τage = 0.2 Gyr (see Fig. 5) leads to lower T21 cm but larger σ21 cm and higher Δ21 cm2. Since the heating of galaxies with the SFH from LG20 is more than from those with a constant SFR, the Δ21 cm2 of simul_0.1 and simul_Fiducial is lower than simul_0.1_const and simul_Fiducial_const, respectively. At z < 8, peaks in the Δ21 cm2 emerge before the end of the EoR, when the neutral gas is highly heated and the 21 cm fluctuations are dominated by the ionized bubbles. For example, the Δ21 cm2 of simul_0.2 peaks at a z (∼6.6) lower than those of simul_0.1 and simul_0.02, whereas the Δ21 cm2 of simul_0.1 with the SFH from LG20 peaks at a z higher than that of simul_0.1_const with constant SFR. simul_Fiducial and simul_Fiducial_const have similar Δ21 cm2 at z < 8, consistent with their  and
and  shown in the left panel of Fig. 8.
4. Conclusions and discussions
A wealth of data on galaxy properties from the EoR has been recently (or will soon be) obtained by JWST, and on the 21 cm signal by the IGM gas by LOFAR, NenuFAR, HERA, MWA, and SKA. To optimally exploit these data, we developed the semi-numerical code POLAR (Ma et al. 2023; Acharya et al. 2025), which consistently and efficiently models the galaxy formation and reionization processes. In this work, we updated POLAR to include the effects of an evolving SFH as well as of source populations other than stars in the modeling of reionization. We investigates how these affect IGM heating and ionization, as well as the 21 cm signal during the EoR.
We adopted the JIUTIAN-300 N-body dark matter simulation (Han et al. 2025), which resolves a minimum halo mass of 2 × 10⁸ h−1 M⊙, and the semi-analytic model LG20 (Henriques et al. 2020), to follow the formation and evolution of galaxies. We then post-processed the star formation and metallicity histories of each galaxy to obtain the luminosity and SEDs of the stellar sources, XRB, and hot-ISM. Finally, we employed the 1D RT code GRIZZLY together with the galaxy catalog from LG20 and the matter density maps from JIUTIAN-300 to model the IGM reionization history and the associated 21 cm signal.
We find that the stellar-mass-weighted stellar age τage of galaxies with the same M★ is very sensitive to the SFH, and that galaxies with the same τage but different stellar massed have similar sSFRs. The mean values of τage decrease with increasing M★ at M★ > 106 M⊙, while for a fixed M★ the mean τage increases with decreasing z. We also find that for galaxies with the same stellar mass, a large τage results in more recombinations of ionized hydrogen and free electrons and hence smaller ionized regions than those produced by galaxies with smaller τage. For the same τage and stellar mass, the ionized bubbles surrounding galaxies with the SFH obtained from LG20 are slightly larger than those with a constant SFR, although differences become smaller with increasing τage. The different models of SFH also yield slightly different partial ionization and gas temperature profiles due to X-ray heating, which consequently yields differences in the 21 cm DBT, T21 cm.
We ran six RT GRIZZLY simulations with different SFH models to explore their impact on the 21 cm signal during the EoR. All the simulations have the same ionizing photon budget, as the total ionizing photon emission of galaxies with the same stellar mass is similar across their entire history (Ma et al. 2025). We find that varying SFH models changes gas-temperature dependence on the ionization fraction. With the SFH obtained from LG20, the simulations with higher constant τage lead to lower gas temperatures, and the gas temperature of simulations with the SFH from LG20 is higher than those with a constant SFR. Since galaxies with lower τage have larger ionized bubbles, the simulation with a lower constant τage ends the reionization process earlier than that with a higher constant τage. For the same τage, the simulations with a SFH from LG20 finish the EoR earlier than those with a constant SFR. These features also appear in the evolution of the 21 cm power spectra Δ21 cm2. At z > 9 the simulation with a higher constant τage has a higher Δ21 cm2 than the one with a lower constant τage. Moreover, the simulations with the SFH from LG20 have a lower Δ21 cm2 than the ones with a constant SFR.
In summary, we updated the POLAR code by including ionization and heating effects from stellar sources, XRBs, and shock heated ISM, as well as evolving galactic SFH in the reionization modeling. Since different SFHs of galaxies can affect the recombination and cooling of ionized and heated IGM gas and, as a consequence, result in different ionizing and heating patterns, accurate modeling of the galactic SFH is important in investigations of the 21 cm signal.
Acknowledgments
This work is supported by the National Natural Science Foundation of China (Grant No. 12263002). RG acknowledges support from SERB, DST Ramanujan Fellowship no. RJF/2022/000141.
References
- Abdurashidova, Z., Aguirre, J. E., Alexander, P., et al. 2022, ApJ, 925, 221 [NASA ADS] [CrossRef] [Google Scholar]
- Acharya, A., Ma, Q.-B., Giri, S. K., et al. 2025, MNRAS, 543, 1058 [Google Scholar]
- Asthana, S., Haehnelt, M. G., Kulkarni, G., et al. 2025, MNRAS, 542, 2968 [Google Scholar]
- Bevins, H. T. J., Fialkov, A., de Lera Acedo, E., et al. 2022, Nat. Astron., 6, 1473 [Google Scholar]
- Bhagwat, A., Costa, T., Ciardi, B., Pakmor, R., & Garaldi, E. 2024, MNRAS, 531, 3406 [NASA ADS] [CrossRef] [Google Scholar]
- Borrow, J., Kannan, R., Garaldi, E., et al. 2023, MNRAS, 525, 5932 [NASA ADS] [CrossRef] [Google Scholar]
- Bosman, S. E. I., Davies, F. B., Becker, G. D., et al. 2022, MNRAS, 514, 55 [NASA ADS] [CrossRef] [Google Scholar]
- Bouwens, R., González-López, J., Aravena, M., et al. 2020, ApJ, 902, 112 [NASA ADS] [CrossRef] [Google Scholar]
- Bouwens, R. J., Oesch, P. A., Stefanon, M., et al. 2021, AJ, 162, 47 [NASA ADS] [CrossRef] [Google Scholar]
- Bowman, J. D., Rogers, A. E. E., Monsalve, R. A., Mozdzen, T. J., & Mahesh, N. 2018, Nature, 555, 67 [Google Scholar]
- Carniani, S., Hainline, K., D’Eugenio, F., et al. 2024, Nature, 633, 318 [CrossRef] [Google Scholar]
- Donnan, C. T., McLure, R. J., Dunlop, J. S., et al. 2024, MNRAS, 533, 3222 [NASA ADS] [CrossRef] [Google Scholar]
- Eide, M. B., Ciardi, B., Graziani, L., et al. 2020, MNRAS, 498, 6083 [Google Scholar]
- Eldridge, J. J., Stanway, E. R., Xiao, L., et al. 2017, PASA, 34, e058 [Google Scholar]
- Fan, X., Carilli, C. L., & Keating, B. 2006, ARA&A, 44, 415 [Google Scholar]
- Furlanetto, S. R., & Mirocha, J. 2022, MNRAS, 511, 3895 [NASA ADS] [CrossRef] [Google Scholar]
- Furlanetto, S. R., Oh, S. P., & Briggs, F. H. 2006, Phys. Rep., 433, 181 [Google Scholar]
- Gelli, V., Mason, C., & Hayward, C. C. 2024, ApJ, 975, 192 [NASA ADS] [CrossRef] [Google Scholar]
- Ghara, R., Choudhury, T. R., & Datta, K. K. 2015, MNRAS, 447, 1806 [NASA ADS] [CrossRef] [Google Scholar]
- Ghara, R., Zaroubi, S., Ciardi, B., et al. 2025, A&A, 699, A109 [NASA ADS] [CrossRef] [EDP Sciences] [Google Scholar]
- Gnedin, N. Y. 2014, ApJ, 793, 29 [CrossRef] [Google Scholar]
- Gnedin, N. Y. 2016, ApJ, 821, 50 [Google Scholar]
- Gnedin, N. Y., & Madau, P. 2022, Liv. Rev. Comput. Astrophys., 8, 3 [CrossRef] [Google Scholar]
- Han, J., Li, M., Jiang, W., et al. 2025, Sci. China: Phys. Mech. Astron., 68, 109511 [Google Scholar]
- Harikane, Y., Ouchi, M., Oguri, M., et al. 2023, ApJS, 265, 5 [NASA ADS] [CrossRef] [Google Scholar]
- Henriques, B. M. B., Yates, R. M., Fu, J., et al. 2020, MNRAS, 491, 5795 [NASA ADS] [CrossRef] [Google Scholar]
- Hills, R., Kulkarni, G., Meerburg, P. D., & Puchwein, E. 2018, Nature, 564, E32 [Google Scholar]
- Hutter, A., Dayal, P., Yepes, G., et al. 2021, MNRAS, 503, 3698 [NASA ADS] [CrossRef] [Google Scholar]
- Iyer, K. G., Starkenburg, T. K., Bryan, G. L., et al. 2025, ApJ, 994, 174 [Google Scholar]
- Jiang, L., Ning, Y., Fan, X., et al. 2022, Nat. Astron., 6, 850 [NASA ADS] [CrossRef] [Google Scholar]
- Kannan, R., Garaldi, E., Smith, A., et al. 2022, MNRAS, 511, 4005 [NASA ADS] [CrossRef] [Google Scholar]
- Kannan, R., Puchwein, E., Smith, A., et al. 2025, Open J. Astrophys., 8, 153 [Google Scholar]
- Katz, H., Martin-Alvarez, S., Rosdahl, J., et al. 2021, MNRAS, 507, 1254 [NASA ADS] [CrossRef] [Google Scholar]
- Koopmans, L., Pritchard, J., Mellema, G., et al. 2015, Advancing Astrophysics with the Square Kilometre Array (AASKA14), 1 [Google Scholar]
- Legrand, L., Hutter, A., Dayal, P., et al. 2022, MNRAS, 509, 595 [Google Scholar]
- Ma, Q.-B., Ciardi, B., Eide, M. B., et al. 2021, ApJ, 912, 143 [Google Scholar]
- Ma, Q.-B., Ghara, R., Ciardi, B., et al. 2023, MNRAS, 522, 3284 [NASA ADS] [CrossRef] [Google Scholar]
- Ma, Q.-B., Chen, X.-R., Li, M., et al. 2025, ApJ, 986, 5 [Google Scholar]
- Madau, P., & Fragos, T. 2017, ApJ, 840, 39 [Google Scholar]
- Mao, Y., Shapiro, P. R., Mellema, G., et al. 2012, MNRAS, 422, 926 [NASA ADS] [CrossRef] [Google Scholar]
- Mertens, F. G., Mevius, M., Koopmans, L. V. E., et al. 2025, A&A, 698, A186 [NASA ADS] [CrossRef] [EDP Sciences] [Google Scholar]
- Mesinger, A., Furlanetto, S., & Cen, R. 2011, MNRAS, 411, 955 [Google Scholar]
- Mondal, R., Fialkov, A., Fling, C., et al. 2020, MNRAS, 498, 4178 [NASA ADS] [CrossRef] [Google Scholar]
- Munshi, S., Mertens, F. G., Chege, J. K., et al. 2025, MNRAS, 542, 2785 [Google Scholar]
- Mutch, S. J., Geil, P. M., Poole, G. B., et al. 2016, MNRAS, 462, 250 [NASA ADS] [CrossRef] [Google Scholar]
- Naidu, R. P., Oesch, P. A., Brammer, G., et al. 2026, Open J. Astrophys., 9, 56033 [Google Scholar]
- Navarro-Carrera, R., Rinaldi, P., Caputi, K. I., et al. 2024, ApJ, 961, 207 [CrossRef] [Google Scholar]
- Nikolić, I., Mesinger, A., Davies, J. E., & Prelogović, D. 2024, A&A, 692, A142 [NASA ADS] [CrossRef] [EDP Sciences] [Google Scholar]
- Ocvirk, P., Gillet, N., Shapiro, P. R., et al. 2016, MNRAS, 463, 1462 [Google Scholar]
- Ocvirk, P., Aubert, D., Sorce, J. G., et al. 2020, MNRAS, 496, 4087 [NASA ADS] [CrossRef] [Google Scholar]
- Pacucci, F., Mesinger, A., Mineo, S., & Ferrara, A. 2014, MNRAS, 443, 678 [CrossRef] [Google Scholar]
- Planck Collaboration VI. 2020, A&A, 641, A6 [NASA ADS] [CrossRef] [EDP Sciences] [Google Scholar]
- Rosdahl, J., Katz, H., Blaizot, J., et al. 2018, MNRAS, 479, 994 [NASA ADS] [Google Scholar]
- Ross, H. E., Dixon, K. L., Ghara, R., Iliev, I. T., & Mellema, G. 2019, MNRAS, 487, 1101 [NASA ADS] [CrossRef] [Google Scholar]
- Singh, S., Jishnu, N. T., Subrahmanyan, R., et al. 2022, Nat. Astron., 6, 607 [NASA ADS] [CrossRef] [Google Scholar]
- Springel, V., White, S. D. M., Tormen, G., & Kauffmann, G. 2001, MNRAS, 328, 726 [Google Scholar]
- Springel, V., White, S. D. M., Jenkins, A., et al. 2005, Nature, 435, 629 [Google Scholar]
- Springel, V., Pakmor, R., Zier, O., & Reinecke, M. 2021, MNRAS, 506, 2871 [NASA ADS] [CrossRef] [Google Scholar]
- Stanway, E. R., & Eldridge, J. J. 2018, MNRAS, 479, 75 [NASA ADS] [CrossRef] [Google Scholar]
- Stefanon, M., Bouwens, R. J., Labbé, I., et al. 2021, ApJ, 922, 29 [NASA ADS] [CrossRef] [Google Scholar]
- Sugimura, K., Ricotti, M., Park, J., Garcia, F. A. B., & Yajima, H. 2024, ApJ, 970, 14 [NASA ADS] [CrossRef] [Google Scholar]
- Trott, C. M., Nunhokee, C. D., Null, D., et al. 2025, ApJ, submitted [arXiv:2508.04164] [Google Scholar]
- Wang, X., Cheng, C., Ge, J., et al. 2024, ApJ, 967, L42 [NASA ADS] [CrossRef] [Google Scholar]
- Zeltyn, G., & Trakhtenbrot, B. 2022, ApJ, 929, 21 [Google Scholar]
Appendix A: Star formation history with 1σ scatter
Figure A.1 shows the history of the average SFR, together with the 1σ scatter, of galaxies with M★ ∼ 107 M⊙ and different τage at seven redshifts in the range 12 to 6. Since there is a substantial overlap of the 1σ scatter of many curves, here we show the results only for two representative τage. We note that the differences in the SFH of galaxies with different τage are obvious even when accounting for the scatter.
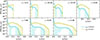 |
Fig. A.1. Average SFR history with 1σ scatter of galaxies with M★ ∼ 107 M⊙ and stellar age τage = 0.2 Gyr (cyan), and 0.2 Gyr (yellow) at z = 11.9, 10.94, 10.07, 8.91, 7.88, 6.99, and 5.96, from left to right and top to bottom. The x-axis tb denotes the time of galaxies traced back from z to higher redshift. |
Since using the SFH of each galaxy in GRIZZLY is too computationally expensive, we will take the average SFH for all the galaxies within a given stellar mass and age bin. Although the average SFH has some scatter, we find that this is a good approximation and that it makes the running of GRIZZLY efficient. As a reference, we adopt 29 stellar mass bins and 13 age bins i.e., 377 galaxy bins at each redshift, while the results of LG20 with the merger trees from JIUTIAN-300 has ∼108 galaxies at z = 6.
All Figures
|
Fig. 1. Average stellar mass-normalized iSED of stellar sources (red), XRB (magenta), hot-ISM (cyan), and all source types combined (black) at z = 11.9 (solid), 10.07 (dashed), 7.88 (dash-dotted), and 6.99 (dotted) obtained from the LG20 simulation. These results are the mean values of all galaxies with > 104 M⊙. The slight differences (< 10%) observed in ⟨iSED⟩ at various redshifts are due to the evolution of galactic properties such as metallicity and stellar age. |
| In the text | |
|
Fig. 2. Average SFR history of galaxies with M★ ∼ 107 M⊙ and stellar age τage = 0.02 Gyr (cyan), 0.04 Gyr (magenta), 0.06 Gyr (blue), 0.1 Gyr (red), 0.2 Gyr (yellow), and 0.4 Gyr (green) at z = 11.9, 10.94, 10.07, 8.91, 7.88, 6.99, and 5.96, from left to right and top to bottom. The x-axis tb is the time of galaxies traced back from z to higher redshift. |
| In the text | |
|
Fig. 3. Average sSFR (i.e., SFR per unit stellar mass) history of galaxies with stellar age τage = 0.02 Gyr (cyan) and 0.2 Gyr (yellow) for galaxies with M★ ∼ 106 M⊙ (dashed), 107 M⊙ (solid), and 108 M⊙ (dotted). The results are at z = 6.99. |
| In the text | |
|
Fig. 4. Distributions of stellar age τage vs. stellar mass M★ of galaxies at z = 11.9, 10.94, 10.07, 8.91, 7.88, 6.99, and 5.96, from left to right and top to bottom. The solid lines indicate the mean τage of galaxies within the same M★ bins, shown together for all redshifts in the bottom-right plot. |
| In the text | |
|
Fig. 5. 1D profiles of ionization fraction xHII (left), gas temperature Tk (middle), and 21 cm signal T21 cm (right) as functions of the physical distance R from a galaxy with M* = 107 M⊙ at z = 10.07. The colors indicate galaxies with τage = 0.02 Gyr (cyan), 0.1 Gyr (red), and 0.2 Gyr (yellow). The solid lines denote the results obtained by adopting the SFH from LG20 (SFH_LG20), while the dotted lines denote a constant SFR throughout the SFH (SFH_const). The surrounding IGM is assumed to be uniform with the mean density of the Universe at z = 10.07. |
| In the text | |
|
Fig. 6. 2D distributions of gas temperature Tk vs. ionization fraction xHII from simulation simul_0.02, simul_0.1, simul_0.1_const, simul_0.2, simul_Fiducial, and simul_Fiducial_const at z = 10.07, from left to right and top to bottom. simul_0.1_const and simul_Fiducial_const have a constant SFR, while the others adopt the SFH obtained from LG20. The gray lines in the background denote Tk as a function of xHII from the 1D RT calculations. |
| In the text | |
|
Fig. 7. Top to bottom: Light cones of 21 cm DBT T21 cm from z = 7 to 12, extracted from simul_0.02, simul_0.1, simul_0.1_const, simul_0.2, simul_Fiducial, and simul_Fiducial_const. |
| In the text | |
|
Fig. 8. Left: Histories of volume-averaged mean ionization fraction |
| In the text | |
|
Fig. A.1. Average SFR history with 1σ scatter of galaxies with M★ ∼ 107 M⊙ and stellar age τage = 0.2 Gyr (cyan), and 0.2 Gyr (yellow) at z = 11.9, 10.94, 10.07, 8.91, 7.88, 6.99, and 5.96, from left to right and top to bottom. The x-axis tb denotes the time of galaxies traced back from z to higher redshift. |
| In the text | |
Current usage metrics show cumulative count of Article Views (full-text article views including HTML views, PDF and ePub downloads, according to the available data) and Abstracts Views on Vision4Press platform.
Data correspond to usage on the plateform after 2015. The current usage metrics is available 48-96 hours after online publication and is updated daily on week days.
Initial download of the metrics may take a while.