Fig. 8.
Download original image
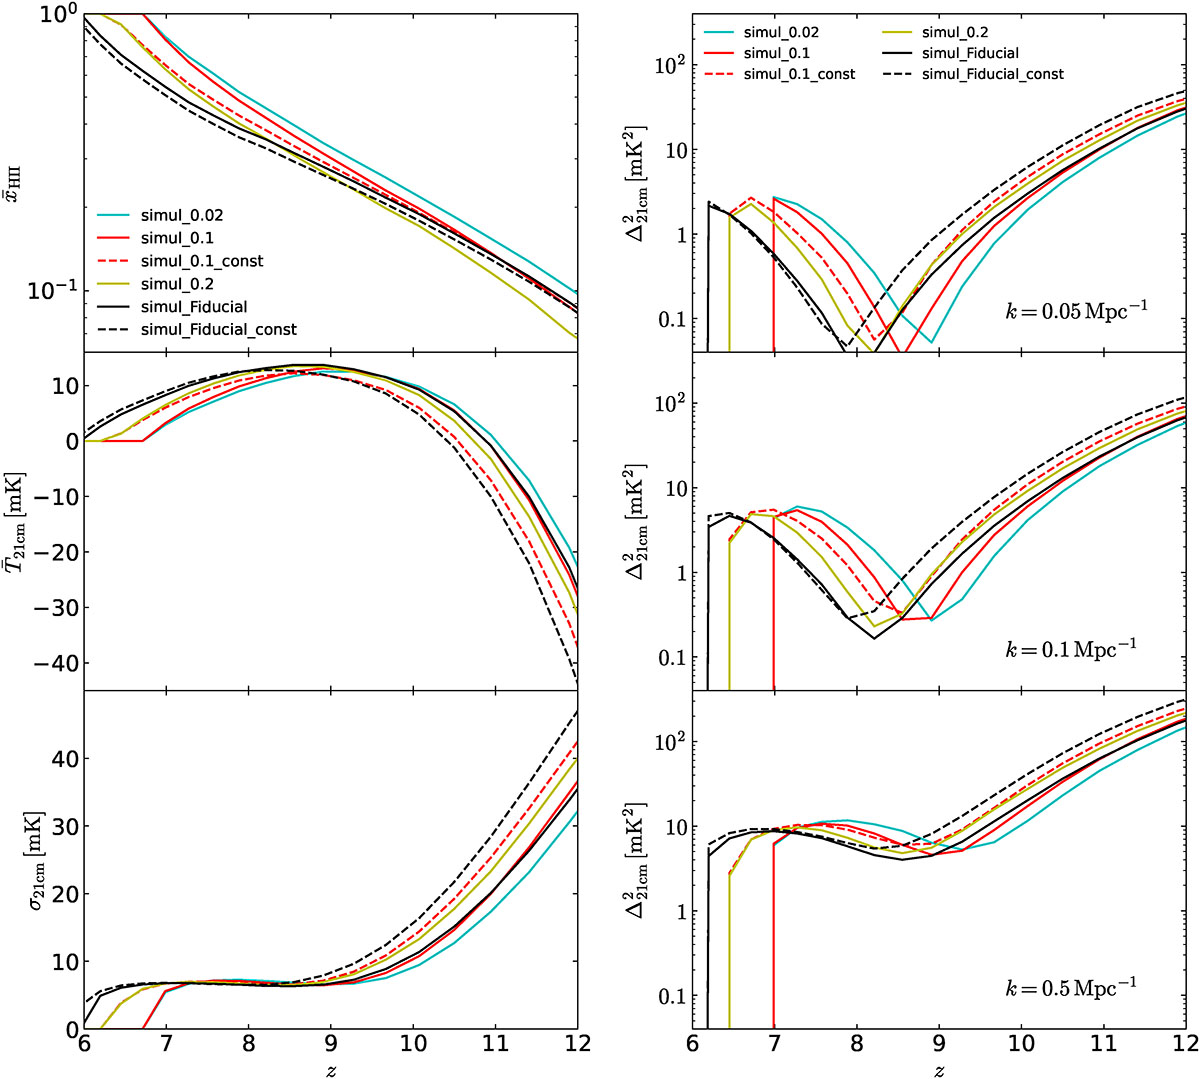
Left: Histories of volume-averaged mean ionization fraction ![]() (top), mean 21 cm DBT
(top), mean 21 cm DBT ![]() (central), and rms of 21 cm DBT σ21 cm (bottom) from simul_0.02 (solid cyan), simul_0.1 (solid red), simul_0.1_const (dashed red), simul_0.2 (solid yellow), simul_Fiducial (solid black), and simul_Fiducial_const (dashed black). Right: Redshift evolution of 21 cm power spectra Δ21 cm2 at k = 0.05 Mpc−1 (top), 0.1 Mpc−1 (central), and 0.5 Mpc−1 (bottom) from the same simulations.
(central), and rms of 21 cm DBT σ21 cm (bottom) from simul_0.02 (solid cyan), simul_0.1 (solid red), simul_0.1_const (dashed red), simul_0.2 (solid yellow), simul_Fiducial (solid black), and simul_Fiducial_const (dashed black). Right: Redshift evolution of 21 cm power spectra Δ21 cm2 at k = 0.05 Mpc−1 (top), 0.1 Mpc−1 (central), and 0.5 Mpc−1 (bottom) from the same simulations.
Current usage metrics show cumulative count of Article Views (full-text article views including HTML views, PDF and ePub downloads, according to the available data) and Abstracts Views on Vision4Press platform.
Data correspond to usage on the plateform after 2015. The current usage metrics is available 48-96 hours after online publication and is updated daily on week days.
Initial download of the metrics may take a while.