Open Access
Fig. 4.
Download original image
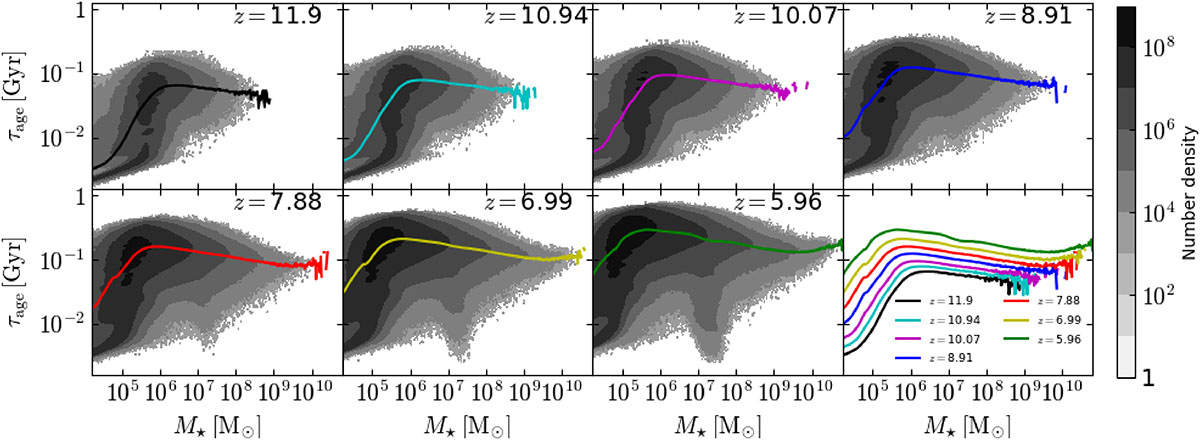
Distributions of stellar age τage vs. stellar mass M★ of galaxies at z = 11.9, 10.94, 10.07, 8.91, 7.88, 6.99, and 5.96, from left to right and top to bottom. The solid lines indicate the mean τage of galaxies within the same M★ bins, shown together for all redshifts in the bottom-right plot.
Current usage metrics show cumulative count of Article Views (full-text article views including HTML views, PDF and ePub downloads, according to the available data) and Abstracts Views on Vision4Press platform.
Data correspond to usage on the plateform after 2015. The current usage metrics is available 48-96 hours after online publication and is updated daily on week days.
Initial download of the metrics may take a while.