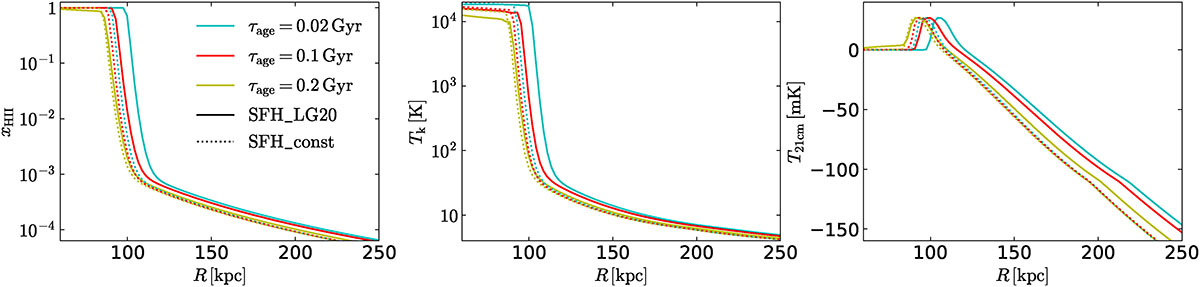
Fig. 6.
Download original image
2D distributions of gas temperature Tk vs. ionization fraction xHII from simulation simul_0.02, simul_0.1, simul_0.1_const, simul_0.2, simul_Fiducial, and simul_Fiducial_const at z = 10.07, from left to right and top to bottom. simul_0.1_const and simul_Fiducial_const have a constant SFR, while the others adopt the SFH obtained from LG20. The gray lines in the background denote Tk as a function of xHII from the 1D RT calculations.
Current usage metrics show cumulative count of Article Views (full-text article views including HTML views, PDF and ePub downloads, according to the available data) and Abstracts Views on Vision4Press platform.
Data correspond to usage on the plateform after 2015. The current usage metrics is available 48-96 hours after online publication and is updated daily on week days.
Initial download of the metrics may take a while.