| Issue |
A&A
Volume 708, April 2026
|
|
|---|---|---|
| Article Number | L17 | |
| Number of page(s) | 7 | |
| Section | Letters to the Editor | |
| DOI | https://doi.org/10.1051/0004-6361/202557472 | |
| Published online | 17 April 2026 | |
Letter to the Editor
Comparison of spectroscopic and photometric stellar parameter determination in carbon-enhanced metal-poor stars
Goethe University Frankfurt, Institute for Applied Physics, Max-von-Laue-Str. 12, 60438 Frankfurt am Main, Germany
★ Corresponding authors: This email address is being protected from spambots. You need JavaScript enabled to view it.
; This email address is being protected from spambots. You need JavaScript enabled to view it.
Received:
29
September
2025
Accepted:
6
February
2026
Abstract
Aims. The aim of this study is to evaluate the reliability of spectroscopic and photometric approaches for deriving stellar parameters in metal-poor stars, focusing on a carbon-enhanced metal-poor (CEMP) star with a well-studied very metal-poor star as reference.
Methods. The determination of stellar parameters is first based on spectroscopy, where parameters are derived from Fe line equivalent widths using the 1D local thermodynamical equilibrium (LTE) synthesis code pyMOOGi. The second approach is based on photometry, employing colour–Teff relations, Gaia parallaxes, and bolometric corrections.
Results. Analyses of the two stars reveal systematic discrepancies: photometric Teff, log(g), and [Fe/H] are higher than spectroscopic values. Offsets exceed uncertainties, mainly due to the limited Fe II line set and non-LTE effects in spectroscopy. Photometric based parameters prove more consistent and reliable, particularly when using (V–K) or (BP–K) colours.
Conclusions. These findings confirm previous results and demonstrate that photometric methods yield more reliable stellar parameters, especially for CEMP stars than 1D LTE spectroscopic methods.
Key words: techniques: photometric / techniques: spectroscopic / stars: atmospheres / stars: carbon / stars: fundamental parameters
© The Authors 2026
 Open Access article, published by EDP Sciences, under the terms of the Creative Commons Attribution License (https://creativecommons.org/licenses/by/4.0), which permits unrestricted use, distribution, and reproduction in any medium, provided the original work is properly cited.
This article is published in open access under the Subscribe to Open model. This email address is being protected from spambots. You need JavaScript enabled to view it. to support open access publication.
1. Introduction
Very old metal-poor stars preserve the chemical signatures of the first stellar generations and provide insights into the early Universe (Frebel & Norris 2015). Many of them exhibit enhanced carbon with strong CH G-band absorption and are classified as carbon-enhanced metal-poor (CEMP) stars. By definition, CEMP stars have [C/Fe]≥0.7 and [Fe/H]≤ − 2 (Aoki et al. 2007; Hansen et al. 2016a; Beers & Christlieb 2005) and are key to understanding early carbon enrichment and the first stellar populations (Hansen et al. 2016b). Determining the chemical composition of these stars requires a profound understanding of the physical conditions within their atmospheres. The structure of the stellar atmosphere is generally characterised by determining several stellar parameters: the effective temperature Teff, the surface gravity log(g), the metallicity [Fe/H], and the microturbulence ξ. Two common approaches to determine them are based on spectroscopy and photometry: via spectroscopy by measuring the equivalent widths (EWs) of Fe absorption lines and iteratively analysing them with a synthesis code until both excitation and ionisation equilibrium are achieved. Alternatively, photometric techniques estimate the Teff from colour indices using infrared flux method calibrations, determine surface gravity from Gaia parallaxes combined with bolometric corrections, and infer metallicity and microturbulence from Fe lines and empirical relations. Previous studies have shown that different methods can yield different results for certain stars. Mucciarelli et al. (2021) demonstrated that as metallicity decreases, the discrepancy between the two methods increases. This study examines how the two methods affect parameter determination for a CEMP star, using a very metal-poor reference star. Strong molecular bands introduce challenges that may bias each method differently.
2. Targets
The analysed CEMP star, BPS CS 29502-0092, is classified as a CEMP-no star due to the absence of r- and s-process element enrichment. Owing to the amount of information we have on HD140283 (e.g. interferometry, astrometry) it has well-constrained stellar parameters, and we thus use it as a C-normal reference. Both stars were observed at the 2.56 m Nordic Optical Telescope (NOT) located at La Palma, Spain using the FIbre-fed Echelle Spectrograph (FIES), which covers a spectral range of 3700–9000 Å1. HD 140283 was observed on July 25, 2023, with a resolving power of R = 67 000 and a signal-to-noise ratio of S/N ≈ 60 at 4000 Å. BPS CS 29502-0092 was observed three days later on July 28, 2023, at a lower resolving power of R = 25 000 and a S/N ≈ 45 at the same wavelength. The raw data were reduced using the FIEStool reduction pipeline. Subsequently, the spectra of both stars were continuum-normalised and corrected for wavelength shifts using IRAF.
3. Determination of the stellar parameters
The parameters of both stars were determined based on spectroscopy and photometry. First, a list of Fe lines was compiled (see Table A.1) suitable for C-normal (list1) and CEMP (list2) stars. We focused on two well-studied stars that, despite numerous studies, span an extreme parameter space of the same star in the literature, exceeding 1000 K, 2 dex (gravity), and 1 dex (metallicity). Here we look into possible reasons for this.
3.1. Spectroscopic method
In the spectroscopic method, the parameters can be determined from a detailed analysis of a star’s spectrum by using EWs of Fe lines. The selected spectral lines cover a wide wavelength range and a broad span of excitation potentials (χ) to ensure a reliable derivation of the stellar parameters. Particular attention was given to achieving sufficient statistics for Fe II lines, which are often weak and limited in metal-poor stars. The EWs were measured in IRAF. In particular, for CEMP stars, it was necessary to verify whether the spectral lines are affected by blends with carbon molecular bands, such as the CH G-band in the range 4280 − 4315 Å. In order to avoid contamination, a comprehensive list of carbon-enhanced spectral regions was generated in advance and Fe line measurements in these regions were excluded (see Appendix A). The abundances were computed using pyMOOGi (Adamow 2017), a Python interface to the 1D local thermodynamic equilibrium (LTE) spectral synthesis code (Sneden 1973, v. 2019). In addition to the line list, a model atmosphere is required to simulate the physical conditions in a star’s photosphere depending on the stellar parameters. We used interpolated 1D LTE ATLAS9 models2 (Castelli & Kurucz 2003) in the KURUCZ (Kurucz 1970) format, generated with the Xiru3 tool. We required the following: (i) Teff, which is determined by adjusting it until excitation equilibrium is reached, i.e. the derived Fe abundances show no trend with χ; (ii) log(g), which is determined by enforcing ionisation equilibrium such that the mean abundances from Fe I and Fe II lines agree log(εFeI) = log(εFeII); (iii) [Fe/H], which is taken as the mean iron abundance and is iterated until it matches the metallicity assumed in the model atmosphere; (iv) ξ, which is determined by adjusting it until there is no correlation between the Fe I abundances and line strength, owing to the fewer and often weak Fe II lines in cool CEMP stars. All the conditions were solved simultaneously and iteratively to yield consistent parameters.
3.2. Photometric method
The determination of stellar parameters can also be carried out based on photometry. This involves quantifying and analysing the brightness of a star by measuring the radiant flux in different wavelength ranges or filters.
Photometric temperatures can be derived from colour–Teff relations based on the infrared flux method (IRFM), which compares observed and theoretical bolometric-to-infrared flux ratios for given stellar parameters (Casagrande et al. 2010). The literature provides polynomial fits that connect de-reddened colour indices C0 with Teff. We considered (B − V), (V − K), and (J − K), adopting calibrations from Alonso et al. (1999), and (V − K) calibration also from Ramírez & Meléndez (2005). These colours have been extensively used for Teff determinations in CEMP stars. In addition, the colour–Teff relations based on (BP − RP) and (BP − K) from Mucciarelli et al. (2021) were applied as they provide Teff diagnostics using Gaia photometry. To apply the calibrations of Alonso et al. (1999), the 2MASS K and J magnitudes were transformed into the Johnson system using Bessell (2005), and then into the TCS system via the Alonso et al. (1998) relation. Since reddening is the main source of uncertainty in temperature estimates (Hansen 2011), the colour excess for each index was derived from the Bayestar 3D dust map (Green et al. 2019; Green 2018) and transformed into the respective photometric systems. The values employed for the determination of the photometric temperatures are provided in Appendix C. The log(g) was determined using corrected Gaia parallaxes (Gaia Collaboration 2023) by applying the classical relation log(g/g⊙) = log(M/M⊙) + 4 log(Teff/Teff, ⊙) + 0.4 (Mbol − Mbol, ⊙). A mass of M = 0.8 M⊙ was adopted for both stars, typical for metal-poor red giants in old stellar populations (Koch et al. 2016), and consistent with the recent result by Guillaume et al. (2024) for HD 140283 (M = 0.79 M⊙). The bolometric luminosity was derived using the bolometric corrections of Alonso et al. (1999). The metallicity was derived following the spectroscopic approach, where [Fe/H] was determined from the Fe II lines as these are less sensitive to the model atmosphere’s temperature structure and nearly unaffected by non-local thermodynamic equilibrium (NLTE) effects. The microturbulence ξ was determined following the empirical relation Mashonkina et al. (2017), based on the equation ξ = 0.14 − 0.08 ⋅ [Fe/H] + 4.90 ⋅ (Teff/104)−0.47 ⋅ log(g).
4. Results
4.1. Spectroscopic method
To derive the stellar parameters using the EW method, two separate line lists were created. They are provided in Appendix A. Line list 1 represents the initial line list of the star HD 140283, in which a large number of spectral lines were measured, resulting in a total of 161 lines (141 Fe I lines and 20 Fe II lines). Line list 2 is a refined version of this list. Lines that are blended with molecules or that could not be measured in the CEMP star due to the lower metallicity were removed. This reduced line list contains 70 lines in total (59 Fe I and 11 Fe II lines). Table 1 summarises the parameters obtained with the two lists, in combination with the number of lines used in each case.
Derived stellar parameters for HD 140283 and BPS CS 29502-0092 from spectroscopy, photometry, and the literature.
The comparison between the two line lists in the case of HD 140283 reveals deviations in all derived stellar parameters, though they agree within the uncertainties. The use of Line list 1, which includes the highest number of Fe I and Fe II lines, yields better agreement with the literature values from Guillaume et al. (2024) compared to Line list 2.
4.2. Photometric method
Here Teff was first derived from different colour indices. The reddening was determined to E(B − V) = 0 for HD 140283 and E(B − V) = 0.097 for BPS CS 29502-0092. Initial [Fe/H]= − 2.29 dex and −3.4 dex were adopted for HD 140283 (Guillaume et al. 2024) and BPS CS 29502-0092 (spectroscopy). Since the Alonso et al. (1999) relations are only valid for [Fe/H]> − 3.0 dex, Teff was interpolated between [Fe/H]= − 3.4 and −2.99, yielding only minor differences (0–23 K) and the subsequent analysis placed the star within their valid range.
As shown in Fig. 1, the derived temperatures vary with the adopted colour index. The largest deviation occurs in the infrared, particularly for (J–K) in both stars. For HD 140283, the mean temperature excluding (J–K) is  , while for BPS CS 29502-0092 it is
  . Each colour index has its advantages and limitations and will be discussed in the following. The colour index (B–V) is widely used, but is affected by several limitations. It depends strongly on metallicity, due to the dominance of iron lines (Alonso et al. 1996), and in carbon-rich stars, absorption in the CH G-band within the B filter can cause underestimated temperatures. Although the V filter partly compensates through coverage of C2 Swan bands, the effect remains significant. For BPS CS 29502-0092, this results in a lower Teff with ΔT(B − V) = 50 K, whereas HD 140283 shows a higher Teff with ΔT(B − V) = 60 K. These contrasting trends highlight that spectral features, especially from carbon, can systematically bias Teff determinations based on (B–V). The (BP–RP) index covers a broader spectral range than (B–V), though its calibrations are less precisely defined. The BP band includes CH-G and Swan bands, while RP is mainly affected by CN absorption. For BPS CS 29502-0092, the deviation is ΔT(BP − RP) = 23 K, and for HD 140283 only ΔT(BP − RP) = 7 K. Compared to (B–V), the smaller deviations suggest that the wider spectral coverage of (BP–RP) provides a more robust colour–temperature relation by reducing the relative impact of molecular bands. The (J–K) index lies in the infrared, where the metallicity and extinction effects are weaker (Hansen 2011), but its sensitivity to temperature is reduced because the two filters cover nearby wavelength regions. For both stars in this study, (J–K) produces significantly underestimated temperatures with respect to the average: ΔT = −425 K for HD 140283 and ΔT = −301 K for BPS CS 29502-0092, consistent with their observed colours being redder than expected. Spectral features may contribute to this effect since the J band includes the CN bandhead near 1.1 μm and the K band contains the CO bandhead near 2.3 μm. In the CEMP star, CO absorption could partly counteract the CN influence, leading to a somewhat smaller deviation than in HD 140283, although the discrepancy remains substantial in both stars. To test whether metallicity plays a role, (J–K) and (V–K) temperatures were also compared for two reference stars with higher metallicities and well-known Teff: HD 146233 and HD 103095 ([Fe/H] = 0.03 and [Fe/H] = −1.33; Soubiran et al. 2024). In both cases, (J–K) yielded lower Teff than (V–K), with the latter agreeing more closely with the literature values. This systematic underestimation of Teff by (J–K) is consistent with earlier findings by Alonso et al. (1999), who reported a larger scatter for (J–K) relative to other indices such as (V–K). In conclusion, the results show that (J–K) is not a reliable temperature indicator for these stars as it consistently underestimates Teff. (V–K) spans from the optical to the infrared and is highly sensitive to temperature, while being only mildly affected by blanketing effects and reddening (Alonso et al. 1996; Hansen 2011). For BPS CS 29502-0092 the deviations are small (ΔT(V − K) = 12 K with Alonso et al. (1999); ΔT(V − K) = 23 K with Ramírez & Meléndez), indicating good agreement with the mean Teff. For HD 140283 the deviations are slightly larger (ΔT(V − K) = 18 K with Alonso et al. (1999); ΔT(V − K) = 54 K with Ramírez & Meléndez 2005), but still show close consistency. (BP–K) covers a broad spectral range and, similarly to (V–K), is very sensitive to Teff, while only weakly affected by blanketing and reddening. For BPS CS 29502-0092, we find ΔT(BP − K) = 39 K, slightly higher than the mean Teff, likely due to absorption in the BP band from CH and C2. For HD 140283, the deviation is smaller (ΔT(BP − K) = 16 K), confirming the reliability of this index.
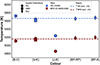 |
Fig. 1. Temperature variations across different colours for HD 140283 (blue) and BPS CS 29502-0092 (red). The circles, squares, and diamonds represent Teff derived from the relations of (Alonso et al. 1999, Alo), (Ramírez & Meléndez 2005, R&M), and (Mucciarelli et al. 2021, Muc), respectively. The dashed lines indicate the average Teff for each star, excluding (J − K). |
In summary, all colour indices except (J–K) show good agreement with the mean Teff. (B–V) deviates slightly more, but the effect of carbon bands is negligible. The indices based on Gaia filters display the smallest deviations, while (V–K) provides the best agreement for BPS CS 29502-0092, consistent with the literature (Bessell 2005). Between calibrations, Alonso et al. (1999) yields more consistent results than Ramírez & Meléndez (2005). Among the adopted indices, (V–K) and (BP–K) show the closest agreement. Although (BP–RP) deviates less, (BP–K) is preferred for its broader spectral coverage (Mucciarelli et al. 2021). (V–K) is characterised by a small internal scatter (Alonso et al. 1999), while a slightly larger dispersion is found for (BP–K) (Mucciarelli et al. 2021), leading us to adopt (V–K).
5. Discussion and conclusion
Table 1 summarises the stellar parameters of HD 140283 and BPS CS 29502-0092 derived from spectroscopic and photometric analyses. The comparison between the two methods reveals systematic discrepancies in the stellar parameter: photometric temperatures, gravities, and metallicities are consistently higher than spectroscopic values, with microturbulence being the only parameter in agreement. For the other stellar parameters of HD 140283, the offsets are 250 K, 1.05 dex, and 0.41 in Teff, log(g), and [Fe/H], respectively; for BPS CS 29502-0092, they reach 460 K, 1.47 dex, and 0.58. These differences exceed the estimated uncertainties, indicating the presence of inherent systematic biases in the methods.
In spectroscopy, the choice of line list is critical. Using a larger set of Fe I and Fe II lines (Line list 1) improves the consistency with the literature values, whereas the reduced Line list 2, adapted for the CEMP star by removing blended or weak lines, introduces larger uncertainties. The main limitation arises from the reduced number of Fe II lines. While the remaining Fe I lines still ensure statistical reliability, too few Fe II lines weaken the ionisation balance that is essential for determining log(g). As a result, even small deviations in oscillator strengths or equivalent width measurements can significantly affect the outcome. This issue is further amplified in CEMP stars, where molecular carbon bands overlap with many Fe II lines, further reducing reliability. Since stellar parameters are interdependent, uncertainties in log(g) propagate into the other parameters. Consequently, spectroscopic log(g) values are less robust, whereas photometric estimates, particularly when based on precise Gaia parallaxes, are less affected by these issues, and are therefore more reliable. NLTE effects increase this problem as Fe I lines are strongly affected, while Fe II lines remain nearly unchanged. For Line list 1, NLTE corrections shift [Fe/H] by 0.16 and log(g) by 0.35 dex, while for Line list 2 the shifts increase to 0.18 and 0.42 dex. This explains part of the discrepancy between photometric and spectroscopic parameters, particularly when using Line list 2, and is consistent with previous studies (Lind et al. 2012). In the photometric approach, NLTE effects are reduced by relying solely on Fe II lines. The limited number of lines slightly constrains [Fe/H], but deviations remain small, making the photometric parameters more robust. For further NLTE impact on stellar parameters, we refer to Hansen et al. (2013). Additional uncertainties in spectroscopy may arise from the use of 1D model atmospheres since 3D corrections could not be applied. Another error source is the visual placement of the continuum in EW measurements. A comparison with the Automatic Routine for line Equivalent widths in stellar Spectra (ARES) shows that visual continuum placement causes only a minor EW offset (−0.2 m Å) for this S/N thus making this effect negligible. In the photometric method, possible biases from carbon bands were evaluated (Sect. 4.2). Except for (J–K), all colour indices yielded consistent temperatures, with (V–K) and (BP–K) showing particularly strong agreement. The broad wavelength coverage of these indices effectively averages over molecular absorption features, ensuring reliable values.
Overall, the systematic offset between spectroscopic and photometric parameters is consistent with findings in the literature. Mucciarelli et al. (2021) report typical differences of 350 K in Teff, 1 dex in log(g), and 0.3 dex in [Fe/H], highlighting the inherent discrepancies between these two approaches. Our results confirm this trend and extend it to the CEMP star BPS CS 29502-0092, where the discrepancies are even more pronounced. Here the spectroscopic analysis is particularly affected by molecular features and the sensitivity to line selection. Similar effects are seen in other CEMP stars, as illustrated in Fig. E.1 (Appendix E) for both Teff and log(g). In Hollek et al. (2011) both parameters were derived spectroscopically, while in Roederer et al. (2014a,b), Teff was determined spectroscopically and log(g) was estimated from isochrones. For this work we recalculated these values using the photometric method and compared them with the literature results. The discrepancies between the methods are also evident in these cases, with the exception of two outliers for which the origin of the disagreement remains unclear. Given the identified sources of uncertainty in the spectroscopic approach, the photometric method may be preferable for determining stellar parameters in metal-poor stars, including CEMP stars, for example BPS CS 29502-0092.
Data availability
Table A.1 is available at the CDS via https://cdsarc.cds.unistra.fr/viz-bin/cat/J/A+A/708/L17.
Acknowledgments
This work was supported (in part) by the European Union (ChETEC-INFRA, project no. 101008324) and HFHF. We are grateful to A. Gallagher, L. Lombardo, and V. Tesic for discussions and help. The Image Reduction and Analysis Facility (IRAF) NOIRLab IRAF is distributed by the Community Science and Data Center at NSF NOIRLab.
References
- Adamow, M. M. 2017, AAS Meeting Abstr., 230, 216.07 [Google Scholar]
- Alonso, A., Arribas, S., & Martinez-Roger, C. 1996, A&A, 313, 873 [NASA ADS] [Google Scholar]
- Alonso, A., Arribas, S., & Martinez-Roger, C. 1998, A&AS, 131, 209 [NASA ADS] [CrossRef] [EDP Sciences] [Google Scholar]
- Alonso, A., Arribas, S., & Martínez-Roger, C. 1999, A&AS, 140, 261 [NASA ADS] [CrossRef] [EDP Sciences] [Google Scholar]
- Aoki, W., Beers, T., Christlieb, N., et al. 2007, ApJ, 655, 492 [NASA ADS] [CrossRef] [Google Scholar]
- Bard, A., & Kock, M. 1994, A&A, 282, 1014 [NASA ADS] [Google Scholar]
- Bard, A., Kock, A., & Kock, M. 1991, A&A, 248, 315 [NASA ADS] [Google Scholar]
- Beers, T. C., & Christlieb, N. 2005, ARA&A, 43, 531 [NASA ADS] [CrossRef] [Google Scholar]
- Bessell, M. S. 2005, ARA&A, 43, 293 [NASA ADS] [CrossRef] [Google Scholar]
- Blackwell, D. E., Petford, A. D., & Shallis, M. J. 1979, MNRAS, 186, 657 [NASA ADS] [CrossRef] [Google Scholar]
- Blackwell, D. E., Petford, A. D., Shallis, M. J., & Simmons, G. J. 1980, MNRAS, 191, 445 [Google Scholar]
- Blackwell, D. E., Petford, A. D., & Simmons, G. J. 1982, MNRAS, 201, 595 [NASA ADS] [CrossRef] [Google Scholar]
- Bridges, J. M., & Kornblith, R. L. 1974, ApJ, 192, 793 [Google Scholar]
- Casagrande, L., Ramírez, I., Meléndez, J., Bessell, M., & Asplund, M. 2010, A&A, 512, A54 [NASA ADS] [CrossRef] [EDP Sciences] [Google Scholar]
- Castelli, F., & Kurucz, R. L. 2003, IAU Symp., 210, A20 [Google Scholar]
- Cousins, A. W. J. 1984, South African Astron. Obs. Circular, 8, 59 [Google Scholar]
- Cutri, R. M., Skrutskie, M. F., van Dyk, S., et al. 2003, VizieR On-line Data Catalog: II/246 [Google Scholar]
- Frebel, A., & Norris, J. E. 2015, ARA&A, 53, 631 [NASA ADS] [CrossRef] [Google Scholar]
- Gaia Collaboration (Vallenari, A., et al.) 2023, A&A, 674, A1 [NASA ADS] [CrossRef] [EDP Sciences] [Google Scholar]
- Green, G. M. 2018, JOSS, 3, 695 [Google Scholar]
- Green, G. M., Schlafly, E., Zucker, C., Speagle, J. S., & Finkbeiner, D. 2019, ApJ, 887, 93 [NASA ADS] [CrossRef] [Google Scholar]
- Guillaume, C., Buldgen, G., Amarsi, A. M., et al. 2024, A&A, 692, L3 [NASA ADS] [CrossRef] [EDP Sciences] [Google Scholar]
- Hansen, C. J. 2011, Ph.D. Thesis, Ludwig-Maximilians-Universität München [Google Scholar]
- Hansen, C. J., Nordström, B., Bonifacio, P., et al. 2011, A&A, 527, A65 [NASA ADS] [CrossRef] [EDP Sciences] [Google Scholar]
- Hansen, C. J., Bergemann, M., Cescutti, G., et al. 2013, A&A, 551, A57 [NASA ADS] [CrossRef] [EDP Sciences] [Google Scholar]
- Hansen, C. J., Nordström, B., Hansen, T. T., et al. 2016a, A&A, 588, A37 [NASA ADS] [CrossRef] [EDP Sciences] [Google Scholar]
- Hansen, T. T., Andersen, J., Nordström, B., et al. 2016b, A&A, 588, A3 [NASA ADS] [CrossRef] [EDP Sciences] [Google Scholar]
- Hansen, C. J., Hansen, T. T., Koch, A., et al. 2019, A&A, 625, A120 [NASA ADS] [CrossRef] [EDP Sciences] [Google Scholar]
- Hollek, J. K., Frebel, A., Roederer, I. U., et al. 2011, ApJ, 742, 54 [NASA ADS] [CrossRef] [Google Scholar]
- Koch, A., McWilliam, A., Preston, G. W., & Thompson, I. B. 2016, A&A, 587, A124 [NASA ADS] [CrossRef] [EDP Sciences] [Google Scholar]
- Kurucz, R. L. 1970, SAO Special Report, Tech. Rep. 309, Smithsonian Astrophysical Observatory [Google Scholar]
- Lind, K., Bergemann, M., & Asplund, M. 2012, MNRAS, 427, 50 [Google Scholar]
- Mashonkina, L., Jablonka, P., Pakhomov, Y., Sitnova, T., & North, P. 2017, A&A, 604, A129 [NASA ADS] [CrossRef] [EDP Sciences] [Google Scholar]
- Meléndez, J., & Barbuy, B. 2009, A&A, 497, 611 [NASA ADS] [CrossRef] [EDP Sciences] [Google Scholar]
- Molaro, P., Aguado, D. S., Caffau, E., et al. 2023, A&A, 679, A72 [NASA ADS] [CrossRef] [EDP Sciences] [Google Scholar]
- Mucciarelli, A., Bellazzini, M., & Massari, D. 2021, A&A, 653, A90 [NASA ADS] [CrossRef] [EDP Sciences] [Google Scholar]
- O’Brian, T. R., Wickliffe, M. E., Lawler, J. E., Whaling, W., & Brault, J. W. 1991, J. Opt. Soc. Am. B Opt. Phys., 8, 1185 [Google Scholar]
- Raassen, A. J. J., & Uylings, P. H. M. 1998, J. Phys. B Atom. Mol. Opt. Phys., 31, 3137 [Google Scholar]
- Ramírez, I., & Meléndez, J. 2005, ApJ, 626, 465 [Google Scholar]
- Roederer, I. U., Preston, G. W., Thompson, I. B., Shectman, S. A., & Sneden, C. 2014a, ApJ, 784, 158 [NASA ADS] [CrossRef] [Google Scholar]
- Roederer, I. U., Preston, G. W., Thompson, I. B., et al. 2014b, AJ, 147, 136 [Google Scholar]
- Rossi, S., Beers, T. C., Sneden, C., et al. 2005, AJ, 130, 2804 [NASA ADS] [CrossRef] [Google Scholar]
- Schnabel, R., Schultz-Johanning, M., & Kock, M. 2004, A&A, 414, 1169 [NASA ADS] [CrossRef] [EDP Sciences] [Google Scholar]
- Siqueira-Mello, C., Andrievsky, S. M., Barbuy, B., et al. 2015, A&A, 584, A86 [NASA ADS] [CrossRef] [EDP Sciences] [Google Scholar]
- Sneden, C. A. 1973, Ph.D. Thesis, The University of Texas at Austin, USA [Google Scholar]
- Soubiran, C., Creevey, O. L., Lagarde, N., et al. 2024, A&A, 682, A145 [NASA ADS] [CrossRef] [EDP Sciences] [Google Scholar]
- Spite, M., Caffau, E., Bonifacio, P., et al. 2013, A&A, 552, A107 [NASA ADS] [CrossRef] [EDP Sciences] [Google Scholar]
The observations were carried out as part of the ChETEC-INFRA Summer School 2023.
Appendix A: Line lists
Line list including wavelength, excitation potential, oscillator strength, and equivalent widths for HD 140283 (EWHD) and BPS CS 29502-0092 (EWBPS), together with the corresponding references.
Appendix B: Diagnostic plots of HD 140283 and BPS CS 29502-0092 for spectroscopic stellar parameters
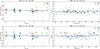 |
Fig. B.1. Graphical outputs from pyMOOGi using the abfind driver. Panel (a): Abundance vs excitation potential of HD 140283. Panel (b): Abundance vs reduced equivalent width of HD 140283. Panel (c): Abundance vs excitation potential of BPS CS 29502-0092. Panel (d): Abundance vs reduced equivalent width of BPS CS 29502-0092. The input stellar parameters for the star HD 140283 are Teff = 5400 K, log(g) = 2.6 dex, [Fe/H] = −2.9, and ξ = 1.45 km/s and for the star BPS CS 29502-0092 Teff = 4680 K, log(g) = 1.1 dex, [Fe/H] = −3.4, and ξ = 1.40 km/s. |
Appendix C: Values for photometric temperatures of HD 140283 and BPS CS 29502-0092
Input photometric values from the literature for the effective temperature determination of HD 140283 and BPS CS 29502-0092 taken from SIMBAD.
Appendix D: Uncertainty estimation of stellar parameters
Spectroscopic stellar parameter uncertainties were determined using the equivalent-width method by defining tolerance thresholds for the diagnostic slopes associated with each parameter. These thresholds quantify how much a parameter can vary before producing a significant deviation in its corresponding slope. The slope sensitivities were calibrated using the reference star HD 140283 by varying one parameter at a time. A change of ΔT = 100 K results in a variation of 0.02 in the excitation potential slope and was adopted as the temperature uncertainty. Similarly, Δlog(g) = 0.23 dex produces a change of 0.1 in the ionisation balance, Δξ = 0.15 km/s leads to a variation of 0.075 in the reduced equivalent width slope, and the metallicity uncertainty was estimated from the standard deviation of the iron abundances. The final stellar parameters were obtained iteratively by requiring all slopes to remain within these tolerances. Since the stellar parameters are interdependent, their mutual influence was also examined by varying each parameter within its uncertainty range and quantifying the induced changes in the others. Temperature and microturbulence show the strongest coupling, while metallicity is only weakly affected. The resulting uncertainties due to parameter interdependence were computed by adding the individual contributions in quadrature. In addition, we tested the influence of having different high-resolution FIES spectra, namely R = 67.000 and R = 25.000. For this test we convolved the original HD140283 spectrum to R = 25.000 and remeasured all Fe I lines in list1. The original values were 5500K, 2.9dex, -2.8dex, and 1.4km/s (T, logg, [Fe/H], Vmic), while the newly convolved R = 25.000 spectrum led to 5600, 2.9, -2.72, 1.5, i.e. all within the original uncertainties; we assign the slight difference to the exact continuum placement. We therefore find that there is no significant difference between these two high-resolution spectra. In addition, we indirectly tested for blends by checking the FWHM of all lines used. Lines of similar strength were required to have consistent FWHM values (within 2σ); lines showing unusually large FWHM, potentially caused by blends or saturation, were therefore removed from the line list.
The uncertainties of the photometrically derived stellar parameters are based on the (V − K) colour index. The effective temperature uncertainty includes contributions from the calibration of the empirical relation (ΔTeq = 40 K), the colour excess, and photometric errors, while the influence of metallicity is negligible. Reddening represents the dominant source of uncertainty. Combining all contributions in quadrature yields total temperature uncertainties of ΔT = 130 K for HD 140283 and ΔT = 120 K for BPS CS 29502–0092. The uncertainty in surface gravity log(g) includes contributions from temperature, stellar mass, extinction, and parallax, with metallicity again having a negligible effect. The final uncertainties are Δlog(g) = 0.08 dex for HD 140283 and Δlog(g) = 0.09 dex for BPS CS 29502–0092. As in the spectroscopic analysis, the metallicity uncertainty is given by the standard deviation of the iron abundances, yielding Δ[Fe/H] = 0.10 for both stars. The microturbulence velocity ξ was estimated using both the reduced equivalent width slope criterion and an empirical relation, resulting in a final uncertainty of Δξ = 0.10–0.15 km s−1, with temperature being the dominant source of uncertainty. For both stars and for both methods, the microturbulence ξ is determined from Fe I lines and also estimated using the empirical equation following Mashonkina et al. (2017). For both stars, the values obtained from this empirical relation agree within the combined errors with those derived from the Fe I lines.
Appendix E: Photometric versus spectroscopic parameters of CEMP stars
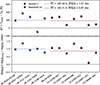 |
Fig. E.1. Comparison of the effective temperature and surface gravity values for different CEMP stars, as determined using the photometric method described in this work, with spectroscopic values from the literature. The reference values were taken from Hollek et al. (2011) and Roederer et al. (2014a,b). |
All Tables
Derived stellar parameters for HD 140283 and BPS CS 29502-0092 from spectroscopy, photometry, and the literature.
Line list including wavelength, excitation potential, oscillator strength, and equivalent widths for HD 140283 (EWHD) and BPS CS 29502-0092 (EWBPS), together with the corresponding references.
Input photometric values from the literature for the effective temperature determination of HD 140283 and BPS CS 29502-0092 taken from SIMBAD.
All Figures
|
Fig. 1. Temperature variations across different colours for HD 140283 (blue) and BPS CS 29502-0092 (red). The circles, squares, and diamonds represent Teff derived from the relations of (Alonso et al. 1999, Alo), (Ramírez & Meléndez 2005, R&M), and (Mucciarelli et al. 2021, Muc), respectively. The dashed lines indicate the average Teff for each star, excluding (J − K). |
| In the text | |
|
Fig. B.1. Graphical outputs from pyMOOGi using the abfind driver. Panel (a): Abundance vs excitation potential of HD 140283. Panel (b): Abundance vs reduced equivalent width of HD 140283. Panel (c): Abundance vs excitation potential of BPS CS 29502-0092. Panel (d): Abundance vs reduced equivalent width of BPS CS 29502-0092. The input stellar parameters for the star HD 140283 are Teff = 5400 K, log(g) = 2.6 dex, [Fe/H] = −2.9, and ξ = 1.45 km/s and for the star BPS CS 29502-0092 Teff = 4680 K, log(g) = 1.1 dex, [Fe/H] = −3.4, and ξ = 1.40 km/s. |
| In the text | |
|
Fig. E.1. Comparison of the effective temperature and surface gravity values for different CEMP stars, as determined using the photometric method described in this work, with spectroscopic values from the literature. The reference values were taken from Hollek et al. (2011) and Roederer et al. (2014a,b). |
| In the text | |
Current usage metrics show cumulative count of Article Views (full-text article views including HTML views, PDF and ePub downloads, according to the available data) and Abstracts Views on Vision4Press platform.
Data correspond to usage on the plateform after 2015. The current usage metrics is available 48-96 hours after online publication and is updated daily on week days.
Initial download of the metrics may take a while.