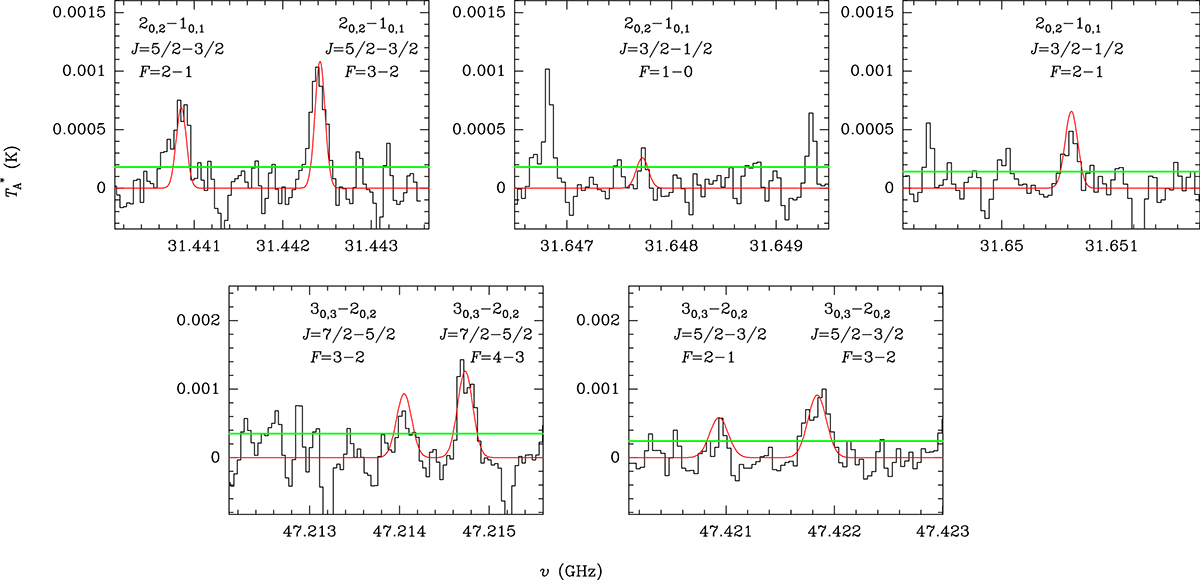
Fig. 1.
Download original image
Observed lines of HS2 in TMC-1 in the 31.0–50.4 GHz range. Quantum numbers are indicated in each panel. The red line shows the LTE synthetic spectrum from a fit to the observed line profiles. The negative features are created in the folding of the frequency switching data. The horizontal green line indicates the 3σ noise level.
Current usage metrics show cumulative count of Article Views (full-text article views including HTML views, PDF and ePub downloads, according to the available data) and Abstracts Views on Vision4Press platform.
Data correspond to usage on the plateform after 2015. The current usage metrics is available 48-96 hours after online publication and is updated daily on week days.
Initial download of the metrics may take a while.