| Issue |
A&A
Volume 699, July 2025
|
|
|---|---|---|
| Article Number | L5 | |
| Number of page(s) | 5 | |
| Section | Letters to the Editor | |
| DOI | https://doi.org/10.1051/0004-6361/202554985 | |
| Published online | 01 July 2025 | |
Letter to the Editor
From moving groups to star formation in the solar neighborhood
1
University of Vienna, Department of Astrophysics, Türkenschanzstrasse 17, 1180 Wien, Austria
2
Department of Astronomy, University of Wisconsin-Madison, 475 North Charter Street, Madison, WI 53706, USA
3
INAF – Osservatorio Astrofisico di Torino, Via Osservatorio 20, 10025 Pino Torinese, (TO), Italy
⋆ Corresponding author: This email address is being protected from spambots. You need JavaScript enabled to view it.
Received:
1
April
2025
Accepted:
16
May
2025
Abstract
Moving groups in the solar neighborhood are ensembles of commoving stars, likely originating due to forces from spiral arms, the Galactic bar, or external perturbations. Their comovement with young clusters indicates recent star formation within these moving groups, but a lack of precise 3D position and velocity measurements has obscured this connection. Using backward orbit integrations of 509 clusters within 1 kpc–based on Gaia DR3 and supplemented with APOGEE-2 and GALAH DR3 radial velocities–we traced their evolution over the past 100 Myr. We find that most clusters separate into three spatial groups that each trace one of the Pleiades, Coma Berenices, and Sirius moving groups. The same trend is not seen for the Hyades moving group. The young clusters of the Alpha Persei, Messier 6, and Collinder 135 families of clusters, previously found to have formed in three massive star-forming complexes, commove with either the Pleiades (Alpha Persei and Messier 6) or the Coma Berenices (Collinder 135). Our results provide a sharper view of how large-scale Galactic dynamics have shaped recent, nearby star formation.
Key words: Galaxy: kinematics and dynamics / open clusters and associations: general / solar neighborhood / Galaxy: structure
© The Authors 2025
 Open Access article, published by EDP Sciences, under the terms of the Creative Commons Attribution License (http://creativecommons.org/licenses/by/4.0), which permits unrestricted use, distribution, and reproduction in any medium, provided the original work is properly cited.
1. Introduction
Building on the foundational work of Proctor (1870) and Kapteyn (1905), Olin J. Eggen (Eggen 1983, 1996) extensively cataloged commoving stellar associations, termed stellar streams, with those observable in the solar neighborhood referred to as classical “moving groups” (hereafter, simply “moving groups”). The main moving groups in the solar neighborhood include the Pleiades group (also known as the “Local Association”), the Hyades group, the Coma Berenices group, and the Sirius group (Ursa Major). Each was initially proposed to originate from a dissolving open cluster or massive association (Eggen 1983), a concept referred to hereafter as the “birth scenario”.
Studies using precise astrometric data from missions like HIPPARCOS and Gaia have confirmed the presence and internal structure of moving groups (Chen et al. 1997; Dehnen 1998; Gaia Collaboration 2018) but also challenged their origin as coeval birth associations due to stellar age heterogeneity. For instance, Famaey et al. (2008) showed that most stars in the Pleiades moving group do not share the cluster’s age, ruling out a common origin. Numerous observational and numerical studies now suggest that classical moving groups are primarily kinematic structures spanning broad age ranges (several Gyr) likely shaped by internal disk dynamics such as spiral arms, the Galactic bar, and their resonances (Dehnen 2000; Quillen et al. 2018; Barros et al. 2020; Minchev et al. 2010; Sellwood et al. 2019; Bernet et al. 2024; Li et al. 2025)–and/or external perturbations from satellite galaxies (Craig et al. 2021).
A central question concerning moving groups is how and why they include recently formed stars among their members. Recently, Quillen et al. (2020) linked recent star formation within 150 parsecs to the dynamics of the moving groups, suggesting that large-scale perturbations, such as those from spiral arms, play a role in shaping the kinematics and spatial distributions of young stars. Gaia Data Release 2-based (DR2-based) studies also suggest clusters may trace moving groups (Soubiran et al. 2018; Tarricq et al. 2021). Progress now hinges on extending this analysis to a larger, more precise sample enabled by recent star cluster catalogs with precise 3D velocities out to 1 kpc (Hunt & Reffert 2023).
In this Letter we study a sample of star clusters with precise 3D velocity measurements extending to distances of 1 kpc from the Sun. We trace their orbital histories and find clear associations with the prominent moving groups in the solar neighborhood. We first describe our dataset and selection methods, then detail our orbital integration and clustering techniques, and finally discuss the implications of linking cluster formation and recent star formation history to the large-scale dynamical evolution of the Galactic disk and interstellar medium.
2. Data
We used the Gaia DR3-constructed (Gaia Collaboration 2023a) catalog from Hunt & Reffert (2023), which uncovered 7167 Galactic star clusters using the Hierarchical Density–Based Spatial Clustering of Applications with Noise (HDBSCAN) algorithm (McInnes et al. 2017). Although many nearby young clusters are no longer gravitationally bound (Hunt & Reffert 2024), we refer to them as “clusters”, since they are each composed of stars that share a common origin and remain at least kinematically clustered.
Swiggum et al. (2024, hereafter, S24) cross-matched cluster members from Hunt & Reffert (2023) with the seventeenth data release from the Apache Point Observatory Galactic Evolution Experiment 2 (APOGEE-2; Abdurro’uf et al. 2022) and the third data release of the Galactic Archaeology with HERMES (GALAH; Buder et al. 2021) to supplement Gaia DR3 radial velocities. They selected a high-quality subsample of nearby clusters (with heliocentric Cartesian coordinates: −1000 < x, y < 1000 pc and −300 < z < 300 pc) with reliable 3D velocities (U, V, W), yielding 764 clusters before age cuts. From these, they retained 254 young clusters (age < 70 Myr) and added 27 young local associations (YLAs)1 from Gagné et al. (2018). S24 found that most (155) clusters group into three families–Collinder 135 (39 clusters), Messier 6 (34 clusters), and Alpha Persei (82 clusters)–each converging to a former, massive star-forming complex. We used the positions, velocities, and ages of these 155 clusters, with S24’s computed errors, in our analysis.
To investigate whether the cluster families show comovement with older clusters, we select an additional subset of clusters from the high quality sample of 764 clusters mentioned above, but with ages older than the cluster families (> 70 Myr). This subset contains 509 clusters, with a median age of 153 Myr and (U, V, W) velocity uncertainties of (0.79, 0.81, 0.22) km s−1.
3. Methods and results
3.1. Computing orbital trace-backs
Following S24, we used the galpy (Bovy 2015) and MWPotential2014 models–comprising disk, bulge, and halo components–to integrate cluster orbits backward in time. We adopted a circular velocity of 236 km s−1, a solar Galactocentric radius of R⊙ = 8122 pc (Reid et al. 2019), and a solar height of z = 20.8 pc (Bennett & Bovy 2019). Cluster orbits are initialized with present-day heliocentric Cartesian positions (x, y, z) and velocities (U, V, W), corrected to the local standard of rest using solar peculiar motion (U⊙, V⊙, W⊙) = (11.1, 12.24, 7.25) km s−1 (Schönrich et al. 2010).
We integrated orbits 100 Myr into the past with 0.1 Myr time steps, balancing reliability against growing uncertainties from measurement errors (e.g., 1 km s−1 translates to roughly 100 pc at 100 Ma) and unmodeled effects such as spiral arm interactions. For the Collinder 135 (Cr135), Messier 6 (M6), and Alpha Persei (αPer) cluster families, we computed bulk orbits by taking the median (x, y, z) positions of member clusters at each time step. Time steps earlier than the birth of a cluster family approximate the motion of its natal molecular cloud(s). We include error bars showing spatial dispersion among member clusters.
3.2. Examining cluster orbits
Figure 1 shows the past Galactic XY positions of the older cluster sample (gray points) with ages between 70 and 150 Myr, highlighting their locations at the present day, 30 Myr ago, and 70 Myr ago. The median cluster family locations are overplotted at each timestep. Beginning around t = 70 Myr, the clusters separate into three distinct overdensities. Although our full sample of “older” clusters includes those older than 150 Myr, we focus on the 70−150 Myr range in this figure, where the overdensities are most clearly and, curiously, apparent; older clusters tend to blur these features. Notably, the young families appear within two of the older overdensities in Fig. 1. From t = 70 Myr ago (Ma) to the present, the αPer and M6 families traveled radially outward (away from the Galactic center) with a group of older clusters, while the Cr135 family moved slightly inward with a different group. This radial motion was calculated by S24 as ΔR ≈ 400 pc for the αPer and M6 families, and ΔR ≈ −250 pc for the Cr135 family over a similar 60 Myr time-span.
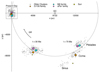 |
Fig. 1. Galactic bird’s-eye (XY) view of the clusters’ orbits over time, showing more than half of a circle (dashed black line) with a radius of RSun = 8122 pc, extending from the Galactic center to the Sun. The location of the Galactic center and the direction of Galactic rotation are indicated. Individual clusters with ages between 70 and 150 Myr are represented as gray dots and are shown at three different times: the present (upper left), 30, and 70 million years ago (Ma), from left to right. The median location of each cluster family is displayed at the three time steps, with each family color-coded and labeled in the legend. The black bars for a given family indicate the standard deviation of its members’ positions at each time step. Average positional uncertainties of the older clusters are too small to show, but at t = −70 Myr they reach 60 pc, slightly smaller than the gray point sizes. The 3D interactive version of this figure has a time-slider showing the cluster positions at intermediate time steps with each frame centered on the location of the local standard of rest (LSR): https://cswigg.github.io/cam_website/interactive_figures/swiggum+25_interactive_figure1.html |
A key distinction between the young cluster families from S24 and the older cluster overdensities seen here is that the former converge near their formation times, implying a common origin in the same gas complex. This is evident in the interactive version of Fig. 1, where the individual clusters of the families are shown and this convergence can be seen. The older overdensities at t = 70 Ma (Fig. 1), by contrast, consist of commoving clusters that do not necessarily converge or share a common formation origin, but rather a common dynamical origin. Still, since most clusters are younger than a Galactic orbit (200 Myr), and the overdensities are most prominent in the 70−150 Ma range, it is plausible that some clusters in this older sample originated from the same natal region, suggesting that they belong to older cluster families. Identifying older cluster families requires improved observational constraints and is limited by our knowledge of the Galactic potential (Arunima et al. 2025).
3.3. Identifying cluster groups with HDBSCAN
We robustly select cluster members of the three spatial overdensities (hereafter, “groups”) visible in Fig. 1 by employing the method of S24. At each time step from t = 50 million years ago (Ma) – when the spatial groups first become visually apparent in the cluster orbits – to t = 100 Ma, we applied the HDBSCAN clustering algorithm (McInnes et al. 2017) to the clusters’ 3D positions. We find that setting min_cluster_size to 30 and cluster_selection_method to “leaf” recovers these groups. At each time step, HDBSCAN assigns each star cluster as either a member of an identified group or as “noise”. To determine the final group membership, we computed the most frequently assigned label for each cluster across all time steps and assigned this label as its final group. This process is repeated 100 times, with each iteration randomly sampling from the position and velocity uncertainties of the star clusters. Using these parameters, we consistently recover three distinct groups, with no additional groups detected. Changing the value of the min_cluster_size can affect the number of recovered groups, but since our goal is to robustly and reproducibly recover the three groups visible by eye, we do not explore this parameter extensively.
We report the statistics of these groups in Table 1. In the following section, we show that these groups become visually apparent Sect. 3.4 in the past, as they each trace one of the Pleiades, Coma Berenices, and Sirius moving groups, consisting of 154, 100, and 44 clusters, respectively, from the initial sample of 509 clusters.
Moving group cluster statistics.
3.4. Examining velocities and actions
The HIPPARCOS and Gaia missions have revealed kinematic substructures in the solar neighborhood, especially in radial versus tangential velocities (VR − Vϕ) (Dehnen & Binney 1998; Gaia Collaboration 2018; Lucchini et al. 2022; Bernet et al. 2022). We queried the Gaia database for stars with measured radial velocities and high-quality parallaxes within 300 pc (d ≈ 1/ϖ) of the Sun and converted their International Celestial Reference System (ICRS) coordinates to a Galactocentric cylindrical frame using astropy.coordinates (Astropy Collaboration 2022). The same process was applied to our older cluster sample and cluster families, yielding positions (R, ϕ, z) and velocities (VR, Vϕ, Vz) (corrected for solar motion; see Sect. 3.1).
The distribution of azimuthal (Jϕ) and radial (JR) actions, where Jϕ is angular momentum and JR traces orbital eccentricity (Trick et al. 2019), offers another way to identify moving groups (Coronado et al. 2022; Fürnkranz et al. 2024). In our axisymmetric potential (MWPotential2014), actions computed during orbital integrations are displayed in the second row of Fig. 2.
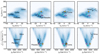 |
Fig. 2. Top row: 2D histogram (VR − Vϕ; white-to-blue color map) showing the distribution of roughly 1.8 million stars within 300 pc, revealing arch-like overdensities corresponding to the Pleiades, Coma Berenices, and Sirius moving groups (labeled in the first panel). The second to fourth panels overlay black dots for clusters older than 70 Myr, each showing one HDBSCAN-identified group. Panels two and three include only clusters within 300 pc to match the stellar volume. Panel four shows a group extending to 500 pc, with clusters beyond 300 pc marked as crosses. Each group aligns with a distinct moving group. Bulk velocities of the αPer (violet), M6 (cyan), and Cr135 (orange) families are shown with standard deviation error bars. Bottom row: Same as the top row, but showing |

In the top row of Fig. 2, a 2D histogram of the VR − Vϕ plane for nearby stars shows three arch-shaped overdensities. These arches correspond to the Hyades, Pleiades, Coma Berenices, and Sirius (Ursa Major) moving groups, although only three cluster groups (overlaid in subsequent panels) align with the arches–namely, the Pleiades, Coma, and Sirius groups. The bottom row displays the Jϕ − JR distribution, where moving groups appear as diagonal overdensities. Clusters in the second and third columns are restricted to 300 pc (matching the star sample), while those in the fourth column extend to 500 pc due to their scarcity within 300 pc.
Each cluster group aligns with one of the three velocity arches, as labeled in Fig. 1. The median VR − Vϕ velocities of the cluster families are shown, with the αPer and M6 families overlapping the Pleiades arch, albeit offset toward higher circular velocities. Although the Hyades cluster (Melotte 25) appears in the star sample, it is not recovered as part of any cluster group; its region is weak in the clusters’ distribution, although some contribution from the Hyades moving group is suggested in the distribution of actions. Consequently, we refer to these clusters as the Pleiades moving group, while acknowledging possible “contamination” from the Hyades. The Cr135 family appears associated with the Coma moving group. While the Sirius moving group is traced by the older cluster sample, none of the three young cluster families overlap with the group. This is also seen in Fig. 1, where none of the families (colored points) commove with the older clusters (gray points).
4. Discussion and summary
To summarize, our results link recent star formation to the complex velocity structure driven by large-scale Galactic dynamics. The three cluster families from S24 likely formed in large star-forming complexes within 1 kpc over the past 70 Myr, shaping and driving energy and momentum into the interstellar medium via stellar feedback (e.g. Soler et al. 2025). In this Letter, we find that the Alpha Persei and Messier 6 families align with the Pleiades moving group, whereas the Collinder 135 family aligns with the Coma Berenices group. Notably, the clusters do not closely follow the Hyades moving group, nor is the Hyades cluster recovered in our HDBSCAN analysis.
Moving groups have long been known to host young stars and clusters (e.g., Eggen 1983; Soubiran et al. 2018). Using our ability to trace cluster motions backward in time (Fig. 1), we link young clusters to these groups. The three cluster families likely formed in massive star-forming complexes whose inherited motions, shaped by Galactic-scale perturbations, align with older clusters influenced by the same forces. These older clusters form three past overdensities corresponding to the Pleiades, Coma Berenices, and Sirius groups (Fig. 2). Although Eggen’s coeval formation model is insufficient, we argue it remains relevant: young clusters forming within giant gas complexes – initially commoving with older stars of the moving group – drift apart after expelling their natal gas via stellar feedback. This is in agreement with Liang et al. (2024), who find evidence of enhanced star formation in the groups.
The Pleiades moving group (or “Local Association”) includes young stars spanning 5 − 120 Myr – too broad for a single coeval origin (Fernández et al. 2008). Sco-Cen, IC 2602, the Alpha Persei cluster (Melotte 20), and the Pleiades cluster have long been recognized as notable members (Eggen 1983). Backward integration of the Alpha Persei family by S24 reveals that its youngest members – Sco-Cen and Taurus – converge with the 60 Myr-old Alpha Persei cluster, suggesting a sequential formation scenario within a single gas complex. This process may have been driven by feedback-induced bubbles from earlier generations of clusters, which collapse and trigger new star formation (Elmegreen & Lada 1977). In contrast, older commoving clusters such as the Pleiades likely did not form in this complex but share similar kinematics due to their moving group membership. As discussed in Sect. 3, older cluster families might exist among the 70 − 150 Myr old clusters, but shared origins over 100 Ma are harder to confirm due to increasing uncertainties with time.
The kinematic coherence of the Alpha Persei and M6 cluster families, their nearly simultaneous star formation onset around 60 Myr ago, and their connection to older clusters in the Pleiades moving group suggest a shared formation mechanism, possibly driven by spiral arm dynamics. Considering a simple model, gas entering a spiral arm is slowed by gravitational torques and pressure forces, leading to density enhancements that trigger star formation. Newly formed stars inherit the gas velocity and eventually settle in stable orbits with reduced radial velocities relative to the Galactic center, drifting outward over 60 − 120 Myr while maintaining similar azimuthal speeds. The radial velocities for the Alpha Persei family, the M6 family, and older Pleiades group clusters are typically between 5 − 6 km s−1. According to the latest data of the Milky Way having a bar with a pattern speed of ∼39 km s−1 kpc−1 (Gaia Collaboration 2023b), the 4:1 resonance of a spiral pattern of 18 − 20 km s−1 kpc−1 is likely to be located at approximately 7.5 kpc (Quillen & Minchev 2005) inside the solar Galactocentric radius. This resonance, likely associated with the Carina arm, could become a natural site for gas compression and cluster formation.
Spiral shock scenarios have previously been considered for many of the YLAs–most of which are members of the Alpha Persei family–by Quillen et al. (2020), and also for the Sco-Cen complex, likewise part of the Alpha Persei family, by Fernández et al. (2008). Recent findings that the solar neighborhood is currently close to the co-rotation radius of the spiral pattern might also explain why the moving groups persist to ages up to several Gyr, much older than the clusters considered in our work (Barros et al. 2020).
Alternatively, resonance trapping could maintain stellar orbits in stable configurations near specific resonances. Given the Milky Way’s bar pattern speed, its outer Lindblad resonance (OLR) is located far beyond the solar neighborhood (Portail et al. 2017; D’Onghia & Aguerri 2020; Lucchini et al. 2024). However, the 4:1 resonance associated with the Carina arm at 7.5 kpc, in addition to determining where star formation is enhanced, might also play a role in trapping stellar systems. At a 4:1 resonance, the condition is given by

where Ωr is the radial oscillation frequency and Ωϕ is the azimuthal frequency. Moreover, if the orbital frequencies follow power-law relations, one expects a correlation in the orbital actions such that

with α and β describing the Galactic potential. However, Fig. 2 shows that the orbital actions for these clusters do not show such clear correlations between Jr and Jϕ, suggesting that resonance trapping is unlikely to explain their coherent kinematics. Instead, transient spiral arm features, which briefly compress gas and then locally dissolve (D’Onghia et al. 2013), provide a more natural explanation for the similarities observed.
While we have not considered external perturbations, they are thought to be relevant for the local vertical phase-space structure (Z − VZ) and might also be related to the radial and/or azimuthal structure of the moving groups (Antoja et al. 2018; Ruiz-Lara et al. 2020). Future studies examining the vertical dynamics of the moving group’s clusters assigned in this work might prove insightful.
Gaia has ushered in an era where we can visualize the spatial and temporal evolution of star formation across a vast volume of the solar neighborhood across time in 3D. Our backward orbit integrations reveal a clear link between recent star formation and Galactic dynamics, likely driven by spiral arms. Future work will explore the age distribution of clusters in detail, especially as the 70−150 Myr population most distinctly outlines the moving groups. With Gaia DR4 offering improved astrometry and radial velocities, it will be key to advancing our understanding of the Galaxy’s structure and star formation history.
Data availability
A table of the clusters used in this work is available at the CDS via anonymous ftp to cdsarc.cds.unistra.fr (130.79.128.5) or via https://cdsarc.cds.unistra.fr/viz-bin/cat/J/A+A/699/L5
The 3D interactive version of Figure 1 is available at https://cswigg.github.io/cam_website/interactive_figures/swiggum+25_interactive_figure1.html
Young local associations (YLAs), often called moving groups, are sparse, comoving, coeval stellar groups that differ from the more populous, non-coeval classical moving groups.
Acknowledgments
We thank Robert Benjamin, Sebastian Ratzenböck, and Alexis Quintana for helpful discussions. This project has received funding from the European Research Council (ERC) under the European Union’s Horizon 2020 research and innovation program (Grant agreement No. 101055318). This work has made use of data from the European Space Agency (ESA) mission Gaia https://www.cosmos.esa.int/gaia, processed by the Gaia Data Processing and Analysis Consortium (DPAC, https://www.cosmos.esa.int/web/gaia/dpac/consortium). Funding for the DPAC has been provided by national institutions, in particular the institutions participating in the Gaia Multilateral Agreement.
References
- Abdurro’uf, Accetta, K., Aerts, C., et al. 2022, ApJS, 259, 35 [NASA ADS] [CrossRef] [Google Scholar]
- Antoja, T., Helmi, A., Romero-Gómez, M., et al. 2018, Nature, 561, 360 [Google Scholar]
- Arunima, A., Krumholz, M., Ireland, M., Zhang, C., & Hu, Z. 2025, ArXiv e-prints [arXiv:2503.00373] [Google Scholar]
- Astropy Collaboration (Price-Whelan, A. M., et al.) 2022, ApJ, 935, 167 [NASA ADS] [CrossRef] [Google Scholar]
- Barros, D. A., Pérez-Villegas, A., Lépine, J. R. D., Michtchenko, T. A., & Vieira, R. S. S. 2020, ApJ, 888, 75 [NASA ADS] [CrossRef] [Google Scholar]
- Bennett, M., & Bovy, J. 2019, MNRAS, 482, 1417 [NASA ADS] [CrossRef] [Google Scholar]
- Bernet, M., Ramos, P., Antoja, T., et al. 2022, A&A, 667, A116 [NASA ADS] [CrossRef] [EDP Sciences] [Google Scholar]
- Bernet, M., Ramos, P., Antoja, T., Monari, G., & Famaey, B. 2024, A&A, 686, A92 [NASA ADS] [CrossRef] [EDP Sciences] [Google Scholar]
- Bovy, J. 2015, ApJS, 216, 29 [NASA ADS] [CrossRef] [Google Scholar]
- Buder, S., Sharma, S., Kos, J., et al. 2021, MNRAS, 506, 150 [NASA ADS] [CrossRef] [Google Scholar]
- Chen, B., Asiain, R., Figueras, F., & Torra, J. 1997, A&A, 318, 29 [NASA ADS] [Google Scholar]
- Coronado, J., Fürnkranz, V., & Rix, H.-W. 2022, ApJ, 928, 70 [NASA ADS] [CrossRef] [Google Scholar]
- Craig, P., Chakrabarti, S., Newberg, H., & Quillen, A. 2021, MNRAS, 505, 2561 [Google Scholar]
- Dehnen, W. 1998, AJ, 115, 2384 [NASA ADS] [CrossRef] [Google Scholar]
- Dehnen, W. 2000, AJ, 119, 800 [NASA ADS] [CrossRef] [Google Scholar]
- Dehnen, W., & Binney, J. J. 1998, MNRAS, 298, 387 [NASA ADS] [CrossRef] [Google Scholar]
- D’Onghia, E. L., & Aguerri, J. A. 2020, ApJ, 890, 117 [CrossRef] [Google Scholar]
- D’Onghia, E., Vogelsberger, M., & Hernquist, L. 2013, ApJ, 766, 34 [Google Scholar]
- Eggen, O. J. 1983, MNRAS, 204, 377 [Google Scholar]
- Eggen, O. J. 1996, AJ, 112, 1595 [CrossRef] [Google Scholar]
- Elmegreen, B. G., & Lada, C. J. 1977, ApJ, 214, 725 [Google Scholar]
- Famaey, B., Siebert, A., & Jorissen, A. 2008, A&A, 483, 453 [NASA ADS] [CrossRef] [EDP Sciences] [Google Scholar]
- Fernández, D., Figueras, F., & Torra, J. 2008, A&A, 480, 735 [NASA ADS] [CrossRef] [EDP Sciences] [Google Scholar]
- Fürnkranz, V., Rix, H.-W., Coronado, J., & Seeburger, R. 2024, ApJ, 961, 113 [CrossRef] [Google Scholar]
- Gagné, J., Mamajek, E. E., Malo, L., et al. 2018, ApJ, 856, 23 [Google Scholar]
- Gaia Collaboration (Katz, D., et al.) 2018, A&A, 616, A11 [NASA ADS] [CrossRef] [EDP Sciences] [Google Scholar]
- Gaia Collaboration (Vallenari, A., et al.) 2023a, A&A, 674, A1 [NASA ADS] [CrossRef] [EDP Sciences] [Google Scholar]
- Gaia Collaboration (Drimmel, R., et al.) 2023b, A&A, 674, A37 [CrossRef] [EDP Sciences] [Google Scholar]
- Hunt, E. L., & Reffert, S. 2023, A&A, 673, A114 [NASA ADS] [CrossRef] [EDP Sciences] [Google Scholar]
- Hunt, E. L., & Reffert, S. 2024, A&A, 686, A42 [NASA ADS] [CrossRef] [EDP Sciences] [Google Scholar]
- Kapteyn, J. 1905, Rep. Br. Assoc. Adv. Sci., 264, 257 [Google Scholar]
- Li, Y., Freeman, K., Jerjen, H., et al. 2025, MNRAS, 538, 1963 [Google Scholar]
- Liang, X., Yoon, S.-J., & Zhao, J. 2024, AJ, 168, 277 [Google Scholar]
- Lucchini, S., Pellett, E., D’Onghia, E., & Aguerri, J. A. L. 2022, MNRAS, 519, 432 [NASA ADS] [CrossRef] [Google Scholar]
- Lucchini, S., D’Onghia, E., & Aguerri, J. A. L. 2024, MNRAS, 531, L14 [CrossRef] [Google Scholar]
- McInnes, L., Healy, J., & Astels, S. 2017, JOSS, 2, 205 [CrossRef] [Google Scholar]
- Minchev, I., Boily, C., Siebert, A., & Bienayme, O. 2010, MNRAS, 407, 2122 [CrossRef] [Google Scholar]
- Portail, M., Wegg, C., Gerhard, O., & Ness, M. 2017, MNRAS, 470, 1233 [NASA ADS] [CrossRef] [Google Scholar]
- Proctor, R. A. 1870, Proc. R. Soc. Lond. Ser. I, 18, 169 [Google Scholar]
- Quillen, A. C., & Minchev, I. 2005, AJ, 130, 576 [NASA ADS] [CrossRef] [Google Scholar]
- Quillen, A. C., Carrillo, I., Anders, F., et al. 2018, MNRAS, 480, 3132 [NASA ADS] [CrossRef] [Google Scholar]
- Quillen, A. C., Pettitt, A. R., Chakrabarti, S., et al. 2020, MNRAS, 499, 5623 [CrossRef] [Google Scholar]
- Reid, M. J., Menten, K. M., Brunthaler, A., et al. 2019, ApJ, 885, 131 [Google Scholar]
- Ruiz-Lara, T., Gallart, C., Bernard, E. J., & Cassisi, S. 2020, Nat. Astron., 4, 965 [NASA ADS] [CrossRef] [Google Scholar]
- Schönrich, R., Binney, J., & Dehnen, W. 2010, MNRAS, 403, 1829 [NASA ADS] [CrossRef] [Google Scholar]
- Sellwood, J. A., Trick, W. H., Carlberg, R. G., Coronado, J., & Rix, H.-W. 2019, MNRAS, 484, 3154 [NASA ADS] [CrossRef] [Google Scholar]
- Soler, J. D., Molinari, S., Glover, S. C. O., et al. 2025, A&A, 695, A222 [NASA ADS] [CrossRef] [EDP Sciences] [Google Scholar]
- Soubiran, C., Cantat-Gaudin, T., Romero-Gómez, M., et al. 2018, A&A, 619, A155 [NASA ADS] [CrossRef] [EDP Sciences] [Google Scholar]
- Swiggum, C., Alves, J., Benjamin, R., et al. 2024, Nature, 631, 49 [NASA ADS] [CrossRef] [Google Scholar]
- Tarricq, Y., Soubiran, C., Casamiquela, L., et al. 2021, A&A, 647, A19 [NASA ADS] [CrossRef] [EDP Sciences] [Google Scholar]
- Trick, W. H., Coronado, J., & Rix, H.-W. 2019, MNRAS, 484, 3291 [NASA ADS] [CrossRef] [Google Scholar]
All Tables
All Figures
|
Fig. 1. Galactic bird’s-eye (XY) view of the clusters’ orbits over time, showing more than half of a circle (dashed black line) with a radius of RSun = 8122 pc, extending from the Galactic center to the Sun. The location of the Galactic center and the direction of Galactic rotation are indicated. Individual clusters with ages between 70 and 150 Myr are represented as gray dots and are shown at three different times: the present (upper left), 30, and 70 million years ago (Ma), from left to right. The median location of each cluster family is displayed at the three time steps, with each family color-coded and labeled in the legend. The black bars for a given family indicate the standard deviation of its members’ positions at each time step. Average positional uncertainties of the older clusters are too small to show, but at t = −70 Myr they reach 60 pc, slightly smaller than the gray point sizes. The 3D interactive version of this figure has a time-slider showing the cluster positions at intermediate time steps with each frame centered on the location of the local standard of rest (LSR): https://cswigg.github.io/cam_website/interactive_figures/swiggum+25_interactive_figure1.html |
| In the text | |
|
Fig. 2. Top row: 2D histogram (VR − Vϕ; white-to-blue color map) showing the distribution of roughly 1.8 million stars within 300 pc, revealing arch-like overdensities corresponding to the Pleiades, Coma Berenices, and Sirius moving groups (labeled in the first panel). The second to fourth panels overlay black dots for clusters older than 70 Myr, each showing one HDBSCAN-identified group. Panels two and three include only clusters within 300 pc to match the stellar volume. Panel four shows a group extending to 500 pc, with clusters beyond 300 pc marked as crosses. Each group aligns with a distinct moving group. Bulk velocities of the αPer (violet), M6 (cyan), and Cr135 (orange) families are shown with standard deviation error bars. Bottom row: Same as the top row, but showing |
| In the text | |
Current usage metrics show cumulative count of Article Views (full-text article views including HTML views, PDF and ePub downloads, according to the available data) and Abstracts Views on Vision4Press platform.
Data correspond to usage on the plateform after 2015. The current usage metrics is available 48-96 hours after online publication and is updated daily on week days.
Initial download of the metrics may take a while.