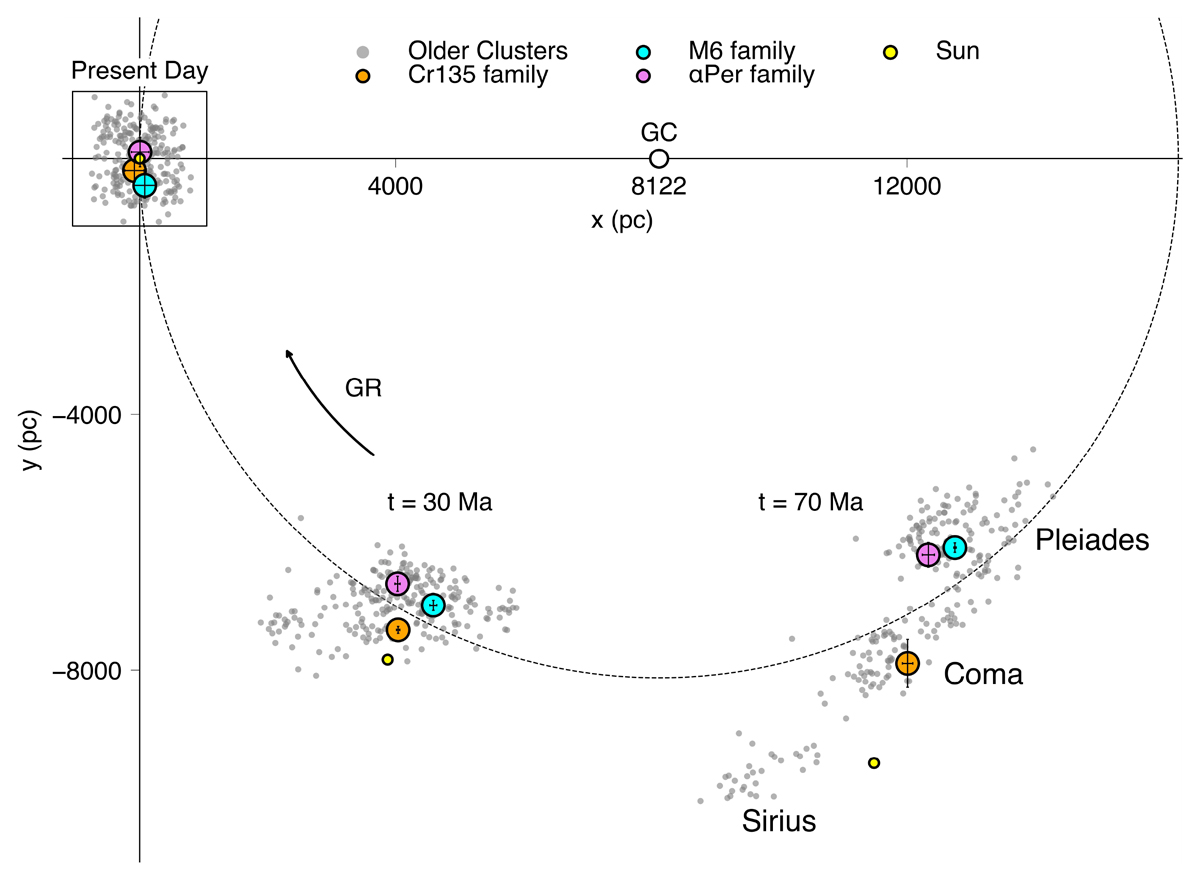
Fig. 1.
Download original image
Galactic bird’s-eye (XY) view of the clusters’ orbits over time, showing more than half of a circle (dashed black line) with a radius of RSun = 8122 pc, extending from the Galactic center to the Sun. The location of the Galactic center and the direction of Galactic rotation are indicated. Individual clusters with ages between 70 and 150 Myr are represented as gray dots and are shown at three different times: the present (upper left), 30, and 70 million years ago (Ma), from left to right. The median location of each cluster family is displayed at the three time steps, with each family color-coded and labeled in the legend. The black bars for a given family indicate the standard deviation of its members’ positions at each time step. Average positional uncertainties of the older clusters are too small to show, but at t = −70 Myr they reach 60 pc, slightly smaller than the gray point sizes. The 3D interactive version of this figure has a time-slider showing the cluster positions at intermediate time steps with each frame centered on the location of the local standard of rest (LSR): https://cswigg.github.io/cam_website/interactive_figures/swiggum+25_interactive_figure1.html
Current usage metrics show cumulative count of Article Views (full-text article views including HTML views, PDF and ePub downloads, according to the available data) and Abstracts Views on Vision4Press platform.
Data correspond to usage on the plateform after 2015. The current usage metrics is available 48-96 hours after online publication and is updated daily on week days.
Initial download of the metrics may take a while.