Fig. 2.
Download original image
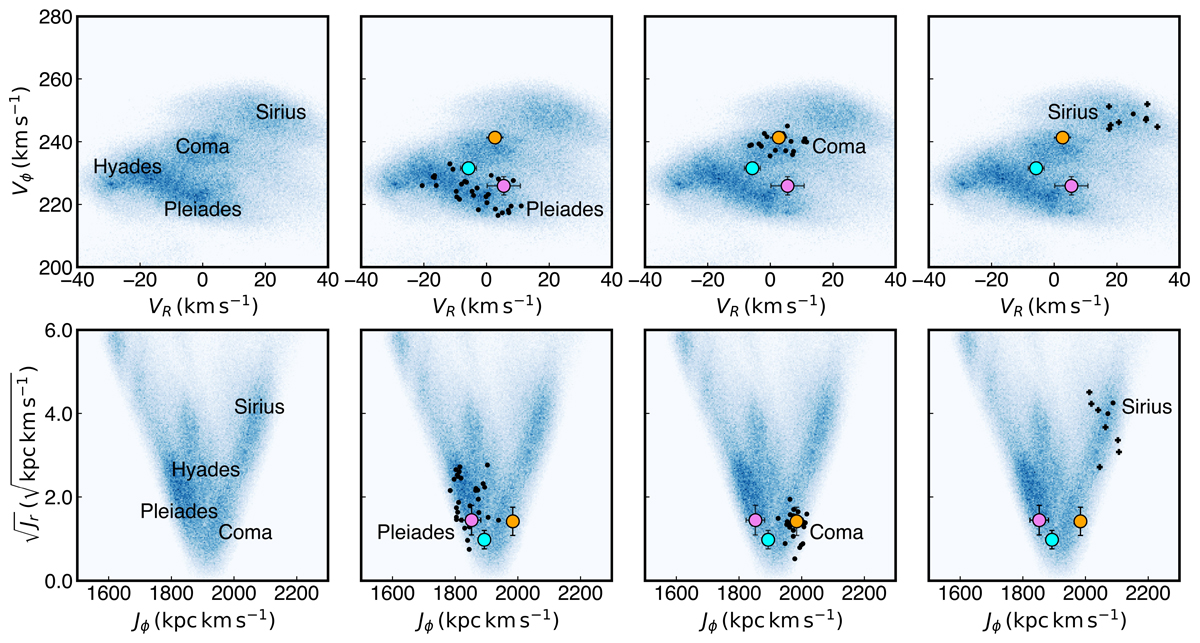
Top row: 2D histogram (VR − Vϕ; white-to-blue color map) showing the distribution of roughly 1.8 million stars within 300 pc, revealing arch-like overdensities corresponding to the Pleiades, Coma Berenices, and Sirius moving groups (labeled in the first panel). The second to fourth panels overlay black dots for clusters older than 70 Myr, each showing one HDBSCAN-identified group. Panels two and three include only clusters within 300 pc to match the stellar volume. Panel four shows a group extending to 500 pc, with clusters beyond 300 pc marked as crosses. Each group aligns with a distinct moving group. Bulk velocities of the αPer (violet), M6 (cyan), and Cr135 (orange) families are shown with standard deviation error bars. Bottom row: Same as the top row, but showing ![]() distributions instead.
distributions instead.
Current usage metrics show cumulative count of Article Views (full-text article views including HTML views, PDF and ePub downloads, according to the available data) and Abstracts Views on Vision4Press platform.
Data correspond to usage on the plateform after 2015. The current usage metrics is available 48-96 hours after online publication and is updated daily on week days.
Initial download of the metrics may take a while.