| Issue |
A&A
Volume 699, July 2025
|
|
|---|---|---|
| Article Number | A284 | |
| Number of page(s) | 7 | |
| Section | Atomic, molecular, and nuclear data | |
| DOI | https://doi.org/10.1051/0004-6361/202554904 | |
| Published online | 18 July 2025 | |
UV photodissociation of H2+ in interstellar radiation fields: Shape resonances and astrophysical implications
1
School of Physics, Henan Normal University,
Xinxiang
453000,
China
2
Institute of Environmental Science, Shanxi University,
Taiyuan
030006,
China
3
School of Physics and Information Technology, Shaanxi Normal University,
Xi’an
710119,
China
4
Institute of Applied Physics and Computational Mathematics,
PO Box 8009,
Beijing
100088,
China
5
School of Applied Science, Taiyuan University of Science and Technology,
Taiyuan
030024,
China
★ Corresponding authors: This email address is being protected from spambots. You need JavaScript enabled to view it.
; This email address is being protected from spambots. You need JavaScript enabled to view it.
; This email address is being protected from spambots. You need JavaScript enabled to view it.
Received:
31
March
2025
Accepted:
12
June
2025
Abstract
Aims. Prior investigations into the photodissociation dynamics of the hydrogen molecular ion (H2+) have frequently neglected the impact of shape resonances, which could potentially lead to inaccuracies in astrophysical modeling. This study systematically explores the photodissociation cross sections of H2+ with a rigorous consideration of shape resonances. We aim to elucidate comprehensively the photodissociation mechanisms by accurately accounting for transitions from the electronic ground state 12Σg+ to multiple electronically excited states. Our results provide updated, precise cross-sectional data essential for refining chemical evolution models of interstellar environments and for rectifying previous methodological oversights.
Methods. We employed high-level ab initio calculations based on the multireference single- and double-excitation configuration interaction (MRDCI) method to determine the electronic structure of the H2+ ion accurately. The photodissociation cross sections were calculated under the assumption of local thermodynamic equilibrium (LTE) across photon wavelengths ranging from 25 nm to the dissociation threshold, incorporating contributions from the majority of rovibrational states of the ground electronic state. Particular attention was given to analyzing the effects of shape resonances, especially the significant role played by the 12Πu state near the spectral region of the Lyman α line.
Results. Our computed cross sections clearly demonstrate that shape resonances substantially influence the photodissociation dynamics of H2+ near the Lyman α line. The contribution from the 12Πu excited state prominently shapes the spectral absorption features around the Lyman α region. These refined theoretical results offer substantial improvements over previous datasets, delivering the precise spectral information necessary for astrophysical simulations, modeling ultraviolet-driven chemical processes in interstellar media, and enhancing our understanding of photochemical dynamics in the early universe.
Key words: molecular data / molecular processes / ISM: abundances / ISM: molecules / photon-dominated region (PDR) / X-rays: stars
© The Authors 2025
 Open Access article, published by EDP Sciences, under the terms of the Creative Commons Attribution License (https://creativecommons.org/licenses/by/4.0), which permits unrestricted use, distribution, and reproduction in any medium, provided the original work is properly cited.
This article is published in open access under the Subscribe to Open model. This email address is being protected from spambots. You need JavaScript enabled to view it. to support open access publication.
1 Introduction
Hydrogen, the most abundant element in the universe, forms the fundamental building blocks of countless astrophysical environments. Among hydrogen-related molecular systems, the hydrogen molecular ion  , as the simplest ionic molecule comprising two protons and a single electron, is ubiquitously present within interstellar clouds and planetary atmospheres (Coppola et al. 2013). In these environments, the pervasive presence of intense radiation, particularly ultraviolet photons, frequently induces dissociation of
  ions. Consequently, an accurate and comprehensive understanding of the photodissociation mechanisms of
  is essential to astrophysics, significantly influencing theoretical modeling of interstellar chemistry and planetary atmospheric dynamics.
Historically, the photodissociation of  was first systematically investigated by Bates et al. (Bates 1952) in 1952 using a semiempirical approach aimed at elucidating stellar atmospheric opacity. Driven by advancements in both experimental nuclear fusion techniques and observational astrophysics, sub-stantial research interest subsequently emerged regarding hydrogenic molecular ions (Dehmelt & Jefferts 1962; Dunn 1968; Sharp 1970; Von Busch & Dunn 1972). Moreover, contemporary experimental capabilities employing strong laser fields or ultrashort laser pulses have revealed novel photodissociation phenomena, extending beyond traditional resonant dissociation pathways (Charron et al. 1993; Paul et al. 2010; Pan 2023). Collectively, these developments have considerably broadened our understanding of molecular dissociation dynamics, underlining the necessity for accurate theoretical frameworks.
Although structurally simplistic,  exhibits a remarkably complex spectrum of electronic states and dissociation channels. Consequently, accurate theoretical calculations and precise experimental determination of its photodissociation cross sections remain active and critical research domains. Notably, earlier investigations have frequently neglected the role of shape resonances, transient quasi-bound states that markedly amplify cross-section magnitudes and profoundly modulate dissociation dynamics (Stancil 1994; Heays et al. 2017). However, accumulating evidence suggests that these resonances substantially modify the resulting photodissociation cross sections, thereby impacting local astrophysical chemical evolution and material distributions (Beyer 2016; McCurdy & Mowrey 1982). Given this context, it is paramount to incorporate shape resonances explicitly and precisely in photodissociation studies.
Addressing this critical gap, the current study investigates the photodissociation process of  while explicitly considering the influence of shape resonances. Through a comprehensive comparison with prior theoretical frameworks presented by Stancil and Heays, we refine and update existing cross-sectional data, and we elucidate the role and magnitude of shape resonance effects. Ultimately, this work provides enhanced theoretical predictions, which facilitate more accurate astrophysical interpretations and significantly advance the fidelity of spectral modeling and astronomical observations.
Section 2 briefly outlines the theoretical framework that underpins photodissociation processes. Section 3 presents and discusses the computational results for electronic structure calculations and LTE photodissociation cross sections. Finally, Section 4 summarizes the key findings and discusses implications for future research. Atomic units are consistently employed throughout this paper unless otherwise noted.
2 Theory and calculations
2.1 Photodissociation cross section
In this section, we provide an in-depth theoretical treatment of partial photodissociation cross sections, and integrate insights from previous foundational studies (Miyake et al. 2011; Pattillo et al. 2018; Barinovs & Van Hemert 2004; McMillan et al. 2016; Yang et al. 2020; Bai et al. 2021). The transition cross section from an initial bound state, i, to a continuum final state, f, is formulated as
![Mathematical equation: \[\frame{\sigma ^\frame{fi}}\left(\nolbrace \frame{\frame{E_\frame{\frame{\text{ph}}}}} \norbrace\right) = 2\frame{\pi ^2}\alpha \frac{\frame{\frame{\text{d}}\frame{\mathcal{F}^\frame{fi}}}}{\frame{\frame{\text{d}}\frame{E_\frame{\frame{\text{ph}}}}}},\]](/articles/aa/full_html/2025/07/aa54904-25/aa54904-25-eq13.png) (1)
where α = e2/(ℏc) is the fine-structure constant, and Eph denotes photon energy. The generalized oscillator strength density, explicitly incorporating rotational state degeneracies, is represented by
(1)
where α = e2/(ℏc) is the fine-structure constant, and Eph denotes photon energy. The generalized oscillator strength density, explicitly incorporating rotational state degeneracies, is represented by
![Mathematical equation: \[\frac{\frame{\frame{\text{d}}\frame{\mathcal{F}^\frame{fi}}}}{\frame{\frame{\text{d}}\frame{E_\frame{\frame{\text{ph}}}}}} = \frac{2}{3}\frame{E_\frame{\frame{\text{ph}}}}\left(\nolbrace \frame{\frac{\frame{2 - \frame{\delta _\frame{0,\frame{\text{\Lambda \prime}} + \frame{\text{\Lambda \prime \prime}}}}}}{\frame{2 - \frame{\delta _\frame{0,\frame{\text{\Lambda \prime \prime}}}}}}} \norbrace\right)\underset{\frame{J\prime}}{\mathop \frame{\frame{\sum ^}}} \frac{\frame{\frame{S_\frame{J\prime}}\left(\nolbrace \frame{J\prime \prime} \norbrace\right)}}{\frame{\mathcal{W}\left(\nolbrace \frame{J\prime \prime} \norbrace\right)}}\frame{\left|\nolbrace \frame{\frame{D^\frame{fi}}\left(\nolbrace \frame{J\prime,J\prime \prime} \norbrace\right)} \norbrace\right|^2},\]](/articles/aa/full_html/2025/07/aa54904-25/aa54904-25-eq14.png) (2)
with Λ′ and Λ″ representing electronic orbital angular momentum projections along the internuclear axis for final and initial electronic states, respectively. The transition dipole moment (TDM) matrix element,
(2)
with Λ′ and Λ″ representing electronic orbital angular momentum projections along the internuclear axis for final and initial electronic states, respectively. The transition dipole moment (TDM) matrix element,
![Mathematical equation: \[\frame{D^\frame{fi}}\left(\nolbrace \frame{J\prime,J\prime \prime} \norbrace\right) = \langle \chi _\frame{k\primeJ\prime}^f(R)|\frame{D^\frame{fi}}(R)|\chi _\frame{\nu \prime \primeJ\prime \prime}^i(R)\rangle ,\]](/articles/aa/full_html/2025/07/aa54904-25/aa54904-25-eq15.png) (3)
characterizes the rovibrational transition between initial bound state, ν″J″, and final continuum state, k′J′, involving integration over internuclear distance, R. Here, Dfi(R) denotes the electronic TDM, and the rovibrational wavefunctions
(3)
characterizes the rovibrational transition between initial bound state, ν″J″, and final continuum state, k′J′, involving integration over internuclear distance, R. Here, Dfi(R) denotes the electronic TDM, and the rovibrational wavefunctions ![Mathematical equation: \[\chi _\frame{\nu \prime \primeJ\prime \prime}^i(R)\]](/articles/aa/full_html/2025/07/aa54904-25/aa54904-25-eq16.png) and
and ![Mathematical equation: \[\chi _\frame{k\primeJ\prime}^f(R)\]](/articles/aa/full_html/2025/07/aa54904-25/aa54904-25-eq17.png) describe initial and continuum states, respectively. The rotational line strengths were computed using Hönl-London factors S J′ (J″) appropriate for doublet-doublet transitions, following the formalism of Kovács (Kovacs 1969). The 2Σ ← 2Σ electronic transition is
describe initial and continuum states, respectively. The rotational line strengths were computed using Hönl-London factors S J′ (J″) appropriate for doublet-doublet transitions, following the formalism of Kovács (Kovacs 1969). The 2Σ ← 2Σ electronic transition is
![Mathematical equation: \[\frame{S_\frame{J\prime}}\left(\nolbrace \frame{J\prime \prime} \norbrace\right) = \{ \begin{array}{{c}} \frame{2J\prime \prime - \frac{1}{\frame{2J\prime \prime}}} & \frame{\frame{\text{for~P}} - \frame{\text{branch}},} \\ \frame{2\left(\nolbrace \frame{J\prime \prime + 1} \norbrace\right) - \frac{1}{\frame{2\left(\nolbrace \frame{J\prime \prime + 1} \norbrace\right)}}} & \frame{\frame{\text{for~R}} - \frame{\text{branch}},} \\ \end{array} \]](/articles/aa/full_html/2025/07/aa54904-25/aa54904-25-eq18.png) (4)
and the corresponding total Hönl-London weight is given by
(4)
and the corresponding total Hönl-London weight is given by
![Mathematical equation: \[\mathcal{W}\left(\nolbrace \frame{J\prime \prime} \norbrace\right) = 2\left(\nolbrace \frame{2J\prime \prime + 1} \norbrace\right) - \frac{\frame{2J\prime \prime + 1}}{\frame{2J\prime \prime\left(\nolbrace \frame{J\prime \prime + 1} \norbrace\right)}}.\]](/articles/aa/full_html/2025/07/aa54904-25/aa54904-25-eq19.png) (5)
(5)
For the 2Π ← 2Σ electronic transition, the Hönl-London factors are
![Mathematical equation: \[\frame{S_\frame{J\prime}}\left(\nolbrace \frame{J\prime \prime} \norbrace\right) = \{ \begin{array}{{c}} \frame{J\prime \prime - 1 - \frac{1}{\frame{4J\prime \prime}}} & \frame{\frame{\text{for~P}} - \frame{\text{branch,}}} \\ \frame{\begin{array}{{c}} \frame{2J\prime \prime + 1 - \frac{\frame{J\prime \prime + 1/2}}{\frame{J\prime \prime\left(\nolbrace \frame{J\prime \prime + 1} \norbrace\right)}}} \hfill \\ \frame{J\prime \prime + 2 - \frac{1}{\frame{4\left(\nolbrace \frame{J\prime \prime + 1} \norbrace\right)}}} \hfill \\ \end{array} } & \frame{\begin{array}{{c}} \frame{\frame{\text{for~Q}} - \frame{\text{branch,}}} \hfill \\ \frame{\frame{\text{for~R}} - \frame{\text{branch}}} \hfill \\ \end{array} } \\ \end{array} \]](/articles/aa/full_html/2025/07/aa54904-25/aa54904-25-eq20.png) (6)
with a corresponding total Hönl-London weight of
(6)
with a corresponding total Hönl-London weight of
![Mathematical equation: \[\mathcal{W}\left(\nolbrace \frame{J\prime \prime} \norbrace\right) = 2\left(\nolbrace \frame{2J\prime \prime + 1} \norbrace\right) - \frac{\frame{3\left(\nolbrace \frame{2J\prime \prime + 1} \norbrace\right)}}{\frame{4J\prime \prime\left(\nolbrace \frame{J\prime \prime + 1} \norbrace\right)}}.\]](/articles/aa/full_html/2025/07/aa54904-25/aa54904-25-eq21.png) (7)
(7)
These expressions properly incorporate spin-orbit coupling and allow for labeling of transitions by P1/P2, Q1/Q2, and R1/R2 branches. At the limit of unresolved spin components, the line strengths were summed accordingly. Compared to the simplified singlet-based expressions used in earlier work (Stancil 1994; Weck et al. 2003), the corrected Hönl-London factors lead to only slight modifications in the cross-section amplitudes, while the overall resonance structure remains virtually indistinguishable by visual inspection.
Notably, cross sections computed in atomic units retain the unit centimeter2 when the factor ![Mathematical equation: \[\frac{\frame{4\frame{\pi ^2}\alpha }}{3}\]](/articles/aa/full_html/2025/07/aa54904-25/aa54904-25-eq22.png) is substituted by 2.689 × 10⁻¹⁸. Therefore, the partial photodissociation cross section for transitions from a specific initial rovibrational state ν″J″ is succinctly expressed as (McMillan et al. 2016; Miyake et al. 2011; Pattillo et al. 2018; Bates & Bederson 1988)
is substituted by 2.689 × 10⁻¹⁸. Therefore, the partial photodissociation cross section for transitions from a specific initial rovibrational state ν″J″ is succinctly expressed as (McMillan et al. 2016; Miyake et al. 2011; Pattillo et al. 2018; Bates & Bederson 1988)
![Mathematical equation: \[\begin{array}{{c}} \frame{\frame{\sigma _\frame{\nu \prime \primeJ\prime \prime}}\left(\nolbrace \frame{\frame{E_\frame{\frame{\text{ph}}}}} \norbrace\right) = 2.689 \times \frame{\frame{10}^\frame{ - 18}}\frame{E_\frame{\frame{\text{ph}}}}\left(\nolbrace \frame{\frac{\frame{2 - \frame{\delta _\frame{0,\frame{\text{\Lambda \prime}} + \frame{\text{\Lambda \prime \prime}}}}}}{\frame{2 - \frame{\delta _\frame{0,\frame{\text{\Lambda \prime \prime}}}}}}} \norbrace\right)} \\ \frame{\,\,\,\,\,\,\,\,\,\,\,\,\,\,\, \times \underset{\frame{J\prime}}{\mathop \frame{\frame{\sum ^}}} \frac{\frame{\frame{S_\frame{J\prime}}\left(\nolbrace \frame{J\prime \prime} \norbrace\right)}}{\frame{\mathcal{W}\left(\nolbrace \frame{J\prime \prime} \norbrace\right)}}\frame{\frame{\left|\nolbrace \frame{\frame{D^\frame{fi}}\left(\nolbrace \frame{J\prime,J\prime \prime} \norbrace\right)} \norbrace\right|}^2}\frame{\text{c}}\frame{\frame{\text{m}}^2}.} \\ \end{array} \]](/articles/aa/full_html/2025/07/aa54904-25/aa54904-25-eq23.png) (8)
(8)
2.2 LTE cross section
Under the assumption of LTE, the rovibrational level populations within the electronic ground state follow the Boltzmann distribution, which results in a temperature-dependent weighting of each state’s contribution to the total photodissociation cross section. Consequently, the aggregate cross section for photodissociation at a given wavelength, λ, and temperature, T, is expressed as a sum over all populated rovibrational states ν″J″, explicitly incorporating their relative thermal populations (Argyros 1974):
![Mathematical equation: \[\sigma (\lambda ,\frame{\text{T}}) = \underset{\frame{\nu \prime \primeJ\prime \prime}}{\mathop \frame{\frame{\sum ^}}} \frame{\omega _\frame{\nu \prime \primeJ\prime \prime}}\frame{\sigma _\frame{\nu \prime \primeJ\prime \prime}}(\lambda ),\]](/articles/aa/full_html/2025/07/aa54904-25/aa54904-25-eq24.png) (9)
where the thermal weighting factor ων″ J″ quantifies the equilibrium fractional population of each rovibrational state and is given by
(9)
where the thermal weighting factor ων″ J″ quantifies the equilibrium fractional population of each rovibrational state and is given by
![Mathematical equation: \[\frame{\omega _\frame{\nu \prime \primeJ\prime \prime}} = \frac{\frame{\left(\nolbrace \frame{2J\prime \prime + 1} \norbrace\right)\exp \left(\nolbrace \frame{ - \frac{\frame{\frame{E_\frame{\nu \prime \primeJ\prime \prime}}}}{\frame{\frame{k_\frame{\text{B}}}\frame{\text{T}}}}} \norbrace\right)}}{\frame{Q(\frame{\text{T}})}}.\]](/articles/aa/full_html/2025/07/aa54904-25/aa54904-25-eq25.png) (10)
(10)
The normalization factor in Eq. (10), known as the rovibrational partition function Q(T), ensures the proper normalization of the distribution across all states and is defined as
![Mathematical equation: \[Q(\frame{\text{T}}) = \underset{\frame{\nu \prime \primeJ\prime \prime}}{\mathop \frame{\frame{\sum ^}}} \left(\nolbrace \frame{2J\prime \prime + 1} \norbrace\right)\exp \left(\nolbrace \frame{ - \frac{\frame{\frame{E_\frame{\nu \prime \primeJ\prime \prime}}}}{\frame{\frame{k_\frame{\text{B}}}\frame{\text{T}}}}} \norbrace\right).\]](/articles/aa/full_html/2025/07/aa54904-25/aa54904-25-eq26.png) (11)
(11)
In these equations, Eν″ J″ denotes the rovibrational energy of the bound state ν″J″ relative to the dissociation limit, kB represents the Boltzmann constant, and the summation spans all energetically accessible rovibrational levels. Therefore, a precise evaluation of σ(λ, T) critically depends upon accurate determination of both the energy levels and the individual partial cross sections σν″ J″ (λ), enabling reliable astrophysical modeling of photodissociation processes under thermalized astrophysical conditions.
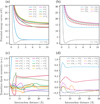 |
Fig. 1 PECs and TDMs for |
![Mathematical equation: \[\frame{\text{H}}_2^ + \]](/articles/aa/full_html/2025/07/aa54904-25/aa54904-25-eq30.png)
![Mathematical equation: \[\frame{\text{H}}_2^ + \]](/articles/aa/full_html/2025/07/aa54904-25/aa54904-25-eq31.png)
![Mathematical equation: \[\frame{1^2}\frame{\text{\Sigma }}_\frame{\text{g}}^ + \]](/articles/aa/full_html/2025/07/aa54904-25/aa54904-25-eq32.png)
![Mathematical equation: \[^2\frame{\text{\Sigma }}_\frame{\text{u}}^ + \]](/articles/aa/full_html/2025/07/aa54904-25/aa54904-25-eq33.png)
![Mathematical equation: \[\frame{1^2}\frame{\text{\Sigma }}_\frame{\text{g}}^ + \]](/articles/aa/full_html/2025/07/aa54904-25/aa54904-25-eq34.png)
![Mathematical equation: \[\frame{1^2}\frame{\text{\Sigma }}_\frame{\text{g}}^ + \]](/articles/aa/full_html/2025/07/aa54904-25/aa54904-25-eq35.png)
![Mathematical equation: \[^2\frame{\text{\Sigma }}_\frame{\text{u}}^ + \]](/articles/aa/full_html/2025/07/aa54904-25/aa54904-25-eq36.png)
3 Results and discussion
3.1 Potential energy curves and transition dipole moments
Figures 1a–b illustrate the potential energy curves (PECs) computed for the ![Mathematical equation: \[\frame{\text{H}}_2^ + \]](/articles/aa/full_html/2025/07/aa54904-25/aa54904-25-eq27.png) system. Correspondingly, Figs. 1c–d display the TDMs, which characterize transitions from the electronic ground state
system. Correspondingly, Figs. 1c–d display the TDMs, which characterize transitions from the electronic ground state ![Mathematical equation: \[\frame{1^2}\frame{\text{\Sigma }}_\frame{\text{g}}^ + \]](/articles/aa/full_html/2025/07/aa54904-25/aa54904-25-eq28.png) to the excited electronic states
to the excited electronic states ![Mathematical equation: \[^2\frame{\text{\Sigma }}_\frame{\text{u}}^ + \]](/articles/aa/full_html/2025/07/aa54904-25/aa54904-25-eq29.png) and 2Πu, plotted as functions of the internuclear distance R. The PECs utilized in this work stem from high-level quantum-chemical calculations reported in our earlier study (Wang et al. 2024). Building on that foundation, the present investigation contributes the TDM matrix elements as a critical component of the extended analysis. These calculations employed the multireference single- and double-excitation configuration interaction (MRDCI) methodology (Buenker & Phillips 1985), a sophisticated theoretical framework developed by Buenker and collaborators that robustly captures electron correlation effects that are essential for accurately describing electronic state properties.
and 2Πu, plotted as functions of the internuclear distance R. The PECs utilized in this work stem from high-level quantum-chemical calculations reported in our earlier study (Wang et al. 2024). Building on that foundation, the present investigation contributes the TDM matrix elements as a critical component of the extended analysis. These calculations employed the multireference single- and double-excitation configuration interaction (MRDCI) methodology (Buenker & Phillips 1985), a sophisticated theoretical framework developed by Buenker and collaborators that robustly captures electron correlation effects that are essential for accurately describing electronic state properties.
Examination of the calculated PECs reveals that most excited electronic states of the ![Mathematical equation: \[\frame{\text{H}}_2^ + \]](/articles/aa/full_html/2025/07/aa54904-25/aa54904-25-eq37.png) ion exhibit purely repulsive characteristics, however, such as 12Πu, possess notably shallow potential wells. This structural peculiarity strongly influences the dissociative dynamics initiated upon photoexcitation. Furthermore, as indicated by Eq. (8), the photodissociation cross sections are dominantly governed by the squared magnitude of the TDMs. Given the doublet nature of the ground electronic state, the present investigation is accordingly constrained to transitions exclusively between electronic states of doublet multiplicity, thereby ensuring theoretical consistency and precision in modeling the photodissociation processes.
ion exhibit purely repulsive characteristics, however, such as 12Πu, possess notably shallow potential wells. This structural peculiarity strongly influences the dissociative dynamics initiated upon photoexcitation. Furthermore, as indicated by Eq. (8), the photodissociation cross sections are dominantly governed by the squared magnitude of the TDMs. Given the doublet nature of the ground electronic state, the present investigation is accordingly constrained to transitions exclusively between electronic states of doublet multiplicity, thereby ensuring theoretical consistency and precision in modeling the photodissociation processes.
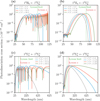 |
Fig. 2 Partial photodissociation cross sections of |
![Mathematical equation: \[\frame{\text{H}}_2^ + \]](/articles/aa/full_html/2025/07/aa54904-25/aa54904-25-eq42.png)
![Mathematical equation: \[\frame{1^2}\frame{\frame{\text{\Pi }}_\frame{\text{u}}} \leftarrow \frame{1^2}\frame{\text{\Sigma }}_\frame{\text{g}}^ + \]](/articles/aa/full_html/2025/07/aa54904-25/aa54904-25-eq43.png)
![Mathematical equation: \[\frame{1^2}\frame{\text{\Sigma }}_\frame{\text{u}}^ + \leftarrow \frame{1^2}\frame{\text{\Sigma }}_\frame{\text{g}}^ + \]](/articles/aa/full_html/2025/07/aa54904-25/aa54904-25-eq44.png)
3.2 Partial photodissociation cross sections
Considering the transitions ![Mathematical equation: \[\frame{1^2}\frame{\frame{\text{\Pi }}_\frame{\text{u}}} \leftarrow \frame{1^2}\frame{\text{\Sigma }}_\frame{\text{g}}^ + \]](/articles/aa/full_html/2025/07/aa54904-25/aa54904-25-eq38.png) and
and ![Mathematical equation: \[\frame{1^2}\frame{\text{\Sigma }}_\frame{\text{u}}^ + \leftarrow \frame{1^2}\frame{\text{\Sigma }}_\frame{\text{g}}^ + \]](/articles/aa/full_html/2025/07/aa54904-25/aa54904-25-eq39.png) as illustrative examples, Fig. 2 presents detailed partial photodissociation cross sections originating from selected initial rovibrational levels of the ground electronic state to the specified excited states. The notation (ν″, J″, J′) precisely denotes a transition from an initial rovibrational state characterized by vibrational quantum number ν″ and rotational quantum number J″ to a final continuum state distinguished by rotational quantum number J′. Correspondingly, (ν″, J″) represents the aggregate photodissociation cross section, summing over all allowed final rotational states J′ and explicitly incorporating the appropriate Hönl-London factors. Specifically, panels a and c of Fig. 2 illustrate transitions that originate from initial rovibrational states with rotational quantum number J″ = 0, whereas panels b and d illustrate transitions that originate from initial vibrational states with vibrational quantum number ν″ = 0. These photodissociation cross sections were computed using a modified version of the PyDiatomic computational package (Gibson 2024), which is available for download on GitHub at https://github.com/stggh/PyDiatomic. Fig. 2a reveals distinct resonance structures proximate to the Lyman α wavelength within the cross sections that correspond to the
as illustrative examples, Fig. 2 presents detailed partial photodissociation cross sections originating from selected initial rovibrational levels of the ground electronic state to the specified excited states. The notation (ν″, J″, J′) precisely denotes a transition from an initial rovibrational state characterized by vibrational quantum number ν″ and rotational quantum number J″ to a final continuum state distinguished by rotational quantum number J′. Correspondingly, (ν″, J″) represents the aggregate photodissociation cross section, summing over all allowed final rotational states J′ and explicitly incorporating the appropriate Hönl-London factors. Specifically, panels a and c of Fig. 2 illustrate transitions that originate from initial rovibrational states with rotational quantum number J″ = 0, whereas panels b and d illustrate transitions that originate from initial vibrational states with vibrational quantum number ν″ = 0. These photodissociation cross sections were computed using a modified version of the PyDiatomic computational package (Gibson 2024), which is available for download on GitHub at https://github.com/stggh/PyDiatomic. Fig. 2a reveals distinct resonance structures proximate to the Lyman α wavelength within the cross sections that correspond to the ![Mathematical equation: \[\frame{1^2}\frame{\frame{\text{\Pi }}_\frame{\text{u}}} \leftarrow \frame{1^2}\frame{\text{\Sigma }}_\frame{\text{g}}^ + \]](/articles/aa/full_html/2025/07/aa54904-25/aa54904-25-eq40.png) electronic transitions. To explore these resonance features in detail, a detailed depiction of shape resonance, exemplified by the
electronic transitions. To explore these resonance features in detail, a detailed depiction of shape resonance, exemplified by the ![Mathematical equation: \[\frame{1^2}\frame{\frame{\text{\Pi }}_\frame{\text{u}}}(J\prime = \,26) \leftarrow \frame{1^2}\frame{\text{\Sigma }}_\frame{\text{g}}^ + \left(\nolbrace \frame{J\prime \prime = 25} \norbrace\right)\]](/articles/aa/full_html/2025/07/aa54904-25/aa54904-25-eq41.png) photodissociation cross section, is illustrated in Fig. 3.
photodissociation cross section, is illustrated in Fig. 3.
Figure 3a displays the PECs for both the ground and the excited 12Πu states, including the rotational modification depicted by dashed lines. The potential well associated with the 12Πu excited state is notably shallow, with a depth typically not exceeding approximately 0.13 eV. Incorporation of rotational effects introduces a pronounced centrifugal potential barrier, which emerges predominantly at larger internuclear distances due to the centrifugal term ![Mathematical equation: \[\frac{\frame{\frame{\hbar ^2}J(J + 1)}}{\frame{2\mu \frame{R^2}}}.\]](/articles/aa/full_html/2025/07/aa54904-25/aa54904-25-eq48.png) . This term causes a significant enhancement in the effective potential Veff(R, J), thereby forming a barrier conducive to shape resonance phenomena. Fig. 3b illustrates the photodissociation cross section for the
. This term causes a significant enhancement in the effective potential Veff(R, J), thereby forming a barrier conducive to shape resonance phenomena. Fig. 3b illustrates the photodissociation cross section for the ![Mathematical equation: \[\frame{1^2}\frame{\frame{\text{\Pi }}_\frame{\text{u}}}\left(\nolbrace \frame{J\prime = 26} \norbrace\right) \leftarrow \frame{1^2}\frame{\text{\Sigma }}_\frame{\text{g}}^ + \left(\nolbrace \frame{J\prime \prime = 25} \norbrace\right)\]](/articles/aa/full_html/2025/07/aa54904-25/aa54904-25-eq49.png) transition. It is evident that the presence of a potential barrier results in three distinct shape resonance peaks for this transition. These resonances underscore the significant influence of rotational excitation on the photodissociation dynamics and spectral characteristics. Note that shape resonances were identified by analyzing the energy-dependent phase shifts extracted from the continuum wave functions. Rapid variations in the phase shift indicate the presence of resonant states, which manifest as sharp peaks in the photodissociation cross sections. These features are especially prominent for high rotational quantum number levels of the 12Πu state near the Lyman α region. The use of a fine energy grid (0.0001 eV) and accurate MRDCI PECs allows these resonance structures to be fully resolved. The photodissociation cross sections for the majority of rovibrational states (with vibrational quantum numbers ν″≤ 18 and rotational quantum numbers J″≤ 30) have been systematically computed over photon wavelengths ranging from 25 nm up to the photodissociation threshold.
transition. It is evident that the presence of a potential barrier results in three distinct shape resonance peaks for this transition. These resonances underscore the significant influence of rotational excitation on the photodissociation dynamics and spectral characteristics. Note that shape resonances were identified by analyzing the energy-dependent phase shifts extracted from the continuum wave functions. Rapid variations in the phase shift indicate the presence of resonant states, which manifest as sharp peaks in the photodissociation cross sections. These features are especially prominent for high rotational quantum number levels of the 12Πu state near the Lyman α region. The use of a fine energy grid (0.0001 eV) and accurate MRDCI PECs allows these resonance structures to be fully resolved. The photodissociation cross sections for the majority of rovibrational states (with vibrational quantum numbers ν″≤ 18 and rotational quantum numbers J″≤ 30) have been systematically computed over photon wavelengths ranging from 25 nm up to the photodissociation threshold.
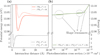 |
Fig. 3 PECs and photodissociation cross sections of |
![Mathematical equation: \[\frame{\text{H}}_2^ + \]](/articles/aa/full_html/2025/07/aa54904-25/aa54904-25-eq45.png)
![Mathematical equation: \[\frame{1^2}\frame{\text{\Sigma }}_\frame{\text{g}}^ + \]](/articles/aa/full_html/2025/07/aa54904-25/aa54904-25-eq46.png)
![Mathematical equation: \[\frame{1^2}\frame{\text{\Sigma }}_\frame{\text{g}}^ + \]](/articles/aa/full_html/2025/07/aa54904-25/aa54904-25-eq47.png)
3.3 LTE cross sections
For the ![Mathematical equation: \[\frame{\text{H}}_2^ + \]](/articles/aa/full_html/2025/07/aa54904-25/aa54904-25-eq50.png) molecular ion, Figs. 4a–p illustrate the comprehensive photodissociation cross sections that correspond to electronic transitions from the ground state
molecular ion, Figs. 4a–p illustrate the comprehensive photodissociation cross sections that correspond to electronic transitions from the ground state ![Mathematical equation: \[\frame{1^2}\frame{\text{\Sigma }}_\frame{\text{g}}^ + \]](/articles/aa/full_html/2025/07/aa54904-25/aa54904-25-eq51.png) to the six energetically lowest excited states of 2Πu symmetry and the ten lowest excited states of
to the six energetically lowest excited states of 2Πu symmetry and the ten lowest excited states of ![Mathematical equation: \[^2\frame{\text{\Sigma }}_\frame{\text{u}}^ + \]](/articles/aa/full_html/2025/07/aa54904-25/aa54904-25-eq52.png) symmetry under LTE conditions. These cross sections are systematically presented as functions of photon wavelength at various thermodynamic temperatures, explicitly including 0, 1000, 2000, 3150, 5040, and 12 600 K. Such extensive temperature coverage facilitates a detailed exploration of thermal effects on the photodissociation dynamics. Notably, as the temperature rises, significant deviations from the cross sections at absolute zero become evident, which underscores the pronounced role of thermally populated rovibrational states in modulating photodissociation behavior.
symmetry under LTE conditions. These cross sections are systematically presented as functions of photon wavelength at various thermodynamic temperatures, explicitly including 0, 1000, 2000, 3150, 5040, and 12 600 K. Such extensive temperature coverage facilitates a detailed exploration of thermal effects on the photodissociation dynamics. Notably, as the temperature rises, significant deviations from the cross sections at absolute zero become evident, which underscores the pronounced role of thermally populated rovibrational states in modulating photodissociation behavior.
A detailed inspection of the computed photodissociation cross sections across distinct excited electronic states highlights the dominant role of the partial cross section corresponding to the ![Mathematical equation: \[\frame{1^2}\frame{\frame{\text{\Pi }}_\frame{\text{u}}} \leftarrow \frame{1^2}\frame{\text{\Sigma }}_\frame{\text{g}}^ + \]](/articles/aa/full_html/2025/07/aa54904-25/aa54904-25-eq57.png) transition, particularly at longer wavelengths near the Lyman α spectral region. Additionally, resonance structures are also observed in the transition from the ground state to the excited state 52Πu. These resonance peaks reflect the existence of a shallow potential well in the 52Πu state, which, although present, is notably weaker than the well observed in the 12Πu state. The spectral resolution employed in the current computations is precisely set at 0.0001 eV, a choice that determines the accuracy and clarity with which these resonant phenomena and subtle spectral features are represented.
transition, particularly at longer wavelengths near the Lyman α spectral region. Additionally, resonance structures are also observed in the transition from the ground state to the excited state 52Πu. These resonance peaks reflect the existence of a shallow potential well in the 52Πu state, which, although present, is notably weaker than the well observed in the 12Πu state. The spectral resolution employed in the current computations is precisely set at 0.0001 eV, a choice that determines the accuracy and clarity with which these resonant phenomena and subtle spectral features are represented.
To elucidate the origin of prominent spectral features, Fig. 5a provides the total cross sections partitioned by final excited states. Notably, this allows intuitive visualization, and highlights that the resonance peaks adjacent to the Lyman α line predominantly arise from the ![Mathematical equation: \[\frame{1^2}\frame{\frame{\text{\Pi }}_\frame{\text{u}}} \leftarrow \frame{1^2}\frame{\text{\Sigma }}_\frame{\text{g}}^ + \]](/articles/aa/full_html/2025/07/aa54904-25/aa54904-25-eq58.png) transition. Conversely, at longer photon wavelengths, the primary contributions to the total photodissociation cross section originate from the
transition. Conversely, at longer photon wavelengths, the primary contributions to the total photodissociation cross section originate from the ![Mathematical equation: \[\frame{1^2}\frame{\text{\Sigma }}_\frame{\text{u}}^ + \leftarrow \,\frame{1^2}\frame{\text{\Sigma }}_\frame{\text{g}}^ + \]](/articles/aa/full_html/2025/07/aa54904-25/aa54904-25-eq59.png) transition. Fig. 5b illustrates the total photodissociation cross sections for the
transition. Fig. 5b illustrates the total photodissociation cross sections for the ![Mathematical equation: \[\frame{\text{H}}_2^ + \]](/articles/aa/full_html/2025/07/aa54904-25/aa54904-25-eq60.png) molecular ion, which are derived by summing contributions across all permissible rovibrational transitions from the ground electronic state to the excited electronic states. These cross sections are systematically presented at various thermodynamic temperatures, explicitly including 0, 1000, 2000, 3150, 5040, and 12 600 K. Comprehensive datasets that correspond to the LTE cross sections depicted in Fig. 5b are provided in the supplementary material accompanying this work.
molecular ion, which are derived by summing contributions across all permissible rovibrational transitions from the ground electronic state to the excited electronic states. These cross sections are systematically presented at various thermodynamic temperatures, explicitly including 0, 1000, 2000, 3150, 5040, and 12 600 K. Comprehensive datasets that correspond to the LTE cross sections depicted in Fig. 5b are provided in the supplementary material accompanying this work.
Additionally, this study includes a comparative analysis of the total photodissociation cross sections obtained here with previously published results. In particular, Fig. 6a presents a direct comparison at 0 K between our calculated cross sections and those reported by Heays (Heays et al. 2017), which demonstrate excellent agreement and thereby confirm the computational accuracy of our methodology. Similarly, comparison with the data provided by Stancil (Stancil 1994) in Figs. 6b and 6c further underscores the pronounced impact of shape resonances near the Lyman α region on the overall cross-sectional profile. Differences observed in the photodissociation cross sections at shorter wavelengths at elevated thermodynamic temperatures (specifically, 3150 and 12 600 K) arise primarily from the incorporation of additional excited electronic states in our computations compared to earlier studies. Notably, weak shape resonance features become discernible near the Lyman α line around 3150 K and become increasingly prominent at higher temperatures up to 12 600 K, which reflects the substantial influence of thermal population redistribution on photodissociation dynamics.
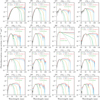 |
Fig. 4 LTE photodissociation cross sections of |
![Mathematical equation: \[\frame{\text{H}}_2^ + \]](/articles/aa/full_html/2025/07/aa54904-25/aa54904-25-eq53.png)
![Mathematical equation: \[\frame{1^2}\frame{\text{\Sigma }}_\frame{\text{g}}^ + \]](/articles/aa/full_html/2025/07/aa54904-25/aa54904-25-eq54.png)
![Mathematical equation: \[^2\frame{\text{\Sigma }}_\frame{\text{u}}^ + \]](/articles/aa/full_html/2025/07/aa54904-25/aa54904-25-eq55.png)
![Mathematical equation: \[\frame{\text{H}}_2^ + \]](/articles/aa/full_html/2025/07/aa54904-25/aa54904-25-eq56.png)
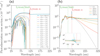 |
Fig. 5 Photodissociation cross sections of |
![Mathematical equation: \[\frame{\text{H}}_2^ + \]](/articles/aa/full_html/2025/07/aa54904-25/aa54904-25-eq61.png)
![Mathematical equation: \[\frame{\text{H}}_2^ + \]](/articles/aa/full_html/2025/07/aa54904-25/aa54904-25-eq62.png)
![Mathematical equation: \[^2\frame{\text{\Sigma }}_\frame{\text{u}}^ + \]](/articles/aa/full_html/2025/07/aa54904-25/aa54904-25-eq63.png)
![Mathematical equation: \[\frame{\text{H}}_2^ + \]](/articles/aa/full_html/2025/07/aa54904-25/aa54904-25-eq64.png)
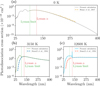 |
Fig. 6 Comparison of present and previous photodissociation cross sections. Panels a–c present a comparative analysis between the present computational results (solid lines) and previously published calculations of Heays et al. (2017) and Stancil (1994) (dashed lines). |
4 Conclusions
In this study, we investigated partial photodissociation cross sections for transitions that originate from the electronic ground state ![Mathematical equation: \[\frame{1^2}\frame{\text{\Sigma }}_\frame{\text{g}}^ + \]](/articles/aa/full_html/2025/07/aa54904-25/aa54904-25-eq65.png) to six excited states of 2Πu symmetry and ten excited states of
to six excited states of 2Πu symmetry and ten excited states of ![Mathematical equation: \[^2\frame{\text{\Sigma }}_\frame{\text{u}}^ + \]](/articles/aa/full_html/2025/07/aa54904-25/aa54904-25-eq66.png) symmetry. By examining thermodynamic temperatures of 0, 1000, 2000, 3150, 5040, and 12 600 K, and assuming a Boltzmann distribution for initial rovibrational populations, we observed pronounced shape resonances near the Lyman α line, notably in the photodissociation cross sections that correspond to the
symmetry. By examining thermodynamic temperatures of 0, 1000, 2000, 3150, 5040, and 12 600 K, and assuming a Boltzmann distribution for initial rovibrational populations, we observed pronounced shape resonances near the Lyman α line, notably in the photodissociation cross sections that correspond to the ![Mathematical equation: \[\frame{1^2}\frame{\frame{\text{\Pi }}_\frame{\text{u}}} \leftarrow \frame{1^2}\frame{\text{\Sigma }}_\frame{\text{g}}^ + \]](/articles/aa/full_html/2025/07/aa54904-25/aa54904-25-eq67.png) transitions. By employing precise theoretical calculations, the current work significantly enriches existing datasets related to shape resonance-mediated photodissociation processes in the
transitions. By employing precise theoretical calculations, the current work significantly enriches existing datasets related to shape resonance-mediated photodissociation processes in the ![Mathematical equation: \[\frame{\text{H}}_2^ + \]](/articles/aa/full_html/2025/07/aa54904-25/aa54904-25-eq68.png) molecular ion. These refined crosssectional data provide essential theoretical benchmarks for astronomical spectroscopic observations and laboratory photodissociation experiments, while simultaneously offering deeper insight into the molecular photodissociation mechanisms operative in the early universe and ultraviolet-irradiated interstellar environments.
molecular ion. These refined crosssectional data provide essential theoretical benchmarks for astronomical spectroscopic observations and laboratory photodissociation experiments, while simultaneously offering deeper insight into the molecular photodissociation mechanisms operative in the early universe and ultraviolet-irradiated interstellar environments.
Data availability
All the LTE cross sections depicted in Fig. 5b are published in https://doi.org/10.5281/zenodo.15679287
Acknowledgements
This work was supported by grants from the National Natural Science Foundation of China (Grant No. 12304279, No. 12374238 and No. 12204288) and Doctoral scientific research foundation of Henan Normal University (Grant No. 2023066).
References
- Argyros, J. D. 1974, J. Phys. B: Atom. Mol. Phys., 7, 2025 [Google Scholar]
- Bai, T., Qin, Z., & Liu, L. 2021, MNRAS, 505, 2177 [NASA ADS] [CrossRef] [Google Scholar]
- Barinovs, G., & Van Hemert, M. C. 2004, Chem. Phys. Lett., 399, 406 [Google Scholar]
- Bates, D. R. 1952, MNRAS, 122, 40 [Google Scholar]
- Bates, D., & Bederson, B. 1988, Advances in Atomic and Molecular Physics (New York: Academic Press) [Google Scholar]
- Beyer, M. 2016, Phys. Rev. Lett., 116, 093001 [Google Scholar]
- Buenker, R. J., & Phillips, R. A. 1985, J. Mol. Struc., 123, 291 [Google Scholar]
- Charron, E., Giusti-Suzor, A., & Mies, F. H. 1993, Phys. Rev. Lett., 71, 692 [Google Scholar]
- Coppola, C. M., Galli, D., Palla, F., Longo, S., & Chluba, J. 2013, MNRAS, 434, 114 [Google Scholar]
- Dehmelt, H. G., & Jefferts, K. B. 1962, Phys. Rev., 125, 1318 [Google Scholar]
- Dunn, G. H. 1968, Phys. Rev., 172, 1 [Google Scholar]
- Gibson, S. 2024, PyDiatomic, https://github.com/stggh/PyDiatomic [Google Scholar]
- Heays, A. N., Bosman, A. D., & van Dishoeck, E. F. 2017, A&A, 602, A105 [NASA ADS] [CrossRef] [EDP Sciences] [Google Scholar]
- Kovács, I. 1969, Rotational Structure in the Spectra of Diatomic Molecules (Budapest: Akadémiai Kiadó) [Google Scholar]
- McCurdy, C. W., & Mowrey, R. C. 1982, Phys. Rev. A, 25, 2529 [Google Scholar]
- McMillan, E. C., Shen, G., McCann, J. F., McLaughlin, B. M., & Stancil, P. C. 2016, J. Phys. B: Atom. Mol. Opt. Phys., 49, 084001 [Google Scholar]
- Miyake, S., Gay, C. D., & Stancil, P. C. 2011, ApJ, 735, 21 [NASA ADS] [CrossRef] [Google Scholar]
- Pan, S. 2023, Light: Sci. Appl., 12, 139 [Google Scholar]
- Pattillo, R. J., Cieszewski, R., Stancil, P. C., et al. 2018, ApJ, 858, 10 [NASA ADS] [CrossRef] [Google Scholar]
- Paul, A. K., Adhikari, S., Baer, M., & Baer, R. 2010, Phys. Rev. A, 81, 013412 [Google Scholar]
- Sharp, T. E. 1970, Atomic Data Nuclear Data Tables, 2, 119 [Google Scholar]
- Stancil, P. C. 1994, ApJ, 430, 360 [NASA ADS] [CrossRef] [Google Scholar]
- Von Busch, F., & Dunn, G. H. 1972, Phys. Rev. A, 5, 1726 [Google Scholar]
- Wang, Y., Wang, K., Liu, L., et al. 2024, ApJS, 272, 38 [Google Scholar]
- Weck, P. F., Stancil, P. C., & Kirby, K. 2003, ApJ, 582, 1263 [NASA ADS] [CrossRef] [Google Scholar]
- Yang, Y. K., Cheng, Y., Peng, Y. G., et al. 2020, J. Quant. Spectrosc. Radiat. Transf., 254, 107203 [Google Scholar]
All Figures
|
Fig. 1 PECs and TDMs for |
| In the text | |
|
Fig. 2 Partial photodissociation cross sections of |
| In the text | |
|
Fig. 3 PECs and photodissociation cross sections of |
| In the text | |
|
Fig. 4 LTE photodissociation cross sections of |
| In the text | |
|
Fig. 5 Photodissociation cross sections of |
| In the text | |
|
Fig. 6 Comparison of present and previous photodissociation cross sections. Panels a–c present a comparative analysis between the present computational results (solid lines) and previously published calculations of Heays et al. (2017) and Stancil (1994) (dashed lines). |
| In the text | |
Current usage metrics show cumulative count of Article Views (full-text article views including HTML views, PDF and ePub downloads, according to the available data) and Abstracts Views on Vision4Press platform.
Data correspond to usage on the plateform after 2015. The current usage metrics is available 48-96 hours after online publication and is updated daily on week days.
Initial download of the metrics may take a while.