| Issue |
A&A
Volume 699, July 2025
|
|
|---|---|---|
| Article Number | A335 | |
| Number of page(s) | 23 | |
| Section | Extragalactic astronomy | |
| DOI | https://doi.org/10.1051/0004-6361/202554859 | |
| Published online | 23 July 2025 | |
Discovery and characterization of 25 new quasars at 4.6 < z < 6.9 from wide-field multiband surveys
1
Max-Planck-Institut für Astronomie, Königstuhl 17, D-69117, Heidelberg, Germany
2
INAF – Osservatorio di Astrofisica e Scienza dello Spazio, Via Gobetti 93/3, I-40129, Bologna, Italy
3
Fakultät für Physik und Astronomie, Universität Heidelberg, Im Neuenheimer Feld 226, 69120 Heidelberg, Germany
4
Leiden Observatory, Leiden University, P.O. Box 9513, 2300 RA Leiden, The Netherlands
5
Steward Observatory, University of Arizona, 933 N. Cherry Ave., Tucson, AZ 85721, USA
6
Department of Astronomy, University of Michigan, 1085 S. University Ave., Ann Arbor, MI 48109, USA
7
Dipartimento di Fisica, Università di Trieste, Sezione di Astronomia, Via G.B. Tiepolo 11, I-34131 Trieste, Italy
8
INAF–Osservatorio Astronomico di Trieste, Via G. B. Tiepolo 11, I-34131 Trieste, Italy
9
Kavli Institute for the Physics and Mathematics of the Universe (Kavli IPMU, WPI), The University of Tokyo Institutes for Advanced Study, The University of Tokyo, Kashiwa, Chiba 277-8583, Japan
10
Center for Data-Driven Discovery, Kavli IPMU (WPI), UTIAS, The University of Tokyo, Kashiwa, Chiba 277-8583, Japan
11
Kavli Institute for Astronomy and Astrophysics, Peking University, Beijing 100871, China
12
Instituto de Astrofísica, Facultad de Física, Pontificia Universidad Católica de Chile Av. Vicuña Mackenna 4860, 7820436 Macul, Santiago, Chile
13
Millennium Institute of Astrophysics (MAS), Nuncio Monseñor Sótero Sanz 100, Providencia, Santiago, Chile
14
Núcleo de Astronomía de la Facultad de Ingeniería, Universidad Diego Portales, Av. Ejército Libertador 441, Santiago, Chile
15
Hamburger Sternwarte, Universität Hamburg, Gojenbergsweg 112, D-21029 Hamburg, Germany
16
Jet Propulsion Laboratory, California Institute of Technology, 4800 Oak Grove Drive, Pasadena, CA, 91109, USA
17
International Gemini Observatory/NSF NOIRLab, 670 N A’ohoku Place, Hilo, Hawai’i 96720, USA
⋆ Corresponding author.
Received:
29
March
2025
Accepted:
19
May
2025
Abstract
Luminous quasars at z>4 provide key insights into the early Universe. Their rarity necessitates wide-field multiband surveys to efficiently separate them from the main astrophysical contaminants (i.e., ultracool dwarfs). To expand the sample of high-z quasars, we conducted targeted selections using optical, infrared, and radio surveys, which we complemented by literature-based quasar candidate catalogs. We report the discovery of 25 new quasars at 4.6<z<6.9 (six at z≥6.5), with M1450 between −25.4 and −27.0. We also present new spectra of six z>6.5 quasars we selected, but whose independent discovery has already been published in the literature. Three of the newly discovered quasars are strong radio emitters (L1.4 GHz = 0.09−1.0×1034 erg s−1 Hz−1). One source at z = 4.71 exhibits typical blazar-like properties, including a flat radio spectrum, a radio loudness of ∼1000, and multifrequency variability. It was also detected by SRG/eROSITA X-ray telescope (f0.2−2.3 keV∼1.3×10⁻¹³ erg s−1 cm−2). In addition, for seven 6.3<z<6.9 quasars, we present near-infrared spectroscopy and estimated the central black hole mass from their C IV and Mg II broad emission lines. Their masses (log[MBH,MgII] = 8.58−9.14 M⊙) and Eddington ratios (λEdd,MgII = 0.74−2.2) are consistent with other z>6 quasars reported in the literature. A z = 6.3 quasar exhibits a velocity difference of approximately 9000 km s−1 between the C IV and Mg II emission lines. This means that it is one of the most extreme C IV outflows currently known. The sample also includes three high-ionization broad absorption line (HiBAL) quasars. One of these quasars shows potential evidence of an extremely fast outflow feature that reaches 47 000 km s−1.
Key words: galaxies: active / galaxies: high-redshift / quasars: general / quasars: supermassive black holes
© The Authors 2025
 Open Access article, published by EDP Sciences, under the terms of the Creative Commons Attribution License (https://creativecommons.org/licenses/by/4.0), which permits unrestricted use, distribution, and reproduction in any medium, provided the original work is properly cited.
This article is published in open access under the Subscribe to Open model.
Open Access funding provided by Max Planck Society.
1. Introduction
Quasars are some of the most luminous nontransient sources in the sky. They can be studied at long cosmological look-back times across the entire electromagnetic spectrum. The current records lie at z∼7.6 (∼0.7 Gyr after the Big Bang; e.g., Bañados et al. 2018; Yang et al. 2020a; Wang et al. 2021a). The evolution of the quasar population across cosmic time provides critical insights into the coevolution of supermassive black holes (SMBHs) and their host galaxies. In particular, high-z quasars reveal the rapid growth mechanisms of the first SMBHs (e.g., Wang et al. 2021a) and the early development of their galactic hosts (e.g., Neeleman et al. 2021; Wang et al. 2024). Moreover, they provide key information on the chemical composition and metal enrichment of the intergalactic medium through intervening absorbers (e.g., Becker et al. 2015; Davies et al. 2023), and they also highlight the densest cosmic environments (e.g., Mignoli et al. 2020; Pudoka et al. 2024; Lambert et al. 2024) and play a crucial role in our understanding of how active galaxies drive the cosmic reionization process (e.g., Fan et al. 2023, for a recent review).
In the past two decades, the exploitation of several optical and near-infrared (NIR) wide-area surveys, which mostly cover the northern hemisphere, such as the Sloan Digital Sky Survey (SDSS, York et al. 2000) and the Panoramic Survey Telescope and Rapid Response System (Pan-STARRS1, PS1, Chambers et al. 2016), has resulted in a drastic increase in the number of quasars discovered at z>4 (e.g., Shen et al. 2011; Bañados et al. 2016, 2023; Jiang et al. 2016; Wang et al. 2016; Caccianiga et al. 2019; Gloudemans et al. 2022; Belladitta et al. 2020, 2023). The availability of recently released large-area sky surveys covering large fractions of the southern sky, such as the Dark Energy Survey (DES, Flaugher 2005; Abbott et al. 2018), the DESI Legacy Survey (DELS; Dey et al. 2019), and the SkyMapper (Keller et al. 2007), has made the discovery of high-z quasars in the southern hemisphere possible (e.g., Reed et al. 2017; Pons et al. 2019; Belladitta et al. 2019; Wolf et al. 2020; Onken et al. 2022; Yang et al. 2023; Ighina et al. 2023). The two most luminous high-z quasars discovered so far have been identified in the southern sky. They are SMSS J215728.21−360215.1 at z = 4.75 (Wolf et al. 2018) and SMSS J052915.80−435152.0 at z = 3.98 (Wolf et al. 2024). Their bolometric luminosities exceed 1048 erg s−1, and their z-band magnitudes (AB system) in the Skymapper database are 17.11 and 16.04.
Most of the high-z quasars discovered so far were selected using the Lyman-break technique (i.e., the dropout method; Steidel et al. 1996). Color-color selection techniques, which rely on multiwavelength broadband observations, are among the most commonly used methods for finding high-z quasars. The quasar flux at wavelengths shorter than the Lyα emission line (at rest frame λrf = 1215.67 Å) is absorbed by the intervening neutral medium, causing an extremely red (r−i) or (i−z) color if the source is at z∼5 (r-dropouts) or at ∼6 (i-dropouts), respectively. Recently, however, new selection methods based on machine-learning techniques have led to the discovery of new high-z quasars even in surveys that have been widely explored before (e.g., Wenzl et al. 2021; Yang et al. 2024; Byrne et al. 2024, see also Calderone et al. 2024 for machine learning quasars selection at z∼2.5).
The main results that emerged from the discovery of all these high-z quasars include that i) extremely massive black holes (>108−9 M⊙) are observed in their centers (e.g., Farina et al. 2022; Mazzucchelli et al. 2023). They are comparable to the most massive black holes at any redshift and place important constraints on the nature and growth of primordial black hole seeds (e.g., Inayoshi et al. 2020). ii) They are found in gas-rich, massive, and highly star-forming host galaxies (e.g., Decarli et al. 2018; Neeleman et al. 2021; Wang et al. 2024). iii) No significant redshift evolution for either broad UV emission lines or for the quasar continuum has been found (e.g., Shen et al. 2019; Schindler et al. 2020; Yang et al. 2021; Jiang et al. 2024; D’Odorico et al. 2023); but notable blueshifts have been identified in the C IVλ1549 broad emission line (BEL), with shifts reaching up to >5000 km s−1. These blueshifts are significantly higher than those observed in lower-redshift quasars and suggest an evolution in the quasar outflow properties over cosmic time (e.g., Meyer et al. 2019). iv) About 10–15% of these sources strongly emit in the radio (e.g., Bañados et al. 2015; Liu et al. 2021; Gloudemans et al. 2021; Keller et al. 2024), that is, they are classified as radio-loud (or jetted) active galactic nuclei (AGN)1. High-z radio-loud quasars are indispensable tools for studying the early evolutionary stage of the first jetted SMBHs (e.g., Momjian et al. 2021), their feedback on the host galaxy and the environment (e.g., Hardcastle & Croston 2020; Khusanova et al. 2022; Mazzucchelli et al. 2025), and their contribution to the reionization epoch (e.g., Torres-Albà et al. 2020).
Although the James Webb Space Telescope (JWST) has now spectroscopically confirmed more than 2000 galaxies (e.g., Curtis-Lake et al. 2023; Roberts-Borsani et al. 2025; Heintz et al. 2025; D’Eugenio et al. 2025) and more than 100 UV-faint AGN (with bolometric luminosities of about 1041−44 erg s−1) at z>4 (e.g., Harikane et al. 2023; Greene et al. 2024; Maiolino et al. 2024, 2025; Taylor et al. 2025), high-redshift quasars, which are significantly more luminous than typical galaxies, serve as unparalleled tools for probing key properties of the Universe within its first billion years (e.g., Fan et al. 2023).
To expand the population of high-z quasars, we combined optical, infrared (IR), and radio photometry data sets to identify them throughout the sky. In addition, we present spectroscopic follow-up observations of high-z quasar candidates that are available in published catalogs.
The paper is structured as follows: In Sect. 2 we describe the several selections we made to identify high-z radio-loud and radio-quiet quasar candidates, and in Sect. 3 we present the spectroscopic and photometric follow-up campaigns together with information about the data reduction. The results from these campaigns are described in Sect. 4, and in Sect. 4.1 we provide details and properties of some of the quasars. The black hole mass estimates for a subsample of the quasars are reported in Sect. 5.2. Finally, we summarize the work in Sect. 6.
The magnitudes reported in this work are all in the AB system (unless otherwise specified), and when they are listed in the tables, they are also corrected for Galactic extinction using the extinction law provided by Fitzpatrick (1999), with RV = 3.1. We used a flat Λ cold dark matter (ΛCDM) cosmology with H0 = 70 km s−1 Mpc−1, Ωm = 0.30, and ΩΛ = 0.70. The radio spectral indices are given assuming Sν∝ν−α. All uncertainties are reported at 1σ.
2. Candidates selection
We identified the quasar candidates for further spectroscopic follow-up campaigns using several selection methods, as described below. We provide a detailed description of the selection criteria, except where they have already been published, in which case we include only a summary.
2.1. [RPS1AW] Radio/PS1/AllWISE selection of Belladitta et al. (2023)
The target PSO J200−13 was selected as an i-dropout blazar candidate following the selection of Belladitta et al. (2023). We refer to this selection with the acronym RPS1AW. For completeness, here we report a brief summary of the selection steps. We require detections in the NRAO VLA Sky Survey (NVSS, Condon et al. 1998) in the radio, PS1 in the optical, and the AllWISE Source Catalog (Wright et al. 2010; Mainzer et al. 2011) in the mid-infrared (MIR). From the entire NVSS catalog, we selected bright (S1.4 GHz≥30 mJy) and compact objects to ensure a radio position accuracy better than 2″. We then cross-matched these sources with the PS1 catalog using a maximum separation equal to 2″. This impact parameter guarantees the recovery of more than 90% of the real optical counterparts (Condon et al. 1998). We selected sources with iP1<21.5 outside the Galactic plane (|b| ≥ 20°) to minimize contamination from stars, and at Dec >−25° to exclude optical false objects close to the declination limit of the Pan-STARRS survey. We additionally imposed the following criteria: i) no detection in gP1-band; ii) drop-out: rP1−iP1 ≥ 1.2; iii) blue continuum: iP1−zP1 ≤ 0.5; iv) point-like sources: iP1−iKron < 0.05; and v) no detection in WISE (W2) or iP1−W2Vega < 5. This last constraint has been placed to minimize the contamination by dust-reddened AGN at z = 1−2 (e.g., Caccianiga et al. 2019; Carnall et al. 2015). After applying these filters, 14 candidates remained; 5 of them are known radio quasars at z = 4.7−5.3 (Belladitta et al. 2023 and reference therein). PSO J200−13 was prioritized for spectroscopic follow-up, given its large rP1−iP1∼1.6 color and strong radio emission (S1.4 GHz> 35 mJy). PS1 and WISE magnitudes of this object are reported in Table A.1, together with NIR detections found in the VISTA Hemisphere Survey (VHS, McMahon et al. 2013) DR6 catalog.
2.2. [PS1B23] PS1 i-dropout selection of Bañados et al. (2023)
The quasars PSO J143−21 and PSO J273+38 were recovered from the PS1 i−dropout selection described in Bañados et al. (2023), requiring zP1−yP1<0.5 (see their Section 2.1). We use PS1B23 to allude to this selection. The main selection criteria are summarized here. We selected compact sources by requiring an absolute difference between the aperture and PSF magnitudes to be less than 0.3 in the zP1 or yP1 bands. Furthermore, we requested i) no detection in gPS1, i.e., S/N <3; ii) drop-out: iP1−zP1> 2.0 or iP1,lim−zP1> 2.0, where iP1,lim is the 3σ limiting magnitude for sources undetected in the iP1 band; iii) S/N(zP1) >10, S/N(yP1) >5 and S/N(rP1) <3 or rP1−zP1>2.2. We then performed our own forced photometry on the stacked and single-epoch PS1 images (see Sections 2.2 and 2.3 in Bañados et al. 2014), and we finally visually inspected the stacked and single-epoch images to remove remaining obviously poor candidates and artifacts.
The PS1 magnitudes for PSO J143−21 and PSO J273+38 are shown in Table A.1. For PSO J143−21 we also list the J and K band measurements from VHS DR6. For PSO J273+38 we report the J and K band magnitudes from the UKIRT Hemisphere Survey (UHS, Dye et al. 2018) DR2, together with CatWISE2020 (Eisenhardt et al. 2020; Marocco et al. 2021) W1 and W2 magnitudes.
2.3. [DELS+PS1] z ≳ 6.6 quasar candidates from DELS and PS1
We developed a selection aiming at z≳6.6 quasars combining PS1 and DELS, taking advantage of the different transmission of the zP1 and zDE filters.
Given the sharp break in flux at λ>9250 Å for z>6.6 quasars, which is caused by absorption from intervening neutral Hydrogen, these quasars are largely undetected in the zP1-band. However, they are still strongly detected in the zDE-band and yP1 filters. Fig. 1 shows how effective the zP1−zDE and zDE−yP1 colors can identify z>6.6 quasars, and at slightly lower redshifts if they have weak emission lines. On the other hand, given the smoother decline in the flux of L/T dwarfs (i.e., the main astrophysical contaminants in quasar candidates selection), they are much more likely to be detected in the zP1-band. We excluded sources with bad or low-quality detections in the yP1 band using the same quality flags described in Table 6 of Bañados et al. (2014). We also excluded objects flagged in the zDE band (anymask and allmask not equal to 0). We did not consider sources with high Galactic extinction E(B−V)>0.3. We required S/N >5 in the zDE and yP1 bands and nondetections (S/N <3) in all the other filters from PS1 and DELS. Then, the color criteria are i) zP1,3σ−zDE>0.8 and ii) zDE−yP1>0.5 (Fig. 1). We cross-matched the L and T dwarfs compiled in Bañados et al. (2016) with DELS within s 2″ radius, and show their colors in the right panels of Fig. 1. After applying the two color criteria from this selection, we remove 96% of the L dwarfs and 91% of the T dwarfs. When we started this selection process, only a handful of z≳6.6 quasars were known to meet our criteria (e.g., Venemans et al. 2015; Mazzucchelli et al. 2017). In addition, some of our candidates were independently identified by other works (e.g., Pons et al. 2019; Wang et al. 2019).
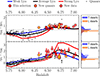 |
Fig. 1. Redshift vs. zP1−zDE (bottom) and zDE−yP1 (top) colors. The solid blue, black, and red lines represent the color tracks of composite quasar spectra from Bañados et al. (2016) and illustrate weak, average, and strong Lyα emission lines, respectively. The dotted lines indicate the color cuts for the [DELS+PS1] selection, as described in Section 2.3. The red circles represent quasars that meet the selection criteria. The sources marked with a yellow cross are newly discovered quasars from this study, while those with a white cross are known quasars for which we present new spectroscopy data. The lower limits correspond to sources that are not detected in zP1, for which we used their 3σ limiting magnitude. On the right, we show the histograms of the same colors for the L and T dwarfs compiled by Bañados et al. (2016). |
Here we present the discovery of six new quasars from our selection: PSO J016+06, PSO J037−08, PSO J041+06, PSO J067−14, PSO J217+04 and PSO J289+50. These quasars have redshifts ranging from 6.3 to 6.9. Additionally, 22 other quasars that meet our criteria have been published in the literature, with redshifts between 6.4 and 7.0 (Venemans et al. 2015; Mazzucchelli et al. 2017; Wang et al. 2017, 2018, 2019; Pons et al. 2019; Bañados et al. 2021, 2025; Yang et al. 2021). We present either independent discoveries or follow-up near-infrared (NIR) spectra (and, in two cases, follow-up NIR photometry) for six quasars already published in the literature: PSO J062−09, PSO J127+41, PSO J129+49, PSO J164+29, PSO J162−01, and PSO J354+21. The coordinates and photometry of the six new quasars presented in this work, along with the six previously known quasars that have new spectra, are reported in Table A.2. In Fig. 1, the new quasars are indicated by red circles with crosses, while the known quasars with new data are shown with red circles featuring the symbol “x”. Additionally, 16 other quasars met our selection criteria (red circles in Fig. 1); their coordinates and photometry are provided in Table B.1.
2.4. [PS1/AllWISE] z > 6.5 quasar candidates from PS1 and AllWISE
PSO J335−15 was selected from the Pan-STARRS1 and ALLWISE catalogs. The main steps are as follows: i) S/N(yP1) > 7 and S/N(W1) > 3 or S/N(W2) > 3; ii) compactness: requiring the absolute difference between the aperture and PSF magnitudes in yP1 band to be less than 0.3; iii) dropout: zP1−yP1> 1.5 and S/N(gP1,rP1) < 3 or S/N(iP1) < 5. Then, forced photometry was performed on the PS1 five-band images with SExtractor (Bertin & Arnouts 1996) and required that the forced magnitudes also satisfy the aforementioned criteria. We then performed an SED fitting analysis of the initially selected z-dropout quasar candidates using optical, NIR, and ALLWISE photometry. The quasar SED models have a single power-law shape with broad emission lines. The slope index and emission line equivalent widths are based on a composite spectrum of low-redshift quasars (Vanden Berk et al. 2001; Selsing et al. 2016) with some scatter. These templates are redshifted with a step of dz = 0.01 from z = 5 to 8 with IGM absorption taken into account at each redshift (Madau 1995). The brown dwarf SED templates are based on BT-SETTL model (Allard et al. 2012), for which we only consider their Solar metallicity models with effective temperatures 400–6000 K. We apply these quasar and brown dwarf SED templates to find the best-fit SED solutions based on chi-square minimization to rank the candidates for follow-up spectroscopy. As a final step, we did a visual inspection of all the targets to remove artifacts. PSO J335−15 has a red z−y = 1.68±0.08 color without significant detection in bluer PS1 filters. Moreover, the public VHS J-band photometry J = 19.71±0.09 implies a flat y−J=−0.10±0.10 color, which is consistent with a quasar SED model at z∼6.5.
2.5. [DVCW] DES/VHS/CatWISE2020 i-dropout selection of Wolf et al. (2024)
The target PSO J060−65 has been selected combining optical data from DES, NIR, MIR photometry from the VHS DR5 and CatWISE2020 (DVCW acronym in column 5 of Table 2). The selection steps are described in details in Wolf et al. (2024). Here, we summarize the main steps. First, a series of photometric cuts were imposed on the g,r,i,z,y Kron magnitude (mag_auto) of the catalog: i) S/N(z) > 10, S/N(y) > 5 and S/N(g) < 3; ii) mag_auto_i − mag_auto_z > 0.8 and mag_auto_z − mag_auto_y < 0.12 and mag_auto_r > 22.5 or mag_auto_i − mag_auto_z > 2.2 and magerr_auto_r > 0.36. Then we adopted as a main filtering step a SED template fitting and photometric redshift computation using the code Le PHARE (v2.2, Arnouts & Ilbert 2011), supplemented with a custom template library for AGN and galaxies (see Sect. 2.1.2 of Wolf et al. 2024). Then, we further extracted forced photometry on optical DES images of the candidates to identify artifacts and problematic blue-band PSF-matched photometry. We discarded candidates for which we measure a significant aperture flux in the g-band (i.e., with errors on g-band aperture magnitudes ap_magerr_g > 0.36 when a positive g-band flux is measured). PSO J060−65 and other 5 sources, published in Wolf et al. (2024), resulted to be among the best candidates from this selection. PSO J060−65 photometric properties are reported in Table A.1.
2.6. [MQC] Radio candidates from the Million Quasar catalog of Flesch (2023)
The Million Quasars Catalogue (MQC2) has been available since its inception in 2009. It has collected the discoveries of quasars at all redshifts published in the literature over the years. In addition, the catalog also provides radio and X-ray information on the included sources (Flesch 2023). Approximately 76% of the objects have spectroscopic redshifts, and their spectra can be found in the literature. However, only photometric redshifts are available for the remaining sources. Thus, a spectroscopic follow-up is necessary to determine the true nature of these objects.
From MQC v8 (Flesch 2023), we selected only objects with radio detection and with a photometric redshift larger than 4, resulting in 218 objects. We specifically focused on radio-detected targets to reduce contamination from ultracool dwarfs. We removed 10 candidates (see Table C.1) based on a cross-match with SIMBAD3 and with SDSS DR18 (Almeida et al. 2023). We conducted a visual inspection using optical PS1 images and NIR images from VHS, UHS and the VISTA Kilo-Degree Infrared Galaxy Survey (VIKING, Edge et al. 2013). We discarded 114 sources detected in the gP1−band, which are likely at a lower redshift. The remaining 97 catalog objects are good g−dropout (at ∼3.5≤z≤4.5) and r−dropout (with redshift between ∼4.5 and 5.5) candidates. In this paper, we present the spectroscopic confirmation of two quasars from this catalog: MQC J021+19 and MQC J133−02, indicated as MQC in Table 2). Their photometry is reported in Table A.1.
2.7. [YS23] Candidates from the DES survey of Yang & Shen (2023)
Yang & Shen (2023, hereafter YS23) provide a catalog of 1.4 million photometrically selected quasar candidates from DES, cross-matched with available NIR and unWISE MIR photometry (Schlafly et al. 2019).
From the YS23 catalog, we selected only objects with a probability of being a quasar larger than 98% and a photometric redshift greater than 5. This resulted in a list of 134 sources. After a visual inspection of all optical images from DES and DELS, and NIR images from VHS, we discarded five sources (see Table C.2). Then, we cross-matched the list of targets with the literature and we found 27 objects already published as high-z quasars (McGreer et al. 2013; Venemans et al. 2013; Reed et al. 2015, 2017; Menzel et al. 2016; Wang et al. 2016; Yang et al. 2016, 2024; Bañados et al. 2014, 2016, 2023; Ighina et al. 2023). Thus, the remaining z>5 quasar candidates are 102. In this paper we report the spectroscopic confirmation of twelve new quasars from this list of candidates, they are marked as YS23 in column 5 of Table 2. Their photometric properties are detailed in Table A.1. Additionally, we provide information about these twelve quasars directly from the YS23 catalog, including their ID, photometric redshift, and quasar probability.
3. Follow-up observations
In this section, we describe the dedicated NIR photometric observations and the spectroscopic campaign for all the sources listed in Tables A.1 and A.2.
3.1. NIR photometry
We obtained NIR follow-up images of all six new quasars discovered by the DELS+PS1 selection, and for the quasars PSO J062−09, PSO J162−01, and PSO J354+21 (see Table A.2 and Sect. 2.3). We also obtained NIR observations for the new quasar PSO J335−15 from the PS1/ALLWISE selection (see Table A.1 and Sect. 2.4). The imaging follow-up was performed with the J, H and Ks filters. The observations have been carried out with the Son OF ISAAC (SofI, Moorwood et al. 1998) instrument mounted on the NTT at La Silla Observatory and the Nordic Optical Telescope near-infrared Camera (NOTCam4) mounted on the Nordic Optical Telescope at the Roque de Los Muchachos Observatory. A summary of these NIR observations is reported in Table 1. A standard data reduction was performed with IRAF (Image Reduction and Analysis Facility, Tody 1993). We obtained the zero points following standard procedures (e.g., see Section 2.6 in Bañados et al. 2014 or Section 3.3 in D’Odorico et al. 2023). We also list photometry of the NIR surveys VHS, UHS, and VIKING in Tables A.1 and A.2.
Summary of the NIR follow-up observations.
3.2. Spectroscopy
The spectroscopic follow-up was carried out over different observing runs and different instruments: EFOSC2 (Buzzoni et al. 1984) at the New Technology Telescope (NTT) located at the Observatory of La Silla, the Folded-port Infrared Echellete (FIRE; Simcoe et al. 2008, 2013) spectrometer at the Magellan/Baade telescope and the Low Dispersion Survey Spectrograph (LDSS3, Boutsia et al. 2017) at the Magellan/Clay telescope, which are both at the Las Campanas Observatory, the near-infrared spectrograph at Gemini North (GNIRS; Elias et al. 2006a, b), the Multi-object Double Spectrograph (MODS; Pogge et al. 2010) and the LBT Utility Camera in the Infrared (LUCI; Seifert et al. 2003) at the Large Binocular Telescope (LBT), the FOcal Reducer/low dispersion Spectrograph 2 (FORS2; Appenzeller & Rupprecht 1992) at the Very Large Telescope (VLT), and the Near-Infrared Echellette Spectrometer (NIRES; Wilson et al. 2004) mounted on the Keck 2 telescope located at W. M. Keck Observatory. The details of the spectroscopic observations are summarized in Table 2, while spectra covering the Lyman-alpha break are shown in Fig. 2. In Fig. 3 we plot the NIR spectra obtained for a subsample of sources.
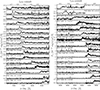 |
Fig. 2. Newly discovered spectra (25 sources; the asterisk marks radio-loud objects) and new spectra publication (six objects, marked with a star) for the quasars reported in this paper. Only the part of the spectrum that covers the Lyman-α break is shown here. The noise spectrum is reported in gray. Sorted by increasing redshift. |
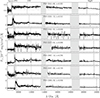 |
Fig. 3. Near-IR follow-up spectra of a subsample of quasars reported in this paper (sorted by increasing redshift). We show the NIR spectra of the newly discovered quasars PSO J041+06, PSO J335−15, PSO J067−14, PSO J217+04, PSO J037−08, and PSO J289+50 and the newly published NIR spectrum for the already known quasar PSO J162−01. The noise spectra are reported in gray. The shaded light gray areas highlight regions that are strongly affected by telluric absorption. The location of the main emission lines according to the Mg II redshift is also shown at the top: Lyman-α+N V (dashed), C IV (dotted), and Mg II (dash-dotted). |
Spectroscopic observations and properties of the newly discovered quasars.
The LBT/MODS and LBT/LUCI observations were carried out in binocular mode (red grating for MODS, and G200 grating coupled with zJ+HK filters for LUCI), except for PSO J127+41, which was observed in monocular mode. All NTT/EFOSC2 observations were conducted using Grism 5 (5200–9350 Å), except for quasars PSO J004−35, PSO J011−37, PSO J334−63 for which Grism 16 (6015–10320 Å) was used. However, the resulting spectra taken with Grism 5 of PSO J017−48, PSO J035−18 and PSO J075−18 showed wiggles in the flux, due to fringing effects in the red part of the EFOSC2 detector combined with the Grism 5. Therefore, these three objects were observed again with Grism 16, and the spectra shown in Fig. 2 are the ones resulting from this last data analysis.
The targets PSO J143−21 and PSO J307−47 were recently reobserved with Magellan/LDSS3 because their NTT/EFOSC2 spectra was very noisy. The two observations are reported in Table 2, but we highlight that the redshift is derived only from the best spectrum (Magellan/LDSS3)5 and that only the latter is shown in Figure 2.
All the spectra were reduced using standard routines, including bias subtraction, flat fielding, sky subtraction, wavelength calibration using exposures of arc lamps and flux calibration using exposures of spectrophotometric standard stars. The spectra were absolute flux calibrated to match the z−band (for all the sources at z≤ 6) or one of the NIR magnitudes (mostly J−band) depending on their redshift. We used the following reduction pipelines: FIREHOSE6, PypeIt7 (Prochaska et al. 2020) and SIPGI8 (Gargiulo et al. 2022). Section 2.4 in Onorato et al. (2025) describes the coadding procedure of the LBT/MODS and Keck/NIRES spectra of PSO J289+50 and of the LBT/MODS+LUCI spectra of PSO J217+04. The coadd is done after the flux calibration procedure using directly the multi_combspec routine of PypeIt, to get a final spectrum covering [8000, 24 700] Å /[8000, 23 900] Å with pixel size of 40 km s−1/58 km s−1 for PSO J289+50 and PSO J217+04, respectively.
For PSO J062−09, PSO J127+41, PSO J129+49, PSO J162−01 and PSO J354+21 we report for the first time unpublished spectra obtained at Magellan, LBT and VLT. The details on these observations are listed in Table 2 and the spectra are shown in Fig. 2. In Fig. 3 we also report the Magellan/FIRE unpublished NIR follow-up of PSO J162−01.
4. New quasars at 4.6 < z < 6.9
We present the discovery of 25 new quasars9 at 4.6<z<6.9; three are radio-loud. To estimate the redshifts, we followed the procedure of Bañados et al. (2023): we fit the spectra of the quasars with different quasar templates, to account for differences in the emission lines properties, especially Lyα. We use the following four templates:
-
strong-Lyα, which is the median of the 10% of the z∼6 PS1 quasars spectra with the largest rest-frame equivalent width for the Lyα+N V emission line, from Bañados et al. (2016).
-
weak-Lyα, which is the median of the 10% of the z∼6 PS1 quasars spectra with the smallest rest-frame equivalent width for Lyα+N V, from Bañados et al. (2016).
-
xqr-30, which is the median of 42 z∼6 high quality quasars spectra observed with X-Shooter and reported in D’Odorico et al. (2023).
-
on25, which is the weighted mean of 33 z>6.5 spectra presented in Onorato et al. (2025).
Then, we choose the best-fitting template with the minimum chi-square in the 1212–1400 Å rest-frame wavelength range. The results are reported in Table 2. We consider 0.03 as the mean uncertainty on the redshift computed using the template method (with a maximum uncertainty of 0.05), as reported by Bañados et al. (2016, 2023).
For PSO J037−08, PSO J041+06, PSO J067−14, PSO J335−15, and PSO J289+50 we use the redshift and the error estimated from the fit of the Mg II broad emission line (see Sect. 5.2 for details). For the already known quasars we listed the Mg II-based redshift reported in Yang et al. (2021), while for PSO J162−01 we estimate the Mg II redshift from the Magellan/FIRE spectrum published in this study.
The apparent and absolute magnitudes at rest-frame wavelength 1450 Å (m1450, M1450) are quantities commonly used to characterize the UV emission in quasars. The apparent and absolute magnitude at 1450 Å of the quasars PSO J037−08, PSO J041+06, PSO J067−14, PSO J162−01, PSO J217+04, PSO J289+50 and PSO J335−15 were derived directly from the fit of the spectra (described in Sect. 5).
In order to determine m1450 in a consistent way for all the objects with only a visible spectrum available, we followed the approach of, e.g., Bañados et al. (2016) and Mazzucchelli et al. (2017). We assumed a power-law continuum slope αν = 0.44 (Vanden Berk et al. 2001). Then we used the z−band magnitude (λeff = 9760 Å for DES and 8700 Å for PS1) to extrapolate the m1450. The redshifts and magnitudes at 1450 Å are reported in Table 2.
4.1. Notes on individual sources
We present additional notes below on selected objects, sorted by right ascension.
4.1.1. MQC J021+19, z = 4.71
This quasar was selected from the MQC v8 as a candidate at zphot = 4.9. The NTT/EFOSC2 discovery spectrum confirms its high-z nature, placing it at a redshift of z = 4.71. The MQC reports a radio detection in the LOw-Frequency ARray (LOFAR) Two-metre Sky Survey (LoTSS, Shimwell et al. 2022) at 150 MHz, in the Rapid ASKAP Continuum Survey (RACS, McConnell et al. 2020; Hale et al. 2021) at 888 MHz and at 3 GHz in the VLA Sky Survey (VLASS, Lacy et al. 2020). We also found a detection at 1.37 GHz (RACS_mid) on the CASDA website10. In Table 3 we listed the available integrated radio flux densities. All these measurements have been quantified by performing a single Gaussian fit (since the source is unresolved) on the images, using the task IMFIT of the Common Astronomy Software Applications package (CASA, McMullin et al. 2007). The source does not show clear signs of variability: the flux densities are all consistent within 1σ and 2σ. However, there may be a decrease in VLASS flux density at 3 GHz from 2019 and 2024. Taking this potential decrease into account, to minimize possible variability issues, we used the radio data closest in time to compute the radio spectral index. These are RACS_mid (1.367 GHz) and VLASS 2.2 (3 GHz). By assuming a single power-law for the continuum radio emission (Sν ∝ ν−αr) we obtained αr = 0.37 ± 0.16 (see Fig. 4, left panel). Simultaneous radio data are necessary to assess the real shape of the radio spectral energy distribution. Then, we computed the value of radio loudness (R). Coincidentally, 5 GHz in the rest frame corresponds to an observed frequency of 0.875 GHz, equal to RACS_low. We therefore used the RACS flux density and the estimated spectral index to compute the 5 GHz rest frame radio flux density. The value of the flux density at 4400 Å rest frame was derived from the i-band de-reddened PS1 magnitude assuming the optical spectral index of Vanden Berk et al. (2001, αν = 0.44). We obtained R = 38 ± 18, where the error takes into account the uncertainties on the flux densities, on the radio spectral index, and on the redshift of the source.
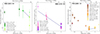 |
Fig. 4. Radio flux densities as a function of the observed (bottom x-axis) and rest-frame (top x-axis) frequency of MQC J021+19 (left), MQC J133−02 (central), and PSO J200−13 (right). The corresponding radio surveys are shown in the legend. Due to the potential flux density variability of MQC 021+19, we report the spectral fit of the two values closest in time (RACS_mid and VLASS 2.2). Similarly for PSO J200−13, which shows clear evidence of variability on timescales of years. We report the single power-law fit computed between WALLABY December 2021 and VLASS 2.2, which are the two values closest in time. |
Summary of the archival radio observations of MQC J021+19.
From the NTT/EFOSC2 spectrum shown in Fig. 2 it is clear that there is an absorption blue-ward the N V line. This feature has a width of ∼4800 km s−1 and is likely associated with a N V Broad Absorption Line (BAL, Weymann et al. 1991) outflow with a maximum velocity of ∼5000 km s−1. A high S/N spectrum covering NIR wavelengths could confirm the presence of such an outflow in other atomic species (e.g., C IV, Si IV, Mg II).
4.1.2. PSO J037−08, z = 6.725
This quasar was discovered with a 700s spectrum with FIRE in longslit mode on Dec. 2018 and then a follow-up for 2 hours with FIRE in Echelle mode in Jan. 2019 (Table 2). We only show the higher S/N and resolution Echelle spectrum in Figs. 2 and 3.
The J-band magnitude estimate from our follow-up with NTT/SofI (see Table A.2) is consistent with the detection in the VHS DR6: JVHS = 20.92±0.14.
We note that this quasar is part of the JWST ASPIRE program (Wang et al. 2021b) and its [CII] properties have been reported in Wang et al. (2024). We used the Mg II BEL to estimate its redshift: z = 6.725±0.002 (see Table 2), which is consistent with the systemic redshift measured from the [CII] line (6.7249±0.0002, Wang et al. 2024). The difference between the two redshift values is Δv=(4±78) km s−1.
4.1.3. PSO J041+06, z = 6.321
Figure 3 shows the Gemini/GNIRS spectrum of this source, covering from the Lyman break to the Mg II broad emission line. The Mg II is clearly detected and sets the redshift of this quasar at z = 6.321 (see Table 2). This is the lowest redshift quasar confirmed from the z≳6.6 selection presented in Sect. 2.3. Such a low redshift can be explained by a very weak Lyα line (see Fig. 1), which could be intrinsic or due to a proximate absorber truncating the emission (e.g., Bañados et al. 2019). Conversely, the C IV is very weak, with an Equivalent Width (EW) <10 Å (see more details in Sect. 5), making PSO J041+06 a weak emission line quasar (WLQ; Fan et al. 1999; Diamond-Stanic et al. 2009). Furthermore, the C IV is blueshifted with respect to Mg II, by ∼9000 km s−1, the largest ever measured in the early Universe (see Sect. 5.1 for caveats and discussion).
4.1.4. PSO J067−14, z = 6.705
Similarly to PSO J037−08, this quasar is part of the JWST ASPIRE program (Wang et al. 2021b) and Wang et al. (2024) report the [CII] detection of PSO J067−14, finding a redshift of z[CII] = 6.7142±0.0006. The difference in km s−1 between the [CII]-based redshift and the one computed in this work from the Mg II line (6.705 ± 0.002, see Table 2) is Δv=(359±85) km s−1, which is in line with values estimated in quasars at similar redshift (e.g., Schindler et al. 2020; Yang et al. 2021).
As several absorption features are clearly visible in the spectrum, we used the method adopted in Bischetti et al. (2022, 2023) to detect and characterize possible BAL outflows in this quasar. The main steps include modeling the intrinsic quasar emission using a composite template spectrum that matches the continuum slope and equivalent width of the C IV emission line in PSO J067−14. The composite template is normalized to the median continuum flux in the wavelength range rest-frame 1650–1750 Å (according to the Mg II redshift). A normalized spectrum is obtained by dividing the spectrum of PSO J067−14 by the composite template, as shown in Figure 5.
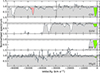 |
Fig. 5. Normalized spectrum of PSO J067−14, smoothed to 500 km s−1. The velocity axis in each panel is relative to the rest-frame wavelength of the ionic species indicated by the label. The vertical solid, dashed, dotted, and dash-dotted lines indicate the velocity associated with the C IV, Si IV, N V, and Mg II emission lines, respectively. The solid (dashed) horizontal line represents a flux level of 1.0 (0.9). BAL troughs, corresponding to a flux level <0.9 (Weymann et al. 1991), are highlighted as shaded green areas. The shaded red area indicates a potential extremely high-velocity (∼47 000 km s−1) C IV BAL. |
We detected an absorption feature blue-ward of C IV, tracing a BAL outflow with a width of ∼2700 km s−1, a maximum velocity of ∼2900 km s−1 and a balnicity index BI ∼ 1600 km s−1, that is a modified equivalent width of the BAL absorption, calculated according to Eq. (1) in Bischetti et al. (2023), which follow the traditional BI definition of Weymann et al. (1991). We consider that C IV optical depth is usually similar or larger than the Si IV depth in BAL quasars (e.g. Gibson et al. 2009; Dunn et al. 2012). This allowed us to use the velocity range of the C IV BAL troughs to identify absorption associated with Si IV and N V, as reported before (e.g., Bruni et al. 2019; Bischetti et al. 2023). We identified an associated Si IV and N V absorption, as highlighted in Figure 5.
We note an additional absorption feature at ∼1305 Å that might be interpreted as related to the CII λ1335 Å transition, which would make PSO J067−14 the second low-ionization broad absorption line (Lo-BAL) quasar identified at z>6 (Bischetti et al. 2023, 2024). However, the lack of strong Mg II absorption questions the above interpretation (see last panel of Fig. 5). Alternatively, the ∼1300 Å absorption feature might be associated with an extremely high-velocity (∼47 000 km s−1, red line in Figure 5) C IV BAL outflow. We note that applying the relativistic correction yields a slightly higher velocity of ∼51 000 km s−1. Similar velocities have been observed in other three z≳6 quasars by Bischetti et al. (2022) and Wang et al. (2021a), but are rare (a few percent) in SDSS BAL quasars at z<4 (e.g., Rodríguez Hidalgo et al. 2020).
Finally, the spectrum of PSO J067−14 reveals the presence of an absorption system at zabs = 4.94, traced by the Mg II and FeII transitions at 2374 Å and 2382 Å.
4.1.5. PSO J082−38, z = 5.10
Similarly to MQC J021+19, this spectrum shows potential evidence of absorption blue-ward of N V. As this absorption has a width of ∼3600 km s−1, PSO J082−38 likely hosts a N V BAL outflow with a maximum velocity of ∼4200 km s−1. A higher S/N spectrum, also covering redder wavelengths, is necessary to confirm and properly characterize the BAL features also from other atomic species.
4.1.6. MQC J133−02, z = 4.67
This source is reported in the MQC with a zphot = 5.9. Because of its detection in rP1 band, however, we considered that the photo-z was overestimated. We measured z = 4.67 from the NTT/EFOSC2 spectrum.
According to the MQC, MQC J133−02 has a radio detection at 0.887 GHz in RACS and at 1.4 GHz in the Faint Images of the Radio Sky at Twenty-cm (FIRST, Becker et al. 1994) and in the NVSS. We also retrieved the RACS_mid image at 1.37 GHz from CASDA. On the RACS_mid image, we performed a single Gaussian fit using the CASA task IMFIT to quantify the flux density. MQC J133−02 is clearly detected at 3 GHz in the VLASS 1.1, 2.1 and 3.1 epoch images. From a Gaussian fit performed in CASA we estimated the three radio flux densities. MQC J133−02 is also marginally detected (∼3σ) in the TIFR GMRT Sky Survey (TGSS, Intema et al. 2017) at 150 MHz, with a peak flux density of ∼11 mJy. Table 4 summarizes the radio detections available for this quasar, while Figure 4 (central panel) shows the radio spectral energy distribution. No significant variability is detected between FIRST and NVSS at 1.4 GHz and between the three VLASS epochs (all measurements are consistent within 1σ). By assuming a single power-law for the continuum radio emission, we obtained a radio spectral index (αr) between 0.8875 and 3.0 GHz of 0.56 ± 0.20. Then, we computed the values of radio loudness as already done for MQC J021+19. Given that 5 GHz in the rest frame corresponds to a frequency of 0.880 GHz, we used the RACS flux density and the estimated spectral index to compute the 5 GHz rest frame radio flux density. The value of the flux density at 4400 Å rest frame was derived from the z-band de-reddened PS1 magnitude assuming the optical spectral index of Vanden Berk et al. (2001, αν = 0.44). We obtained R = 280 ± 130, where the error takes into account the uncertainties on the flux densities, on the radio spectral index, and on the redshift of the source.
Summary of the archival radio observations of MQC J133−02.
4.1.7. PSO J143−21, z = 5.97
PSO J143−21 was part of the candidates selected by Bañados et al. (2023), but its spectroscopic confirmation occurred after that publication was completed. It therefore satisfied all the selection criteria reported in Sect. 2.2 of Bañados et al. (2023). However, its color in the latest version of PS1 data release (DR2) is iP1−zP1 = 1.9, and would not have been selected.
The analysis of the new spectrum obtained recently with Magellan/LDSS3 show three distinct absorption systems, identified by the Mg II doublet and FeII transitions at 2586 Å /2600 Å. These systems are located at redshifts zabs = 2.6624, 2.6584 and 2.4650 respectively.
4.1.8. PSO J162−01, z = 6.656
The discovery of this quasar has been already reported by Wang et al. (2017). In this work we show unpublished spectra, taken with VLT/FORS2 and Magellan/FIRE (see Table 2 for details). The Mg II-based redshift estimated by our analysis (z = 6.656±0.001, see Table 2) is consistent within 2σ with the one reported in Farina et al. (2022) (6.640 ).
).
This quasar is detected in the YJHKs bands of VIKING DR5: Y = 20.99±0.10, J = 21.44±0.12, H = 20.49±0.11, Ks = 20.43±0.12. These values are consistent with the photometry reported for this source in Table A.2.
Finally, the Magellan/FIRE spectrum reveals the presence of two absorption systems traced by the Mg II doublet and Fe II transitions at 2586 Å /2600 Å: zabs = 3.497 and 3.746, respectively.
4.1.9. PSO J164+29, z = 6.585
At the optical coordinates of this quasar we found a ∼4.5σ radio detection in the LOFAR LoTSS survey (144 MHz). The quasar is not detected in any other radio survey that covers this part of the sky (e.g., RACS, FIRST, NVSS, VLASS). We measured the flux density directly from the LOFAR LoTSS image by using the CASA software. The source is unresolved, with a peak flux density of (451±97) μJy. This flux density corresponds to a radio luminosity at 144 MHz equal to 3.2 ± 0.6 × 1041 erg s−1. Then we computed the value of R, by assuming a radio spectral index of 0.29 (typical of high redshift quasars detected in LoTSS, see Gloudemans et al. 2022) and by computing the flux density at 4400 Å starting from the W1 magnitude (see Table A.2, i.e., 4400 Å rest frame corresponds to 33374 Å in the observed frame, which matches the W1 filter). We obtained a value of 21 ± 10, which allowed us to define PSO J164+29 as a radio-loud source. Additional radio data are needed to compute the actual radio spectral index of the source and then a more precise value of R.
4.1.10. PSO J200−13, z = 4.71
PSO J200−1311 is a powerful radio source, with a flux density of 36 ± 1.2 mJy at 1.4 GHz (NVSS). This quasar is also detected in the following radio surveys (see Table 5): TGSS at 150 MHz, the GaLactic and Extragalactic All-sky MWA Survey (GLEAM, Wayth et al. 2015; Hurley-Walker et al. 2017) from 76 to 231 MHz, the Westerbork in the Southern Hemisphere (WISH) Survey (De Breuck et al. 2002) at 325 MHz, RACS at 888 MHz and 1.38 GHz, the Widefield ASKAP L-band Legacy All-sky Blind surveY (WALLABY, Koribalski et al. 2020) at 1.37 GHz, the VLASS at 3 GHz and the Parkes-MIT-NRAO (PMN) survey (Wright et al. 1994) at 4.85 GHz. WALLABY and VLASS flux densities have been computed from a single Gaussian fit (CASA IMFIT) on the images. Massaro et al. (2014) included PSO J200−13 in the LOw frequency Radio CATalog of flat spectrum sources (LORCAT), due to the availability of NVSS and WISH flux densities (αlow = 0.37±0.05). Fig. 4 (right panel), shows that PSO J200−13 radio emission is characterized by variability on timescales of few years (observed frame, i.e., hundreds of days in the rest frame). Because of the different angular resolutions of the radio surveys in which PSO J200−13 is detected, the measured flux difference could also be due to the presence of other nearby sources that, in some cases, are not resolved because of a large radio beam. Therefore, we checked that there were no contaminating sources, and we can confirm that the flux density measured in all radio images is coming from the quasar. To compute the source's radio spectral index, we use the closest flux densities in time (the WALLABY Dec. 2021 and VLASS2.2 observed in Jan. 2022, see Fig. 4) to minimize variability effects. We obtained a flat spectral index: 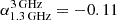 ± 0.15. Then, we computed the values of radio loudness, following the same procedure for MQC J021+19 and MQC 133−02. We started from the z-band de-reddened magnitude to compute the value of the flux density at 4400 Å rest frame (by assuming again αν = 0.44). Given that 5 GHz in the rest frame corresponds to a frequency of 0.873 GHz, we used the RACS flux density and the estimated spectral index to compute the 5 GHz rest frame radio flux density. We obtained R = 830±70. The high value of radio loudness, the flat radio spectral index, and variability indicate that this source could be classified as a blazar, i.e. a radio-loud AGN with the relativistic jet pointed towards the Earth, in agreement with the classification presented in Massaro et al. (2014). Simultaneous radio observations on a wide range of frequencies are necessary to definitively assess the radio spectral shape of this source. Furthermore, PSO J200−13 has a clear detection at X-ray frequencies in the eROSITA-DE Data Release 1 (DR1, Merloni et al. 2024). The source is identified as 1eRASS J132206.5-132350, and the separation between optical PS1 and eRASS coordinate is 4
 4 (i.e. well within the 16″ PSF of eROSITA, Merloni et al. 2024). The net counts in the 0.2–2.3 keV bands are 19.22, with 4.73 expected background counts. The catalog also reported an estimated X-ray flux in the same band of 1.26 ± 0.31 × 10⁻¹³ erg s−1 cm−2 (see Merloni et al. 2024 for more details). More information about the X-ray eROSITA properties of this source will be presented in Hämmerich et al. (in prep.) and Sbarrato et al. (in prep.).
Summary of the archival radio observations of PSO J200−13.
4.1.11. PSO J217+04, z = 6.72
This source was first considered a promising quasar candidate from 900 s Magellan/FIRE longslit observation carried out in May 2023, identified from the 2D spectrum. However, these data were not of sufficient quality for publication. Therefore, a follow-up with LBT/MODS (covering the wavelength range from ∼6000 to ∼10 000 Å) and LBT/LUCI (covering the NIR up to about 24 000 Å) was carried a month later (see Table 2). In this paper we report in Fig. 3 only the coadd of the LBT spectra.
The low value (<10 Å) of C IV EW (see Table 6) allowed us to classify PSO J217+04 as a WLQ, similar to PSO J041+06.
5. Analysis of the NIR spectra: Emission line properties and black hole masses
In this section we report the analysis of the spectra shown in Fig. 3 for the study of the C IV and Mg II BELs and the consequent estimation of black hole masses.
We analyzed the NIR spectra of PSO J037−08, PSO J041+06, PSO J067−14, PSO J162−01, PSO J217+04, PSO J289+50 and PSO J335−15 (see Fig. 3) using the Sculptor software12 (Schindler 2022) to derive the properties of these two BELs and compute black hole masses. We followed an approach used in several studies in the literature (e.g., Mazzucchelli et al. 2017; Vito et al. 2022; Farina et al. 2022). First, we subtracted the continuum emission – which is described by a power law (fpl∝(λ/2500 Å)αλ), an iron pseudo-continuum template, and a Balmer pseudo-continuum – from the spectra. We modeled the Fe II contribution with the empirical template of Vestergaard & Wilkes (2001), which is used in the derivation of the scaling relation that we later consider for estimating the black hole mass of the quasars. To perform the continuum fit, we chose a region of the quasar continuum free of broad emission lines and of strong spikes from residual atmospheric emission. We then subtracted the entire pseudo-continuum model from the observed spectra, and modeled the two BELs with Gaussian functions. For PSO J067−14 and PSO J289+50 we masked the absorption feature in the middle of the C IV to fit the line properly. The results of this fitting procedure are shown in Fig. 6 and Table 6.
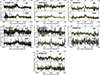 |
Fig. 6. Close-up views of the spectral fit of the C IV and Mg II BELs. The orange curves depict the models we fit, which consist of Gaussian components for the emission lines and a continuum model (see text for details). The transparent vertical blue line indicates the position of the lines based on the redshift reported in Table 2 (i.e., the Mg II-based redshifts). The same redshifts were used to draw the rest-frame wavelength x-axes. To fit the C IV line in the spectra of PSO J067−14 and PSO J289+50, the absorption features were masked. |
5.1. The C IV–Mg II velocity shift
Velocity shifts between emission lines in quasars spectra were first identified decades ago (e.g., Gaskell 1982) and remain a widely debated topic for quasars at any cosmic time (e.g., Shen et al. 2016; Coatman et al. 2017; Ge et al. 2019; Meyer et al. 2019; Schindler et al. 2020; Onoue et al. 2020; Yang et al. 2021; Stepney et al. 2023). Broad high-ionization lines, such as C IV and Si IV, are known to exhibit particularly large blueshifts compared to lower-ionization lines (e.g., Mg II). The origin of these shifts is often attributed to nongravitational effects, such as radiation-driven outflows, most likely originating in disk winds (e.g., Richards et al. 2011 and reference therein).
Strong C IV–Mg II blueshifts (>3000 km s−1) are commonly observed in a large fraction of z≥6 quasars (e.g., Mortlock et al. 2011; De Rosa et al. 2014; Mazzucchelli et al. 2017; Bañados et al. 2018; Meyer et al. 2019; Shen et al. 2019) and recent studies pointed out an evolution with redshift (up to z∼7) of the C IV–Mg II shift (e.g., Meyer et al. 2019; Schindler et al. 2019; Yang et al. 2021), implying a change of quasar-driven winds properties over cosmic time. Large C IV blueshifts translate into asymmetrical broad-line profiles, suggesting that nonvirial motions have a significant effect on the observed emission velocity profile. To date, the strongest C IV velocity shifts have been observed in the so-called WLQs, which exhibit a rest frame equivalent width (REW) values smaller than 10 Å (e.g., Diamond-Stanic et al. 2009).
In this work we measured the C IV–Mg II velocity shift for the quasars reported in Fig. 3. We computed the C IV redshift from the peak of the BEL. Then we computed the velocity shift between C IV and Mg II by using the following equation:
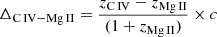 (1)
(1)
The velocity shift values are reported in Table 6, together with the estimated REW. Figure 7 shows our results on the so-called C IV plane, where we also report the C IV blueshift and REW of z>5.7 quasars from the literature (Shen et al. 2019; Schindler et al. 2020; Yang et al. 2021) and of low-z quasars from the SDSS DR16 (gray dots and contours). These low-z sources have been selected from the catalog of Wu & Shen (2022) to be at 0.35 <z< 2.25 (where the Mg II BEL falls in the SDSS wavelength range) and to have a valid measure of the virial black hole mass, bolometric luminosity, Eddington ratio and emission lines properties. We also display low-z WLQs from the works of Wu et al. (2011), Luo et al. (2015), and Plotkin et al. (2015). As can be noticed from Fig. 7, all the quasars analyzed in this work show a similar shift to that of the bulk of the high-z population, except for PSO J041+06, which is an outlier in this plot. In fact, this quasar has a C IV–Mg II shift >9000 km s−1, the highest ever recorded at z>6. The only low-z quasar we could find on a similar C IV parameter space is J1219+1244 at z = 2.233, which is an X–ray weak WLQ from the sample of Wu et al. (2011), highlighting the exceptional rarity and uniqueness of such WLQs with wind-dominated Broad Line Regions (BLRs).
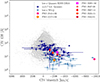 |
Fig. 7. C IV EW as a function of the C IV–Mg II velocity shift for seven quasars reported in this paper. The dark blue triangles represent z>5.7 quasars from Shen et al. (2019), Schindler et al. (2020) and Yang et al. (2021), and the light blue stars show the WLQ samples of Wu et al. (2011), Luo et al. (2015), and Plotkin et al. (2015). The gray contours and gray dots show the low-z comparison sample at 0.35 <z< 2.25 from the SDSS DR16 catalog of Wu & Shen (2022). Our sample generally follows the high-z quasars distribution. The only exception is the quasar PSO J041+06, which shows a velocity shift >9000 km s−1 and an EW value of 6 Å, typical of a WLQ. The only object similar to PSO J041+06 is J1219+1244 at z= 2.233. |
While the C IV line is detected in the spectrum, its derived properties remain uncertain due to the low S/N and resolution of the data. A higher S/N and resolution spectrum is needed (e.g, with VLT/X-Shooter) to better characterize the C IV properties.
5.2. Estimates of the black hole mass
For unobscured type-1 quasars, the most common technique used to compute the mass of the central black hole is the single-epoch (SE) method. Based on the assumption that the gas in the BLR is virialized, the line-width of BELs is used to trace the velocity distribution of the gas. When combined with the luminosity of the accretion disk continuum (i.e., a proxy of the distance of the gas from the central SMBH), MBH can be estimated from the virial relation (e.g., Vestergaard & Peterson 2006; Vestergaard & Osmer 2009; Shen et al. 2008, 2011). This method made it possible to estimate the mass of SMBHs hosted by high-z quasars mainly using C IV and Mg II BELs that fall in the wavelength range of most optical/NIR instruments mounted on ground-based telescopes (e.g., Jiang et al. 2007; Wu et al. 2015; Mazzucchelli et al. 2017, 2023; Shen et al. 2019; Onoue et al. 2019; Wang et al. 2021a; Diana et al. 2022; Farina et al. 2022; Vito et al. 2022; Belladitta et al. 2023).
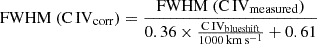
For the Mg II line, we used the single-epoch scaling relation presented by Vestergaard & Osmer (2009), for a direct comparison with other estimates in the literature:
![Mathematical equation: $$ {\mathrm {M}}_{{\mathrm {BH}}} = 10^{6.86} \left [ \frac {{\mathrm {FWHM\ (Mg\,{{II}})}}}{1000 \, {\mathrm {km/s}}} \right ]^2 \left [\frac {\lambda L_{\lambda } (3000 \, {\mathrm {\mathring{{\mathrm{A}}}}})}{10^{44} \, {\mathrm {erg/s}}} \right ]^{0.5} $$](/articles/aa/full_html/2025/07/aa54859-25/aa54859-25-eq5.gif) (2)
(2)
For the C IV, we used the scaling relation of Vestergaard & Peterson (2006), which is the most frequently used in the literature:
![Mathematical equation: $$ {\mathrm {M}}_{{\mathrm {BH}}} = 10^{6.66} \left [ \frac {{\mathrm {FWHM\ (C\,{{IV}}_{{corr}})}}}{1000 \, {\mathrm {km/s}}} \right ]^2 \left [\frac {\lambda L_{\lambda } (1350 \, {\mathrm {\mathring{{\mathrm{A}}}}})}{10^{44} \, {\mathrm {erg/s}}} \right ]^{0.53}, $$](/articles/aa/full_html/2025/07/aa54859-25/aa54859-25-eq6.gif) (3)
(3)
where FWHM (C IVcorr) is the width of the C IV line corrected by potential blueshift effects according to Coatman et al. (2017):
 (4)
(4)
In Eq. (2) and Eq. (3) λLλ(3000 Å) and λLλ(1350 Å) are the monochromatic luminosity at 3000 Å and 1350 Å derived from the best-fit model of the continuum. Table 7 reports the estimated values of black hole masses, including only statistical uncertainties. In addition to this statistical error, we must also consider the intrinsic scatter of the used scaling relation: 0.36–0.43 dex for C IV from Vestergaard & Peterson (2006) and 0.55 dex for Mg II from Vestergaard & Osmer (2009).
The value of the black hole masses allowed us to derive the Eddington ratio, which quantifies how fast the black hole is accreting with respect to the Eddington limit: λEdd = Lbol/LEdd. Here, LEdd is the Eddington luminosity, the maximum luminosity beyond which radiation pressure overcomes gravity13, and Lbol is the bolometric luminosity, which is the total energy produced by the quasar per unit of time integrated over all wavelengths. We derived the bolometric luminosity by following the equation in Shen et al. (2008):
 (5)
(5)
The values are reported in Table 7 together with the corresponding values of the Eddington ratio. Figure 8 shows that the quasars in our sample are located close to the line of Eddington luminosity, indicating that their central SMBHs are accreting close to the Eddington limit. The quasar PSO J037−08 has an Eddington ratio larger than 2, which suggests a super-Eddington accretion regime. This is not uncommon at these redshifts, since other few quasars have been reported to be super-Eddington in the literature (see e.g., Bañados et al. 2021; Yang et al. 2021).
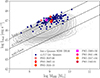 |
Fig. 8. Bolometric luminosities vs. Mg II black hole masses of seven quasars reported in this paper. We also show z≥6 quasars from the literature (dark blue dots; Fan et al. 2023; Mazzucchelli et al. 2023) and quasars at 0.35 <z< 2.25 from the SDSS DR16 catalog (gray contours and gray points; Wu & Shen 2022). The dotted black lines show the location of a constant accretion rate at 0.01, 0.1, and 1 times the Eddington luminosity. Our quasars reside in the same parameter space as the population of z>6 quasars. |
The values of MBH and λEdd of the newly discovered high-z quasars in this work are in line with those derived for z≥6 quasars already reported in the literature (e.g., Mazzucchelli et al. 2023), as shown in Fig. 8. These values are also in line with those derived by Hβ λ4861 for z>6 quasars recently observed with JWST (e.g., Loiacono et al. 2024; Eilers et al. 2023). For comparison, we also show in Fig. 8 the distribution of Lbol and MBH of low-z quasars (same sources as Fig. 7).
6. Summary and conclusions
We reported the discovery of 25 quasars at 4.6<z<6.9, with 1450 Å rest-frame absolute magnitudes between −25.4 and −27.0. These objects were selected based on a number of criteria (Sect. 2) and were spectroscopically confirmed through dedicated follow-up campaigns at several ground-based facilities (Sect. 3.2). We further presented unpublished spectra of six quasars at z>6.5 from the literature.
Three of the new quasars (MQC J021+19, MQC J133−02, and PSO J200−13) show intense radio emission, with a 1.4 GHz luminosity in the range 0.09–1.0 × 1034 erg s−1 Hz−1. All of them are classified as radio loud, with a radio loudness in the range ∼30–850. They are compact at all frequencies at the resolution of the available radio images. Overall, the radio properties of these three new radio-loud quasars (spectral indices, radio loudness, and radio luminosities) are within the range of values of other previously discovered radio-loud quasars at z>4.5 (e.g., Belladitta et al. 2019; Gloudemans et al. 2022; Ighina et al. 2024). The properties of quasar PSO J200−13 are typical of blazars, that is, a subclass of radio-detected quasars whose relativistic jet points toward the Earth: a flat radio spectrum (αr=−0.11), log(R) > 2.5 and variability at several radio frequencies at different timescales. It is also detected in the X-ray by the eROSITA-DE DR1 (f0.2−2.3 keV∼1.3×10⁻¹³ erg s−1 cm−2).
We further reported the radio identification of quasar PSO J164+29. It is detected only in the LOFAR LoTSS at 144 MHz, and this makes the measured radio loudness uncertain (R = 21 ± 10) because it strongly depends on the assumption of the radio spectral index. Additional multifrequency radio data are essential to confirm the radio-loud classification of this quasar.
For seven sources, we also reported NIR spectroscopic follow-up to unveil the C IV and Mg II BELs (see Fig. 3) and computed single-epoch black hole masses and Eddington ratios. Their values agree with the typical MBH and λEdd of the population of high-z quasars reported in the literature (e.g., Farina et al. 2022; Mazzucchelli et al. 2023).
The NIR spectral analysis of quasar PSO J041+06 classifies it as a WLQ (with C IV EW of 6 Å). Moreover, the source shows the largest C IV-Mg II velocity shift ever measured at a z>6: ∼9000 km s−1, which suggests strong outflows on the BRL-scale. WLQs with a wind-dominated BLR are rare sources: by exploiting the SDSS DR16 catalog and other works in the literature, we were able to find only one analog at low z.
Quasar PSO J067−14 shows strong absorption features in the NIR spectrum blueward of the C IV, N V, and Si IV emission lines. These features have a maximum velocity of ∼2900 km s−1, which classifies the source as a high-ionization BAL (HiBAL) quasar. An additional absorption feature at ∼1300 Å (rest frame) might be associated with an extremely high-velocity (v∼0.16c) C IV BAL outflow.
Two other quasars (MQC J021+19 and PSO J082−38) were classified as HiBALs based on the absorption feature blueward of the N V that was clearly visible in their optical spectra. An NIR follow-up is necessary to confirm this classification, however, by detecting the absorption feature in other atomic species. The strong radio emission of MQC J021+19 classifies it as a radio-BAL. These sources are rare among the BAL population (<10−20%; e.g., Hewett & Foltz 2003; Morabito et al. 2019).
The discovery and characterization of the quasars we reported was based on extensive spectroscopic follow-up campaigns at several ground-based telescopes. A list of all observed objects that we found to be nonquasars at high−z (73 sources) is given in the appendix. Most of these rejected candidates (51) are ultracool dwarfs, which remain the main source of astrophysical contamination in the search for quasars based primarily on color selection and the dropout technique.
Another source of astrophysical contamination are galaxies at low redshift, where the D4000 Å calcium break mimics the Lyman-α break. This is especially true when quasar candidates are selected from radio surveys (see Table C.3). Ultracool dwarfs can also be contaminants in radio selections (see Table C.3), however, especially when objects with radio flux density at about millijansky are selected, as was also demonstrated by Gloudemans et al. (2023).
Most of the newly discovered quasars we reported are located in the southern hemisphere. This provides the ideal basis for follow-up investigations using the most recent (e.g., the Very Large Telescope, the Atacama Large Millimiter Array) and future (e.g., the Extremely Large Telescope, the Square Kilometer Array) ground-based facilities that focus on properties such as the metallicity of the gas surrounding the central SMBHs, the intergalactic medium along the line of sight, the mass, star formation rate, gas content, the internal dynamics of host galaxies, and their large-scale environment.
The discovery and characterization of the quasars we reported were based on the in-depth exploration of surveys that have been widely used. We confirmed that these data sets can still be exploited for the discovery of quasars in the bright tail of their luminosity function. With the advent of wide surveys, such as the European Space Agency (ESA) Euclid (Euclid Collaboration: Scaramella et al. 2022; Euclid Collaboration: Mellier et al. 2025) or the Legacy Survey of Space and Time (LSST) by the Vera C. Rubin Observatory (Ivezić et al. 2019), fainter quasars will eventually be discovered (e.g., Euclid Collaboration: Barnett et al. 2019; Nanni et al. 2022; Tee et al. 2023; Lenz et al. 2024). This promises fundamental progress in our knowledge of the faint end of the quasar luminosity function in the reionization epoch.
A source is considered to be radio loud when the radio loudness (R) is >10, with R defined as the ratio of the 5 GHz and 4400 Å rest-frame flux densities: R=S5 GHz/S4400 Å (Kellermann et al. 1989). The origin of the radio emission in radio-loud quasars is synchrotron radiation, which is produced by charged particles that are accelerated and collimated relativistically in a strong magnetic field, mostly along bipolar jets that are emitted from the central SMBH (e.g., Bridle & Perley 1984; Zensus 1997).
The redshift obtained from the fit of the Magellan/LDSS3 spectra are consistent with the measurement previously obtained from the NTT/EFOSC2 spectra.
In Appendix C.2, we report the objects that turned out to be not high-z quasars after spectroscopic follow-up campaigns (73 in total).
During the revision process of this work, PSO J200−13 was independently reported by Ighina et al. (2025).
LEdd = 1.26  × 1038 erg s−1.
References
- Abbott, T. M. C., Abdalla, F. B., Allam, S., et al. 2018, ApJS, 239, 18 [Google Scholar]
- Ahumada, R., Allende Prieto, C., Almeida, A., et al. 2020, ApJS, 249, 3 [NASA ADS] [CrossRef] [Google Scholar]
- Allard, F., Homeier, D., & Freytag, B. 2012, Philos. Trans. R. Soc. Lond. Ser. A, 370, 2765 [Google Scholar]
- Almeida, A., Anderson, S. F., Argudo-Fernández, M., et al. 2023, ApJS, 267, 44 [NASA ADS] [CrossRef] [Google Scholar]
- Appenzeller, I., & Rupprecht, G. 1992, Messenger, 67, 18 [NASA ADS] [Google Scholar]
- Arnouts, S., & Ilbert, O. 2011, Astrophysics Source Code Library, [record ascl:1108.009] [Google Scholar]
- Astropy Collaboration (Price-Whelan, A. M., et al.) 2018, AJ, 156, 123 [Google Scholar]
- Bañados, E., Venemans, B. P., Morganson, E., et al. 2014, AJ, 148, 14 [Google Scholar]
- Bañados, E., Venemans, B. P., Morganson, E., et al. 2015, ApJ, 804, 118 [Google Scholar]
- Bañados, E., Venemans, B. P., Decarli, R., et al. 2016, ApJS, 227, 11 [Google Scholar]
- Bañados, E., Venemans, B. P., Mazzucchelli, C., et al. 2018, Nature, 553, 473 [Google Scholar]
- Bañados, E., Rauch, M., Decarli, R., et al. 2019, ApJ, 885, 59 [CrossRef] [Google Scholar]
- Bañados, E., Mazzucchelli, C., Momjian, E., et al. 2021, ApJ, 909, 80 [CrossRef] [Google Scholar]
- Bañados, E., Schindler, J. -T., Venemans, B. P., et al. 2023, ApJS, 265, 29 [CrossRef] [Google Scholar]
- Bañados, E., Momjian, E., Connor, T., et al. 2025, Nat. Astron., 9, 293 [Google Scholar]
- Becker, R. H., White, R. L., & Helfand, D. J. 1994, in Astronomical Data Analysis Software and Systems III, eds. D. R. Crabtree, R. J. Hanisch, & J. Barnes, ASP Conf. Ser., 61, 165 [NASA ADS] [Google Scholar]
- Becker, G. D., Bolton, J. S., & Lidz, A. 2015, PASA, 32, e045 [NASA ADS] [CrossRef] [Google Scholar]
- Belladitta, S., Moretti, A., Caccianiga, A., et al. 2019, A&A, 629, A68 [NASA ADS] [CrossRef] [EDP Sciences] [Google Scholar]
- Belladitta, S., Moretti, A., Caccianiga, A., et al. 2020, A&A, 635, L7 [EDP Sciences] [Google Scholar]
- Belladitta, S., Moretti, A., Caccianiga, A., et al. 2023, A&A, 669, A134 [NASA ADS] [CrossRef] [EDP Sciences] [Google Scholar]
- Bertin, E., & Arnouts, S. 1996, A&AS, 117, 393 [NASA ADS] [CrossRef] [EDP Sciences] [Google Scholar]
- Bischetti, M., Feruglio, C., D’Odorico, V., et al. 2022, Nature, 605, 244 [NASA ADS] [CrossRef] [Google Scholar]
- Bischetti, M., Fiore, F., Feruglio, C., et al. 2023, ApJ, 952, 44 [NASA ADS] [CrossRef] [Google Scholar]
- Bischetti, M., Choi, H., Fiore, F., et al. 2024, ApJ, 970, 9 [NASA ADS] [CrossRef] [Google Scholar]
- Boutsia, K., Osip, D., & Beletsky, Y. 2017, ESO Calibration Workshop: The Second Generation VLT Instruments and Friends, 4 [Google Scholar]
- Bridle, A. H., & Perley, R. A. 1984, ARA&A, 22, 319 [NASA ADS] [CrossRef] [Google Scholar]
- Bruni, G., Piconcelli, E., Misawa, T., et al. 2019, A&A, 630, A111 [NASA ADS] [CrossRef] [EDP Sciences] [Google Scholar]
- Buzzoni, B., Delabre, B., Dekker, H., et al. 1984, Messenger, 38, 9 [Google Scholar]
- Byrne, X., Meyer, R. A., Farina, E. P., et al. 2024, MNRAS, 530, 870 [Google Scholar]
- Caccianiga, A., Moretti, A., Belladitta, S., et al. 2019, MNRAS, 484, 204 [NASA ADS] [CrossRef] [Google Scholar]
- Calderone, G., Guarneri, F., Porru, M., et al. 2024, A&A, 683, A34 [NASA ADS] [CrossRef] [EDP Sciences] [Google Scholar]
- Carnall, A. C., Shanks, T., Chehade, B., et al. 2015, MNRAS, 451, L16 [Google Scholar]
- Chambers, K. C., Magnier, E. A., Metcalfe, N., et al. 2016, ArXiv e-prints [arXiv:1612.05560] [Google Scholar]
- Coatman, L., Hewett, P. C., Banerji, M., et al. 2017, MNRAS, 465, 2120 [Google Scholar]
- Condon, J. J., Cotton, W. D., Greisen, E. W., et al. 1998, AJ, 115, 1693 [Google Scholar]
- Curtis-Lake, E., Carniani, S., Cameron, A., et al. 2023, Nat. Astron., 7, 622 [NASA ADS] [CrossRef] [Google Scholar]
- dal Ponte, M., Santiago, B., Carnero Rosell, A., et al. 2023, MNRAS, 522, 1951 [NASA ADS] [CrossRef] [Google Scholar]
- Davies, R. L., Ryan-Weber, E., D’Odorico, V., et al. 2023, MNRAS, 521, 289 [NASA ADS] [CrossRef] [Google Scholar]
- De Breuck, C., Tang, Y., de Bruyn, A. G., Röttgering, H., & van Breugel, W. 2002, A&A, 394, 59 [NASA ADS] [CrossRef] [EDP Sciences] [Google Scholar]
- De Rosa, G., Venemans, B. P., Decarli, R., et al. 2014, ApJ, 790, 145 [Google Scholar]
- Decarli, R., Walter, F., Venemans, B. P., et al. 2018, ApJ, 854, 97 [Google Scholar]
- Deka, P. P., Gupta, N., Jagannathan, P., et al. 2024, ApJS, 270, 33 [NASA ADS] [CrossRef] [Google Scholar]
- D’Eugenio, F., Cameron, A. J., Scholtz, J., et al. 2025, ApJS, 277, 4 [Google Scholar]
- Dey, A., Schlegel, D. J., Lang, D., et al. 2019, AJ, 157, 168 [Google Scholar]
- Diamond-Stanic, A. M., Fan, X., Brandt, W. N., et al. 2009, ApJ, 699, 782 [NASA ADS] [CrossRef] [Google Scholar]
- Diana, A., Caccianiga, A., Ighina, L., et al. 2022, MNRAS, 511, 5436 [NASA ADS] [CrossRef] [Google Scholar]
- D’Odorico, V., Bañados, E., Becker, G. D., et al. 2023, MNRAS, 523, 1399 [CrossRef] [Google Scholar]
- Dunn, J. P., Arav, N., Aoki, K., et al. 2012, ApJ, 750, 143 [Google Scholar]
- Dye, S., Lawrence, A., Read, M. A., et al. 2018, MNRAS, 473, 5113 [Google Scholar]
- Edge, A., Sutherland, W., Kuijken, K., et al. 2013, Messenger, 154, 32 [Google Scholar]
- Eilers, A. -C., Hennawi, J. F., Decarli, R., et al. 2020, ApJ, 900, 37 [Google Scholar]
- Eilers, A. -C., Simcoe, R. A., Yue, M., et al. 2023, ApJ, 950, 68 [NASA ADS] [CrossRef] [Google Scholar]
- Eisenhardt, P. R. M., Marocco, F., Fowler, J. W., et al. 2020, ApJS, 247, 69 [Google Scholar]
- Elias, J. H., Rodgers, B., Joyce, R. R., et al. 2006a, in Ground-based and Airborne Instrumentation for Astronomy, eds. I. S. McLean, & M. Iye, SPIE Conf. Ser., 6269, 626914 [Google Scholar]
- Elias, J. H., Joyce, R. R., Liang, M., et al. 2006b, in Ground-based and Airborne Instrumentation for Astronomy, eds. I. S. McLean, & M. Iye, SPIE Conf. Ser., 6269, 62694C [Google Scholar]
- Euclid Collaboration (Barnett, R., et al.) 2019, A&A, 631, A85 [NASA ADS] [CrossRef] [EDP Sciences] [Google Scholar]
- Euclid Collaboration (Scaramella, R., et al.) 2022, A&A, 662, A112 [NASA ADS] [CrossRef] [EDP Sciences] [Google Scholar]
- Euclid Collaboration (Mellier, Y., et al.) 2025, A&A, 697, A1 [Google Scholar]
- Fan, X., Strauss, M. A., Gunn, J. E., et al. 1999, ApJ, 526, L57 [NASA ADS] [CrossRef] [Google Scholar]
- Fan, X., Bañados, E., & Simcoe, R. A. 2023, ARA&A, 61, 373 [NASA ADS] [CrossRef] [Google Scholar]
- Farina, E. P., Schindler, J. -T., Walter, F., et al. 2022, ApJ, 941, 106 [NASA ADS] [CrossRef] [Google Scholar]
- Fitzpatrick, E. L. 1999, PASP, 111, 63 [Google Scholar]
- Flaugher, B. 2005, Int. J. Mod. Phys. A, 20, 3121 [Google Scholar]
- Flesch, E. W. 2023, Open J. Astrophys., 6, 49 [NASA ADS] [CrossRef] [Google Scholar]
- Gargiulo, A., Fumana, M., Bisogni, S., et al. 2022, MNRAS, 514, 2902 [NASA ADS] [CrossRef] [Google Scholar]
- Gaskell, C. M. 1982, ApJ, 263, 79 [NASA ADS] [CrossRef] [Google Scholar]
- Ge, X., Zhao, B. -X., Bian, W. -H., & Frederick, G. R. 2019, AJ, 157, 148 [NASA ADS] [CrossRef] [Google Scholar]
- Gibson, R. R., Jiang, L., Brandt, W. N., et al. 2009, ApJ, 692, 758 [Google Scholar]
- Gloudemans, A. J., Duncan, K. J., Röttgering, H. J. A., et al. 2021, A&A, 656, A137 [NASA ADS] [CrossRef] [EDP Sciences] [Google Scholar]
- Gloudemans, A. J., Duncan, K. J., Saxena, A., et al. 2022, A&A, 668, A27 [NASA ADS] [CrossRef] [EDP Sciences] [Google Scholar]
- Gloudemans, A. J., Callingham, J. R., Duncan, K. J., et al. 2023, A&A, 678, A161 [NASA ADS] [CrossRef] [EDP Sciences] [Google Scholar]
- Glowacki, M., Lee-Waddell, K., Deller, A. T., et al. 2023, ApJ, 949, 25 [Google Scholar]
- Greene, J. E., Labbe, I., Goulding, A. D., et al. 2024, ApJ, 964, 39 [CrossRef] [Google Scholar]
- Hale, C. L., McConnell, D., Thomson, A. J. M., et al. 2021, PASA, 38, e058 [NASA ADS] [CrossRef] [Google Scholar]
- Hambly, N. C., Collins, R. S., Cross, N. J. G., et al. 2008, MNRAS, 384, 637 [NASA ADS] [CrossRef] [Google Scholar]
- Hardcastle, M. J., & Croston, J. H. 2020, New Astron. Rev., 88, 101539 [Google Scholar]
- Harikane, Y., Zhang, Y., Nakajima, K., et al. 2023, ApJ, 959, 39 [NASA ADS] [CrossRef] [Google Scholar]
- Heintz, K. E., Brammer, G. B., Watson, D., et al. 2025, A&A, 693, A60 [Google Scholar]
- Hewett, P. C., & Foltz, C. B. 2003, AJ, 125, 1784 [NASA ADS] [CrossRef] [Google Scholar]
- Hurley-Walker, N., Callingham, J. R., Hancock, P. J., et al. 2017, MNRAS, 464, 1146 [Google Scholar]
- Ighina, L., Caccianiga, A., Moretti, A., et al. 2023, MNRAS, 519, 2060 [Google Scholar]
- Ighina, L., Caccianiga, A., Moretti, A., et al. 2024, A&A, 692, A241 [NASA ADS] [CrossRef] [EDP Sciences] [Google Scholar]
- Ighina, L., Caccianiga, A., Moretti, A., et al. 2025, A&A, 698, A158 [NASA ADS] [CrossRef] [EDP Sciences] [Google Scholar]
- Inayoshi, K., Visbal, E., & Haiman, Z. 2020, ARA&A, 58, 27 [NASA ADS] [CrossRef] [Google Scholar]
- Intema, H. T., Jagannathan, P., Mooley, K. P., & Frail, D. A. 2017, A&A, 598, A78 [NASA ADS] [CrossRef] [EDP Sciences] [Google Scholar]
- Irwin, M. J., Lewis, J., Hodgkin, S., et al. 2004, in Optimizing Scientific Return for Astronomy Through Information Technologies, eds. P. J. Quinn, & A. Bridger, SPIE Conf. Ser., 5493, 411 [Google Scholar]
- Ivezić, Ž., Kahn, S. M., Tyson, J. A., et al. 2019, ApJ, 873, 111 [Google Scholar]
- Jiang, L., Fan, X., Ivezić, Ž., et al. 2007, ApJ, 656, 680 [Google Scholar]
- Jiang, L., McGreer, I. D., Fan, X., et al. 2016, ApJ, 833, 222 [Google Scholar]
- Jiang, D., Onoue, M., Jiang, L., et al. 2024, ApJ, 975, 214 [Google Scholar]
- Keller, S. C., Schmidt, B. P., Bessell, M. S., et al. 2007, PASA, 24, 1 [NASA ADS] [CrossRef] [Google Scholar]
- Keller, P. M., Thyagarajan, N., Kumar, A., Kanekar, N., & Bernardi, G. 2024, MNRAS, 528, 5692 [NASA ADS] [CrossRef] [Google Scholar]
- Kellermann, K. I., Sramek, R., Schmidt, M., Shaffer, D. B., & Green, R. 1989, AJ, 98, 1195 [Google Scholar]
- Khusanova, Y., Bañados, E., Mazzucchelli, C., et al. 2022, A&A, 664, A39 [NASA ADS] [CrossRef] [EDP Sciences] [Google Scholar]
- Koribalski, B. S., Staveley-Smith, L., Westmeier, T., et al. 2020, Ap&SS, 365, 118 [Google Scholar]
- Lacy, M., Baum, S. A., Chandler, C. J., et al. 2020, PASP, 132, 035001 [Google Scholar]
- Lambert, T. S., Assef, R. J., Mazzucchelli, C., et al. 2024, A&A, 689, A331 [NASA ADS] [CrossRef] [EDP Sciences] [Google Scholar]
- Lawrence, A., Warren, S. J., Almaini, O., et al. 2007, MNRAS, 379, 1599 [Google Scholar]
- Lenz, L., Mortlock, D. J., Leistedt, B., Barnett, R., & Hewett, P. C. 2024, ArXiv e-prints [arXiv:2408.12770] [Google Scholar]
- Liu, Y., Wang, R., Momjian, E., et al. 2021, ApJ, 908, 124 [Google Scholar]
- Loiacono, F., Decarli, R., Mignoli, M., et al. 2024, A&A, 685, A121 [NASA ADS] [CrossRef] [EDP Sciences] [Google Scholar]
- Luo, B., Brandt, W. N., Hall, P. B., et al. 2015, ApJ, 805, 122 [Google Scholar]
- Lyke, B. W., Higley, A. N., McLane, J. N., et al. 2020, VizieR Online Data Catalog: SDSS Quasar Catalog, Sixteenth Data Release (DR16Q) (Lyke+, 2020), VizieR On-line Data Catalog: VII/289. Originally Published. In: 2020ApJS.250..8L [Google Scholar]
- Madau, P. 1995, ApJ, 441, 18 [NASA ADS] [CrossRef] [Google Scholar]
- Mainzer, A., Bauer, J., Grav, T., et al. 2011, ApJ, 731, 53 [Google Scholar]
- Maiolino, R., Scholtz, J., Curtis-Lake, E., et al. 2024, A&A, 691, A145 [NASA ADS] [CrossRef] [EDP Sciences] [Google Scholar]
- Maiolino, R., Risaliti, G., Signorini, M., et al. 2025, MNRAS, 538, 1921 [Google Scholar]
- Marocco, F., Eisenhardt, P. R. M., Fowler, J. W., et al. 2021, ApJS, 253, 8 [Google Scholar]
- Massaro, F., Giroletti, M., D’Abrusco, R., et al. 2014, ApJS, 213, 3 [NASA ADS] [CrossRef] [Google Scholar]
- Matsuoka, Y., Iwasawa, K., Onoue, M., et al. 2018, ApJS, 237, 5 [Google Scholar]
- Mazzucchelli, C., Bañados, E., Venemans, B. P., et al. 2017, ApJ, 849, 91 [Google Scholar]
- Mazzucchelli, C., Bischetti, M., D’Odorico, V., et al. 2023, A&A, 676, A71 [NASA ADS] [CrossRef] [EDP Sciences] [Google Scholar]
- Mazzucchelli, C., Decarli, R., Belladitta, S., et al. 2025, A&A, 694, A171 [NASA ADS] [CrossRef] [EDP Sciences] [Google Scholar]
- McConnell, D., Hale, C. L., Lenc, E., et al. 2020, PASA, 37, e048 [Google Scholar]
- McGreer, I. D., Jiang, L., Fan, X., et al. 2013, ApJ, 768, 105 [NASA ADS] [CrossRef] [Google Scholar]
- McMahon, R. G., Banerji, M., Gonzalez, E., et al. 2013, Messenger, 154, 35 [Google Scholar]
- McMullin, J. P., Waters, B., Schiebel, D., Young, W., & Golap, K. 2007, in Astronomical Data Analysis Software and Systems XVI, eds. R. A. Shaw, F. Hill, & D. J. Bell, ASP Conf. Ser., 376, 127 [Google Scholar]
- Menzel, M. L., Merloni, A., Georgakakis, A., et al. 2016, MNRAS, 457, 110 [NASA ADS] [CrossRef] [Google Scholar]
- Merloni, A., Lamer, G., Liu, T., et al. 2024, A&A, 682, A34 [NASA ADS] [CrossRef] [EDP Sciences] [Google Scholar]
- Meyer, R. A., Bosman, S. E. I., & Ellis, R. S. 2019, MNRAS, 487, 3305 [Google Scholar]
- Mignoli, M., Gilli, R., Decarli, R., et al. 2020, A&A, 642, L1 [EDP Sciences] [Google Scholar]
- Momjian, E., Bañados, E., Carilli, C. L., Walter, F., & Mazzucchelli, C. 2021, AJ, 161, 207 [NASA ADS] [CrossRef] [Google Scholar]
- Moorwood, A., Cuby, J. G., & Lidman, C. 1998, Messenger, 91, 9 [NASA ADS] [Google Scholar]
- Morabito, L. K., Matthews, J. H., Best, P. N., et al. 2019, A&A, 622, A15 [NASA ADS] [CrossRef] [EDP Sciences] [Google Scholar]
- Mortlock, D. J., Warren, S. J., Venemans, B. P., et al. 2011, Nature, 474, 616 [Google Scholar]
- Nanni, R., Hennawi, J. F., Wang, F., et al. 2022, MNRAS, 515, 3224 [NASA ADS] [CrossRef] [Google Scholar]
- Neeleman, M., Novak, M., Venemans, B. P., et al. 2021, ApJ, 911, 141 [NASA ADS] [CrossRef] [Google Scholar]
- Onken, C. A., Wolf, C., Bian, F., et al. 2022, MNRAS, 511, 572 [NASA ADS] [CrossRef] [Google Scholar]
- Onorato, S., Hennawi, J. F., Schindler, J. -T., et al. 2025, MNRAS, 540, 1308 [Google Scholar]
- Onoue, M., Kashikawa, N., Matsuoka, Y., et al. 2019, ApJ, 880, 77 [Google Scholar]
- Onoue, M., Bañados, E., Mazzucchelli, C., et al. 2020, ApJ, 898, 105 [Google Scholar]
- Plotkin, R. M., Shemmer, O., Trakhtenbrot, B., et al. 2015, ApJ, 805, 123 [Google Scholar]
- Pogge, R. W., Atwood, B., Brewer, D. F., et al. 2010, in Ground-based and Airborne Instrumentation for Astronomy III, eds. I. S. McLean, S. K. Ramsay, & H. Takami, SPIE Conf. Ser., 7735, 77350A [NASA ADS] [Google Scholar]
- Pons, E., McMahon, R. G., Simcoe, R. A., et al. 2019, MNRAS, 484, 5142 [NASA ADS] [CrossRef] [Google Scholar]
- Prochaska, J., Hennawi, J., Westfall, K., et al. 2020, J. Open Source Softw., 5, 2308 [NASA ADS] [CrossRef] [Google Scholar]
- Pudoka, M., Wang, F., Fan, X., et al. 2024, ApJ, 968, 118 [Google Scholar]
- Reed, S. L., McMahon, R. G., Banerji, M., et al. 2015, MNRAS, 454, 3952 [Google Scholar]
- Reed, S. L., McMahon, R. G., Martini, P., et al. 2017, MNRAS, 468, 4702 [NASA ADS] [CrossRef] [Google Scholar]
- Richards, G. T., Kruczek, N. E., Gallagher, S. C., et al. 2011, Am. Astron. Soc. Meet. Abstr., 218, 327.13 [Google Scholar]
- Roberts-Borsani, G., Bagley, M., Rojas-Ruiz, S., et al. 2025, ApJ, 983, 18 [Google Scholar]
- Rodríguez Hidalgo, P., Khatri, A. M., Hall, P. B., et al. 2020, ApJ, 896, 151 [CrossRef] [Google Scholar]
- Ross, N. P., & Cross, N. J. G. 2020, MNRAS, 494, 789 [NASA ADS] [CrossRef] [Google Scholar]
- Schindler, J. -T. 2022, Astrophysics Source Code Library, [record ascl:2202.018] [Google Scholar]
- Schindler, J. -T., Fan, X., Huang, Y. -H., et al. 2019, ApJS, 243, 5 [NASA ADS] [CrossRef] [Google Scholar]
- Schindler, J. -T., Farina, E. P., Bañados, E., et al. 2020, ApJ, 905, 51 [CrossRef] [Google Scholar]
- Schlafly, E. F., Meisner, A. M., & Green, G. M. 2019, ApJS, 240, 30 [Google Scholar]
- Seifert, W., Appenzeller, I., Baumeister, H., et al. 2003, in Instrument Design and Performance for Optical/Infrared Ground-based Telescopes, eds. M. Iye, A. F. M. Moorwood, SPIE Conf. Ser., 4841, 962 [NASA ADS] [CrossRef] [Google Scholar]
- Selsing, J., Fynbo, J. P. U., Christensen, L., & Krogager, J. K. 2016, A&A, 585, A87 [NASA ADS] [CrossRef] [EDP Sciences] [Google Scholar]
- Shen, Y., Greene, J. E., Strauss, M. A., Richards, G. T., & Schneider, D. P. 2008, ApJ, 680, 169 [Google Scholar]
- Shen, Y., Richards, G. T., Strauss, M. A., et al. 2011, ApJS, 194, 45 [Google Scholar]
- Shen, Y., Brandt, W. N., Richards, G. T., et al. 2016, ApJ, 831, 7 [NASA ADS] [CrossRef] [Google Scholar]
- Shen, Y., Wu, J., Jiang, L., et al. 2019, ApJ, 873, 35 [Google Scholar]
- Shimwell, T. W., Hardcastle, M. J., Tasse, C., et al. 2022, A&A, 659, A1 [NASA ADS] [CrossRef] [EDP Sciences] [Google Scholar]
- Simcoe, R. A., Burgasser, A. J., Bernstein, R. A., et al. 2008, in Ground-based and Airborne Instrumentation for Astronomy II, eds. I. S. McLean, & M. M. Casali, SPIE Conf. Ser., 7014, 70140U [Google Scholar]
- Simcoe, R. A., Burgasser, A. J., Schechter, P. L., et al. 2013, PASP, 125, 270 [NASA ADS] [CrossRef] [Google Scholar]
- Steidel, C. C., Giavalisco, M., Pettini, M., Dickinson, M., & Adelberger, K. L. 1996, ApJ, 462, L17 [Google Scholar]
- Stepney, M., Banerji, M., Hewett, P. C., et al. 2023, MNRAS, 524, 5497 [Google Scholar]
- Taylor, A. J., Finkelstein, S. L., Kocevski, D. D., et al. 2025, ApJ, 986, 165 [Google Scholar]
- Tee, W. L., Fan, X., Wang, F., et al. 2023, ApJ, 956, 52 [NASA ADS] [CrossRef] [Google Scholar]
- Tody, D. 1993, in Astronomical Data Analysis Software and Systems II, eds. R. J. Hanisch, R. J. V. Brissenden, & J. Barnes, ASP Conf. Ser., 52, 173 [Google Scholar]
- Torres-Albà, N., Bosch-Ramon, V., & Iwasawa, K. 2020, A&A, 635, A57 [NASA ADS] [CrossRef] [EDP Sciences] [Google Scholar]
- Vanden Berk, D. E., Richards, G. T., Bauer, A., et al. 2001, AJ, 122, 549 [Google Scholar]
- Venemans, B. P., Findlay, J. R., Sutherland, W. J., et al. 2013, ApJ, 779, 24 [Google Scholar]
- Venemans, B. P., Bañados, E., Decarli, R., et al. 2015, ApJ, 801, L11 [Google Scholar]
- Vestergaard, M., & Osmer, P. S. 2009, ApJ, 699, 800 [Google Scholar]
- Vestergaard, M., & Peterson, B. M. 2006, ApJ, 641, 689 [Google Scholar]
- Vestergaard, M., & Wilkes, B. 2001, in Spectroscopic Challenges of Photoionized Plasmas, eds. G. Ferland, & D. W. Savin, ASP Conf. Ser., 247, 359 [Google Scholar]
- Vito, F., Mignoli, M., Gilli, R., et al. 2022, A&A, 663, A159 [NASA ADS] [CrossRef] [EDP Sciences] [Google Scholar]
- Wang, F., Wu, X. -B., Fan, X., et al. 2016, ApJ, 819, 24 [NASA ADS] [CrossRef] [Google Scholar]
- Wang, F., Fan, X., Yang, J., et al. 2017, ApJ, 839, 27 [Google Scholar]
- Wang, F., Yang, J., Fan, X., et al. 2018, ApJ, 869, L9 [NASA ADS] [CrossRef] [Google Scholar]
- Wang, F., Yang, J., Fan, X., et al. 2019, ApJ, 884, 30 [Google Scholar]
- Wang, F., Yang, J., Fan, X., et al. 2021a, ApJ, 907, L1 [Google Scholar]
- Wang, F., Fan, X., Hennawi, J., et al. 2021b, A SPectroscopic Survey of Biased Halos In the Reionization Era (ASPIRE): A JWST Quasar Legacy Survey, JWST Proposal. Cycle 1, ID. #2078 [Google Scholar]
- Wang, F., Yang, J., Fan, X., et al. 2024, ApJ, 968, 9 [NASA ADS] [CrossRef] [Google Scholar]
- Wayth, R. B., Lenc, E., Bell, M. E., et al. 2015, PASA, 32, e025 [Google Scholar]
- Wenzl, L., Schindler, J. -T., Fan, X., et al. 2021, AJ, 162, 72 [NASA ADS] [CrossRef] [Google Scholar]
- Weymann, R. J., Morris, S. L., Foltz, C. B., & Hewett, P. C. 1991, ApJ, 373, 23 [NASA ADS] [CrossRef] [Google Scholar]
- Wilson, J. C., Henderson, C. P., Herter, T. L., et al. 2004, in Ground-based Instrumentation for Astronomy, eds. A. F. M. Moorwood, & M. Iye, SPIE Conf. Ser., 5492, 1295 [Google Scholar]
- Wolf, C., Bian, F., Onken, C. A., et al. 2018, PASA, 35, e024 [Google Scholar]
- Wolf, C., Hon, W. J., Bian, F., et al. 2020, MNRAS, 491, 1970 [NASA ADS] [CrossRef] [Google Scholar]
- Wolf, C., Lai, S., Onken, C. A., et al. 2024a, Nat. Astron., 8, 520 [Google Scholar]
- Wolf, J., Salvato, M., Belladitta, S., et al. 2024b, A&A, 691, A30 [NASA ADS] [CrossRef] [EDP Sciences] [Google Scholar]
- Wright, A. E., Griffith, M. R., Burke, B. F., & Ekers, R. D. 1994, ApJS, 91, 111 [Google Scholar]
- Wright, E. L., Eisenhardt, P. R. M., Mainzer, A. K., et al. 2010, AJ, 140, 1868 [Google Scholar]
- Wu, Q., & Shen, Y. 2022, ApJS, 263, 42 [NASA ADS] [CrossRef] [Google Scholar]
- Wu, J., Brandt, W. N., Hall, P. B., et al. 2011, ApJ, 736, 28 [NASA ADS] [CrossRef] [Google Scholar]
- Wu, X. -B., Wang, F., Fan, X., et al. 2015, Nature, 518, 512 [Google Scholar]
- Yang, Q., & Shen, Y. 2023, ApJS, 264, 9 [NASA ADS] [CrossRef] [Google Scholar]
- Yang, J., Wang, F., Wu, X. -B., et al. 2016, ApJ, 829, 33 [NASA ADS] [CrossRef] [Google Scholar]
- Yang, J., Wang, F., Fan, X., et al. 2020a, ApJ, 897, L14 [Google Scholar]
- Yang, J., Wang, F., Fan, X., et al. 2020b, ApJ, 904, 26 [Google Scholar]
- Yang, J., Wang, F., Fan, X., et al. 2021, ApJ, 923, 262 [NASA ADS] [CrossRef] [Google Scholar]
- Yang, J., Fan, X., Gupta, A., et al. 2023, ApJS, 269, 27 [NASA ADS] [CrossRef] [Google Scholar]
- Yang, D. -M., Schindler, J. -T., Nanni, R., et al. 2024, MNRAS, 528, 2679 [CrossRef] [Google Scholar]
- York, D. G., Adelman, J., Anderson, J. E. Jr., et al. 2000, AJ, 120, 1579 [Google Scholar]
- Zensus, J. A. 1997, ARA&A, 35, 607 [NASA ADS] [CrossRef] [Google Scholar]
Appendix A: Broad-band photometry of the newly reported quasars
In this section, we present the AB magnitudes – corrected for Galactic extinction as described at the end of Sect. 1 – from optical to NIR bands, of all 25 newly identified quasars discussed in this paper. We divided the sources into two tables: quasars selected from DELS+PS1 (see Sect. 2.3) are listed in Table A.2, while all others are reported in Table A.1. Only for the sources selected from YS23 we report the information taken from the original catalog: ID, zphot, zphot range and probability to be a true quasar at that redshift.
Photometric properties (AB mag corrected for Galactic extinction) of the newly discovered quasars reported in this paper, except for the sources selected from DELS+PS1, whose magnitudes are reported in Table A.2.
Photometric properties (AB mag corrected for Galactic extinction) of the six new quasars discovered by DELS+PS1 selection (first part) and the six already know in the literature for which we report unpublished spectroscopic observations (second part).
Appendix B: DELS+PS1 candidates already reported as high-z quasars in the literature
In this Appendix we list the candidates selected from the combination of the DELS and PS1 data (described in Section 2.3) that have been already published in the literature. These are 16 quasars at redshift between 6.4 and 7.0. In Table B.1 we report quasar name, coordinates, redshift, photometric information and reference papers. The photometric properties include new NIR imaging follow-up data for the quasar PSO J137+16 and PSO J027−28. This latter was observed with th J, H and Ks filters of the NTT/SofI instrument on November 20, 2020 (900s in J and H bands and 1200s in Ks band). We observed PSO J137+16 in H and Ks-band filters with NTT/SofI on January 23, 2023, for a total exposure time of 1800 and 1200s, respectively. The images were reduced with the same procedure described in Sect. 3.1.
We further report the radio detection of the quasar PSO J184+45. It is clearly detected (5σ) in the LOFAR LoTSS survey. From a Gaussian fit performed by using the CASA software, we measured a peak flux density of 325±62 μJy. We calculated the value of R following the same steps applied to PSO J164+29 (described in the main text, section 4.1.9). We estimated a value of 15±5, which classifies the source as radio loud. However, as for PSO J164+29, PSO J184+45 is not detected in other published radio surveys, therefore additional multiband radio data will be essential to reinforce this classification.
Properties of the 16 quasars selected from DELS+PS1 already reported in the literature.
Appendix C: Rejected candidates
C.1. Candidates discarded from MQC and from YS23
In Table C.1 we report the sources discarted from our list of candidates selected from the MQC because of a further cross-match with SIMBAD and SDSS DR18: two objects are true quasars at z>4 already published, two sources are classified as galaxies, and for the remaining 6 the SDSS spectral classification is unclear (and beyond the scope of this paper), but they are not quasars at z>4.
Candidates discarded from MQC selection.
Instead, visual inspection of the optical and NIR images of the YS23 candidates led us to discard 5 sources (see Table C.2): 4 objects with no signal at all in the optical bands and 1 object that is only detected as a bright and extended source in i−band Decals. We note that for each of these discarded sources from the YS23 catalog, the probability of being high-z quasars reported in the catalog is greater than 98.57%.
Candidates discarded from YS23 selection.
C.2. Spectroscopically rejected candidates
Table C.3 lists 73 candidates whose spectra showed they were not high-z quasars. Objects with a CLASS value of 1 are cool dwarfs, while sources with a CLASS value of 2 and 3 are more likely low-z galaxies and unknown-type objects, respectively. A thorough classification of these objects is beyond the scope of this work.
Candidates spectroscopically confirmed to not be high-z quasars
We note that two sources (PSO J027−45 and PSO J047−60) have been classified as ultra cool dwarf by dal Ponte et al. (2023).
The radio candidate ILT J0010+3239 as been classified as a M7 dwarf by Gloudemans et al. (2023).
Also, three objects from the YS23 catalog, with a probability of being z>6 quasars larger than 99%, turned out to be contaminants after a dedicated spectroscopic follow-up with NTT/EFOSC2: YS J041−29 belongs to CLASS number 3, YS J049−34 is a cool dwarf (CLASS 1) and YS J066−28 turned out to be a low−z galaxy (CLASS 2).
Appendix D: Acknowledgements
We thank the anonymous referee for their valuable suggestions, which improved the quality and clarity of this paper. L.F. acknowledges support from the INAF 2023 mini-grant Exploiting the powerful capabilities of JWST/NIRSpec to unveil the distant Universe and from the INAF GO 2022 grant The birth of the giants: JWST sheds light on the build-up of quasars at cosmic dawn. C.M. acknowledges support from Fondecyt Iniciacion grant 11240336 and the ANID BASAL project FB210003. E.P.F. is supported by the international Gemini Observatory, a program of NSF NOIRLab, which is managed by the Association of Universities for Research in Astronomy (AURA) under a cooperative agreement with the U.S. National Science Foundation, on behalf of the Gemini partnership of Argentina, Brazil, Canada, Chile, the Republic of Korea, and the United States of America. We thank Prof. Patrick Hall and Prof. Paola Rodrigrez Hidalgo for their valuable comments. This work is based on observations collected at the European Southern Observatory under ESO programmes 0102.A-0233(A), 0104.A-0609(A), 105.203B.001, 0106.A-0540(A), 108.226E.002, 110.23RN.001, 110.23RN.002, 112.25VZ.001 and 112.25VZ.002 and observations collected at the Nordic Optical Telescope under program ID P59-015 and P61-003. This paper includes data from the LBT. The LBT is an international collaboration among institutions in the United States, Italy, and Germany. The LBT Corporation partners are: The University of Arizona on behalf of the Arizona university system; Istituto Nazionale di Astrofisica, Italy; LBT Beteiligungsgesellschaft, Germany, representing the Max Planck Society, the Astrophysical Institute Potsdam, and Heidelberg University; The Ohio State University; The Research Corporation, on behalf of The University of Notre Dame, University of Minnesota and University of Virginia. This work includes data gathered with the 6.5 m Magellan Telescopes located at Las Campanas Observatory, Chile. This paper is based on observations collected with the Magellan/LDSS3 under the programme allocated by the Chilean Telescope Allocation Committee (CNTAC) no:CN2025A-26. Some of the data presented in this paper were obtained at the W.M. Keck Observatory, which is operated as a scientific partnership among the California Institute of Technology, the University of California and the National Aeronautics and Space Administration. The Observatory was made possible by the generous financial support of the W.M. Keck Foundation. Based on observations obtained at the international Gemini Observatory (under program: GN-2018B-Q-202), a program of NSF's NOIRLab, which is managed by the Association of Universities for Research in Astronomy (AURA) under a cooperative agreement with the National Science Foundation on behalf of the Gemini Observatory partnership: the National Science Foundation (United States), National Research Council. The Pan-STARRS1 Surveys (PS1) and the PS1 public science archive have been made possible through contributions by the Institute for Astronomy, the University of Hawaii, the Pan-STARRS Project Office, the Max-Planck Society and its participating institutes, the Max Planck Institute for Astron- omy, Heidelberg and the Max Planck Institute for Extra- terrestrial Physics, Garching, The Johns Hopkins University, Durham University, the University of Edinburgh, the Queen's University Belfast, the Harvard-Smithsonian Center for Astro- physics, the Las Cumbres Observatory Global Telescope Network Incorporated, the National Central University of Taiwan, the Space Telescope Science Institute, the National Aeronautics and Space Administration under Grant No. NNX08AR22G issued through the Planetary Science Division of the NASA Science Mission Directorate, the National Science Foundation Grant No. AST-1238877, the University of Maryland, Eotvos Lorand University (ELTE), the Los Alamos National Laboratory, and the Gordon and Betty Moore Foundation. The Legacy Surveys consist of three individual and complementary projects: the Dark Energy Camera Legacy Survey (DECaLS; Proposal ID 2014B-0404; PIs: David Schlegel and Arjun Dey), the Beijing-Arizona Sky Survey (BASS; NOAO Prop. ID 2015A-0801; PIs: Zhou Xu and Xiaohui Fan), and the Mayall z-band Legacy Survey (MzLS; Prop. ID 2016A-0453; PI: Arjun Dey). DECaLS, BASS and MzLS together include data obtained, respectively, at the Blanco telescope, Cerro Tololo Inter-American Observatory, NSF's NOIRLab; the Bok telescope, Steward Observatory, University of Arizona; and the Mayall telescope, Kitt Peak National Observatory, NOIRLab. Pipeline processing and analyses of the data were supported by NOIRLab and the Lawrence Berkeley National Laboratory (LBNL). The Legacy Surveys project is honored to be permitted to conduct astronomical research on Iolkam Du’ag (Kitt Peak), a mountain with particular significance to the Tohono O’odham Nation. NOIRLab is operated by the Association of Universities for Research in Astronomy (AURA) under a cooperative agreement with the National Science Foundation. LBNL is managed by the Regents of the University of California under contract to the U.S. Department of Energy. This project used data obtained with the Dark Energy Camera (DECam), which was constructed by the Dark Energy Survey (DES) collaboration. Funding for the DES Projects has been provided by the U.S. Department of Energy, the U.S. National Science Foundation, the Ministry of Science and Education of Spain, the Science and Technology Facilities Council of the United Kingdom, the Higher Education Funding Council for England, the National Center for Supercomputing Applications at the University of Illinois at Urbana-Champaign, the Kavli Institute of Cosmological Physics at the University of Chicago, Center for Cosmology and Astro-Particle Physics at the Ohio State University, the Mitchell Institute for Fundamental Physics and Astronomy at Texas A&M University, Financiadora de Estudos e Projetos, Fundacao Carlos Chagas Filho de Amparo, Financiadora de Estudos e Projetos, Fundacao Carlos Chagas Filho de Amparo a Pesquisa do Estado do Rio de Janeiro, Conselho Nacional de Desenvolvimento Cientifico e Tecnologico and the Ministerio da Ciencia, Tecnologia e Inovacao, the Deutsche Forschungsgemeinschaft and the Collaborating Institutions in the Dark Energy Survey. The Collaborating Institutions are Argonne National Laboratory, the University of California at Santa Cruz, the University of Cambridge, Centro de Investigaciones Energeticas, Medioambientales y Tecnologicas-Madrid, the University of Chicago,
University College London, the DES-Brazil Consortium, the University of Edinburgh, the Eidgenossische Technische Hochschule (ETH) Zurich, Fermi National Accelerator Laboratory, the University of Illinois at Urbana-Champaign, the Institut de Ciencies de l’Espai (IEEC/CSIC), the Institut de Fisica d’Altes Energies, Lawrence Berkeley National Laboratory, the Ludwig Maximilians Universitat Munchen and the associated Excellence Cluster Universe, the University of Michigan, NSF's NOIRLab, the University of Nottingham, the Ohio State University, the University of Pennsylvania, the University of Portsmouth, SLAC National Accelerator Laboratory, Stanford University, the University of Sussex, and Texas A&M University. BASS is a key project of the Telescope Access Program (TAP), which has been funded by the National Astronomical Observatories of China, the Chinese Academy of Sciences (the Strategic Priority Research Program “The Emergence of Cosmological Structures” Grant # XDB09000000), and the Special Fund for Astronomy from the Ministry of Finance. The BASS is also supported by the External Cooperation Program of Chinese Academy of Sciences (Grant # 114A11KYSB20160057), and Chinese National Natural Science Foundation (Grant # 12120101003, #11433005). The Legacy Survey team makes use of data products from the Near-Earth Object Wide-field Infrared Survey Explorer (NEOWISE), which is a project of the Jet Propulsion Laboratory/California Institute of Technology. NEOWISE is funded by the National Aeronautics and Space Administration. The Legacy Surveys imaging of the DESI footprint is supported by the Director, Office of Science, Office of High Energy Physics of the U.S. Department of Energy under Contract No. DE-AC02-05CH1123, by the National Energy Research Scientific Computing Center, a DOE Office of Science User Facility under the same contract; and by the U.S. National Science Foundation, Division of Astronomical Sciences under Contract No. AST-0950945 to NOAO. This project used public archival data from the Dark Energy Survey (DES). Funding for the DES Projects has been provided by the U.S. Department of Energy, the U.S. National Science Foundation, the Ministry of Science and Education of Spain, the Science and Technology FacilitiesCouncil of the United Kingdom, the Higher Education Funding Council for England, the National Center for Supercomputing Applications at the University of Illinois at Urbana-Champaign, the Kavli Institute of Cosmological Physics at the University of Chicago, the Center for Cosmology and Astro-Particle Physics at the Ohio State University, the Mitchell Institute for Fundamental Physics and Astronomy at Texas A&M University, Financiadora de Estudos e Projetos, Fundação Carlos Chagas Filho de Amparo à Pesquisa do Estado do Rio de Janeiro, Conselho Nacional de Desenvolvimento Científico e Tecnológico and the Ministério da Ciência, Tecnologia e Inovação, the Deutsche Forschungsgemeinschaft, and the Collaborating Institutions in the Dark Energy Survey. The Collaborating Institutions are Argonne National Laboratory, the University of California at Santa Cruz, the University of Cambridge, Centro de Investigaciones Energéticas, Medioambientales y Tecnológicas-Madrid, the University of Chicago, University College London, the DES-Brazil Consortium, the University of Edinburgh, the Eidgenössische Technische Hochschule (ETH) Zürich, Fermi National Accelerator Laboratory, the University of Illinois at Urbana-Champaign, the Institut de Ciències de l’Espai (IEEC/CSIC), the Institut de Física d’Altes Energies, Lawrence Berkeley National Laboratory, the Ludwig-Maximilians Universität München and the associated Excellence Cluster Universe, the University of Michigan, the National Optical Astronomy Observatory, the University of Nottingham, The Ohio State University, the OzDES Membership Consortium, the University of Pennsylvania, the University of Portsmouth, SLAC National Accelerator Laboratory, Stanford University, the University of Sussex, and Texas A&M University. Based in part on observations at Cerro Tololo Inter-American Observatory, National Optical Astronomy Observatory, which is operated by the Association of Universities for Research in Astronomy (AURA) under a cooperative agreement with the National Science Foundation. This publication makes use of data products from the Wide-field Infrared Survey Explorer, which is a joint project of the University of California, Los Angeles, and the Jet Propulsion Laboratory/Caltech, funded by the National Aeronautics and Space Administration. Based on observation obtained as part of the VISTA Hemisphere Survey, ESO Program, 179.A-2010 (PI: McMahon). This publication has made use of data from the VIKING survey from VISTA at the ESO Paranal Observatory, program ID 179.A-2004. The VISTA Data Flow System pipeline processing and science archive are described in Irwin et al. (2004) and Hambly et al. (2008). The NVSS and VLASS data was taken by the NRAO Very Large Array. The National Radio Astronomy Observatory is a facility of the National Science Foundation operated under cooperative agreement by Associated Universities, Inc. This paper includes archived data obtained through the CSIRO ASKAP Science Data Archive, CASDA (http://data.csiro.au). This scientific work uses data obtained from Inyarrimanha Ilgari Bundara / the Murchison Radio-astronomy Observatory. We acknowledge the Wajarri Yamaji People as the Traditional Owners and native title holders of the Observatory site. CSIRO's ASKAP radio telescope is part of the Australia Telescope National Facility (https://ror.org/05qajvd42). Operation of ASKAP is funded by the Australian Government with support from the National Collaborative Research Infrastructure Strategy. ASKAP uses the resources of the Pawsey Supercomputing Research Centre. Establishment of ASKAP, Inyarrimanha Ilgari Bundara, the CSIRO Murchison Radio-astronomy Observatory and the Pawsey Supercomputing Research Centre are initiatives of the Australian Government, with support from the Government of Western Australia and the Science and Industry Endowment Fund. This paper includes archived data obtained through the CSIRO ASKAP Science Data Archive, CASDA (https://data.csiro.au). LOFAR data products were provided by the LOFAR Surveys Key Science project (LSKSP; https://lofar-surveys.org/) and were derived from observations with the International LOFAR Telescope (ILT). LOFAR (van Haarlem et al. 2013) is the Low Frequency Array designed and constructed by ASTRON. It has observing, data processing, and data storage facilities in several countries, which are owned by various parties (each with their own funding sources), and which are collectively operated by the ILT foundation under a joint scientific policy. The efforts of the LSKSP have benefited from funding from the European Research Council, NOVA, NWO, CNRS-INSU, the SURF Co-operative, the UK Science and Technology Funding Council and the Jülich Supercomputing Centre. This research made use of Astropy, a community-developed core Python package for Astronomy (Astropy Collaboration 2018).
All Tables
Photometric properties (AB mag corrected for Galactic extinction) of the newly discovered quasars reported in this paper, except for the sources selected from DELS+PS1, whose magnitudes are reported in Table A.2.
Photometric properties (AB mag corrected for Galactic extinction) of the six new quasars discovered by DELS+PS1 selection (first part) and the six already know in the literature for which we report unpublished spectroscopic observations (second part).
Properties of the 16 quasars selected from DELS+PS1 already reported in the literature.
All Figures
|
Fig. 1. Redshift vs. zP1−zDE (bottom) and zDE−yP1 (top) colors. The solid blue, black, and red lines represent the color tracks of composite quasar spectra from Bañados et al. (2016) and illustrate weak, average, and strong Lyα emission lines, respectively. The dotted lines indicate the color cuts for the [DELS+PS1] selection, as described in Section 2.3. The red circles represent quasars that meet the selection criteria. The sources marked with a yellow cross are newly discovered quasars from this study, while those with a white cross are known quasars for which we present new spectroscopy data. The lower limits correspond to sources that are not detected in zP1, for which we used their 3σ limiting magnitude. On the right, we show the histograms of the same colors for the L and T dwarfs compiled by Bañados et al. (2016). |
| In the text | |
|
Fig. 2. Newly discovered spectra (25 sources; the asterisk marks radio-loud objects) and new spectra publication (six objects, marked with a star) for the quasars reported in this paper. Only the part of the spectrum that covers the Lyman-α break is shown here. The noise spectrum is reported in gray. Sorted by increasing redshift. |
| In the text | |
|
Fig. 3. Near-IR follow-up spectra of a subsample of quasars reported in this paper (sorted by increasing redshift). We show the NIR spectra of the newly discovered quasars PSO J041+06, PSO J335−15, PSO J067−14, PSO J217+04, PSO J037−08, and PSO J289+50 and the newly published NIR spectrum for the already known quasar PSO J162−01. The noise spectra are reported in gray. The shaded light gray areas highlight regions that are strongly affected by telluric absorption. The location of the main emission lines according to the Mg II redshift is also shown at the top: Lyman-α+N V (dashed), C IV (dotted), and Mg II (dash-dotted). |
| In the text | |
|
Fig. 4. Radio flux densities as a function of the observed (bottom x-axis) and rest-frame (top x-axis) frequency of MQC J021+19 (left), MQC J133−02 (central), and PSO J200−13 (right). The corresponding radio surveys are shown in the legend. Due to the potential flux density variability of MQC 021+19, we report the spectral fit of the two values closest in time (RACS_mid and VLASS 2.2). Similarly for PSO J200−13, which shows clear evidence of variability on timescales of years. We report the single power-law fit computed between WALLABY December 2021 and VLASS 2.2, which are the two values closest in time. |
| In the text | |
|
Fig. 5. Normalized spectrum of PSO J067−14, smoothed to 500 km s−1. The velocity axis in each panel is relative to the rest-frame wavelength of the ionic species indicated by the label. The vertical solid, dashed, dotted, and dash-dotted lines indicate the velocity associated with the C IV, Si IV, N V, and Mg II emission lines, respectively. The solid (dashed) horizontal line represents a flux level of 1.0 (0.9). BAL troughs, corresponding to a flux level <0.9 (Weymann et al. 1991), are highlighted as shaded green areas. The shaded red area indicates a potential extremely high-velocity (∼47 000 km s−1) C IV BAL. |
| In the text | |
|
Fig. 6. Close-up views of the spectral fit of the C IV and Mg II BELs. The orange curves depict the models we fit, which consist of Gaussian components for the emission lines and a continuum model (see text for details). The transparent vertical blue line indicates the position of the lines based on the redshift reported in Table 2 (i.e., the Mg II-based redshifts). The same redshifts were used to draw the rest-frame wavelength x-axes. To fit the C IV line in the spectra of PSO J067−14 and PSO J289+50, the absorption features were masked. |
| In the text | |
|
Fig. 7. C IV EW as a function of the C IV–Mg II velocity shift for seven quasars reported in this paper. The dark blue triangles represent z>5.7 quasars from Shen et al. (2019), Schindler et al. (2020) and Yang et al. (2021), and the light blue stars show the WLQ samples of Wu et al. (2011), Luo et al. (2015), and Plotkin et al. (2015). The gray contours and gray dots show the low-z comparison sample at 0.35 <z< 2.25 from the SDSS DR16 catalog of Wu & Shen (2022). Our sample generally follows the high-z quasars distribution. The only exception is the quasar PSO J041+06, which shows a velocity shift >9000 km s−1 and an EW value of 6 Å, typical of a WLQ. The only object similar to PSO J041+06 is J1219+1244 at z= 2.233. |
| In the text | |
|
Fig. 8. Bolometric luminosities vs. Mg II black hole masses of seven quasars reported in this paper. We also show z≥6 quasars from the literature (dark blue dots; Fan et al. 2023; Mazzucchelli et al. 2023) and quasars at 0.35 <z< 2.25 from the SDSS DR16 catalog (gray contours and gray points; Wu & Shen 2022). The dotted black lines show the location of a constant accretion rate at 0.01, 0.1, and 1 times the Eddington luminosity. Our quasars reside in the same parameter space as the population of z>6 quasars. |
| In the text | |
Current usage metrics show cumulative count of Article Views (full-text article views including HTML views, PDF and ePub downloads, according to the available data) and Abstracts Views on Vision4Press platform.
Data correspond to usage on the plateform after 2015. The current usage metrics is available 48-96 hours after online publication and is updated daily on week days.
Initial download of the metrics may take a while.