Fig. 5.
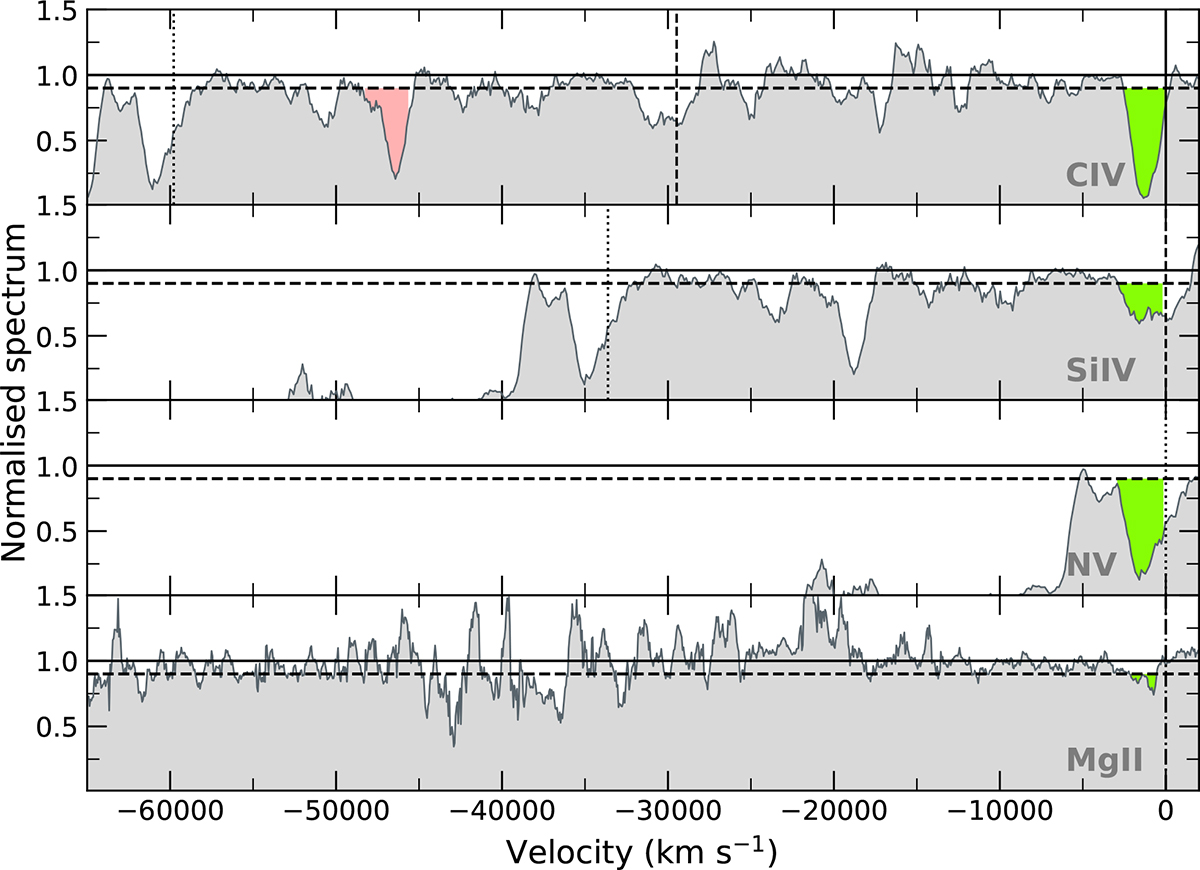
Download original image
Normalized spectrum of PSO J067−14, smoothed to 500 km s−1. The velocity axis in each panel is relative to the rest-frame wavelength of the ionic species indicated by the label. The vertical solid, dashed, dotted, and dash-dotted lines indicate the velocity associated with the C IV, Si IV, N V, and Mg II emission lines, respectively. The solid (dashed) horizontal line represents a flux level of 1.0 (0.9). BAL troughs, corresponding to a flux level <0.9 (Weymann et al. 1991), are highlighted as shaded green areas. The shaded red area indicates a potential extremely high-velocity (∼47 000 km s−1) C IV BAL.
Current usage metrics show cumulative count of Article Views (full-text article views including HTML views, PDF and ePub downloads, according to the available data) and Abstracts Views on Vision4Press platform.
Data correspond to usage on the plateform after 2015. The current usage metrics is available 48-96 hours after online publication and is updated daily on week days.
Initial download of the metrics may take a while.