Fig. 6.
Download original image
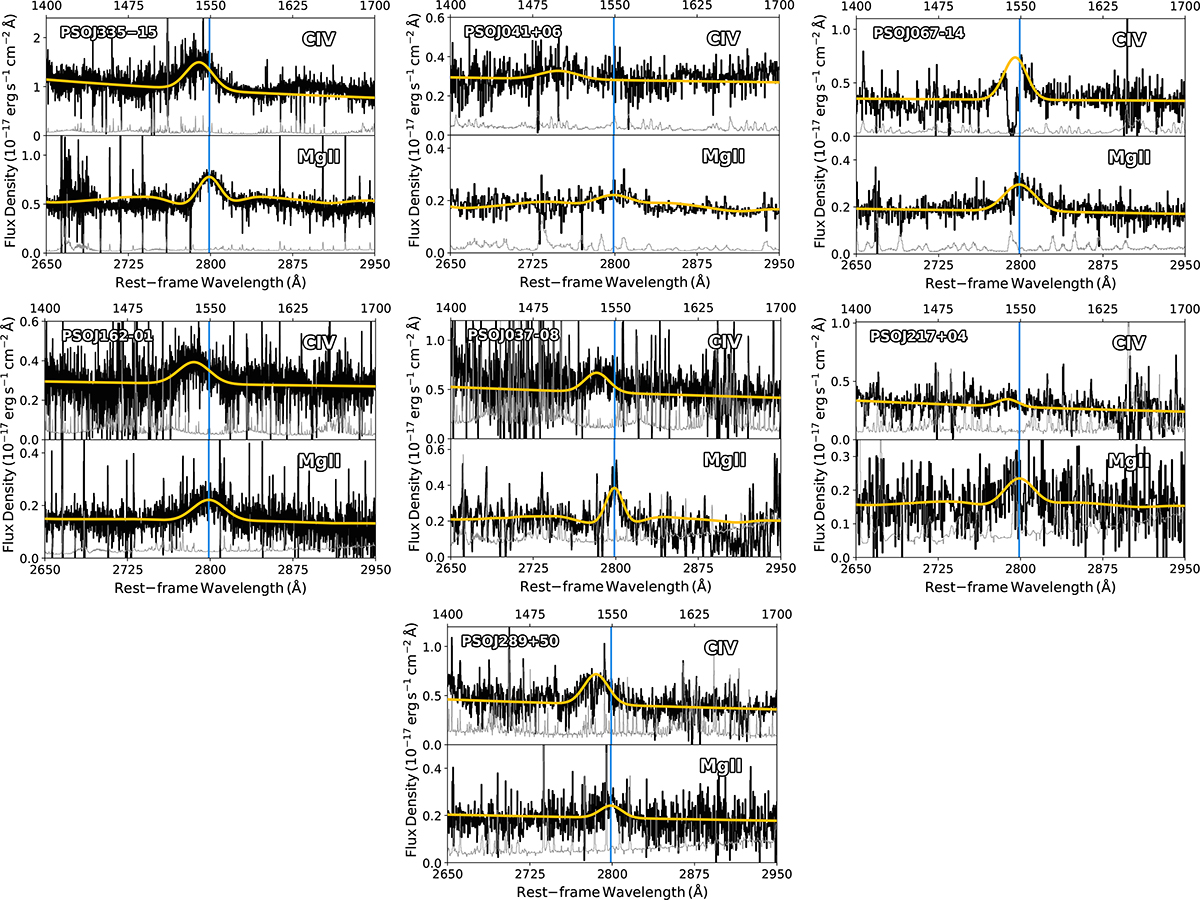
Close-up views of the spectral fit of the C IV and Mg II BELs. The orange curves depict the models we fit, which consist of Gaussian components for the emission lines and a continuum model (see text for details). The transparent vertical blue line indicates the position of the lines based on the redshift reported in Table 2 (i.e., the Mg II-based redshifts). The same redshifts were used to draw the rest-frame wavelength x-axes. To fit the C IV line in the spectra of PSO J067−14 and PSO J289+50, the absorption features were masked.
Current usage metrics show cumulative count of Article Views (full-text article views including HTML views, PDF and ePub downloads, according to the available data) and Abstracts Views on Vision4Press platform.
Data correspond to usage on the plateform after 2015. The current usage metrics is available 48-96 hours after online publication and is updated daily on week days.
Initial download of the metrics may take a while.