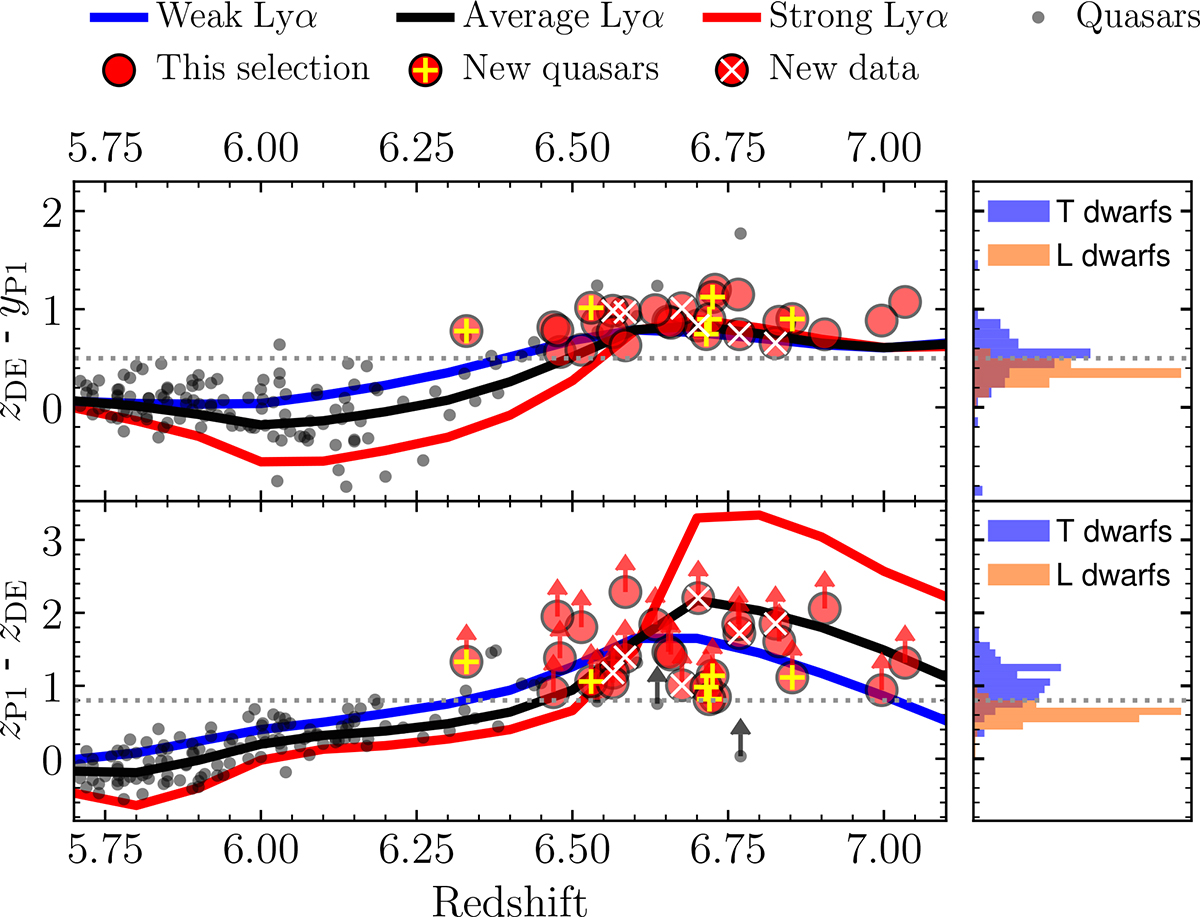
Fig. 1.
Download original image
Redshift vs. zP1−zDE (bottom) and zDE−yP1 (top) colors. The solid blue, black, and red lines represent the color tracks of composite quasar spectra from Bañados et al. (2016) and illustrate weak, average, and strong Lyα emission lines, respectively. The dotted lines indicate the color cuts for the [DELS+PS1] selection, as described in Section 2.3. The red circles represent quasars that meet the selection criteria. The sources marked with a yellow cross are newly discovered quasars from this study, while those with a white cross are known quasars for which we present new spectroscopy data. The lower limits correspond to sources that are not detected in zP1, for which we used their 3σ limiting magnitude. On the right, we show the histograms of the same colors for the L and T dwarfs compiled by Bañados et al. (2016).
Current usage metrics show cumulative count of Article Views (full-text article views including HTML views, PDF and ePub downloads, according to the available data) and Abstracts Views on Vision4Press platform.
Data correspond to usage on the plateform after 2015. The current usage metrics is available 48-96 hours after online publication and is updated daily on week days.
Initial download of the metrics may take a while.